Article
J. Braz. Chem. Soc., Vol. 22, No. 8, 1493-1504, 2011. Printed in Brazil - ©2011 Sociedade Brasileira de Química
0103 - 5053 $6.00+0.00
A
*e-mail: marcelolima@iec.pa.gov.br
Assessment of Surface Water in Two Amazonian Rivers Impacted by
Industrial Wastewater, Barcarena City, Pará State (Brazil)
Marcelo de O. Lima,*,a,b Elisabeth C. O. Santos,a Iracina M. de Jesus,a
Adaelson C. Medeiros,a Kelson do C. F. Faiala and Cláudio N. Alvesb
aSeção de Meio Ambiente, Instituto Evandro Chagas, Rod. BR-316, km 7 s/n, Levilândia, 67030-000 Ananindeua-PA, Brazil
bPrograma de Pós-Graduação em Química, Universidade Federal do Pará, Rua Augusto Corre s/n,
Campus Básico, Guamá, 66000-000 Belém-PA, Brazil
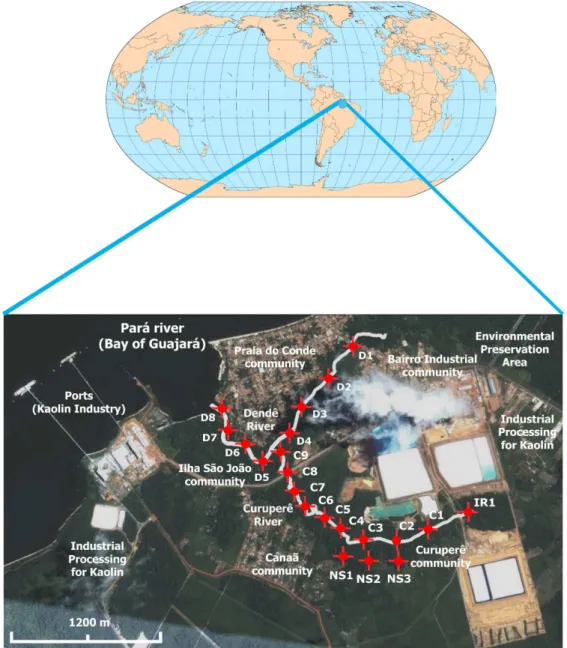
No ano de 2007, águas supericiais foram coletadas a partir de 21 pontos de amostragem na cidade de Barcarena, Região Norte, Brasil: um ponto de amostragem localizado em um pequeno córrego que recebe descarga de resíduos a partir da indústria de beneiciamento do caulim e deságua no Rio Curuperê, três pontos de amostragens localizados próximos de fontes que emergem na margem esquerda e deságuam no Rio Curuperê, nove pontos de amostragem no Rio Curuperê, que deságua no Rio Dendê, e oito no Rio Dendê, aluente da margem esquerda do Rio Pará. Para todas as amostras de água foram quantiicadas 14 variáveis físico-químicas e níveis de 12 metais. Os resultados nos pontos próximos das fontes do Rio Curuperê apresentaram peril físico-químico e níveis de metais típicos para águas supericiais e esses valores foram utilizados como referência para comparar e identiicar possíveis alterações nas características químicas para os demais pontos de amostragem. Quando os resultados das fontes do rio Curuperê foram comparados com os resultados do ponto próximo a descarga de resíduos industriais foram observadas fortes alterações nos valores de 6 variáveis físico-químicas (pH, condutividade elétrica (EC), total de sólidos suspensos (TDS), nitrogênio amoniacal (N-NH4), sulfato (SO4) e salinidade) e aumento em magnitude dos níveis de quatro metais (Al, Fe, Mn e Zn), caracterizando que esses resíduos eram descarregados no ambiente sem tratamentos adequados. Os resultados nos demais pontos de amostragem demonstraram que estas condições anômalas também foram encontradas ao longo dos Rios Curuperê e Dendê, principalmente durante a maré baixa. A partir desta caracterização química das águas foram identiicadas condições prejudiciais aos ecossistemas aquáticos e potencial risco à saúde da população local que usa os rios para consumo, recreação e transporte.
In 2007, surface waters were collected from 21 sampling points in Barcarena City in Northern Region of Brazil: one sampling point located in a stream that receives discharge of wastewater from a kaolin processing industry and lows into the Curuperê River, three sampling points located near sources that emerge on the left bank and low into the Curuperê River, nine sampling points in Curuperê River, which lows into the Dendê River, and eight in Dendê River, a tributary on the right bank of the Pará River. For all water samples were quantiied 14 physicochemical variables and levels of 12 metals. The results in the points near the sources of the Curuperê River presented physicochemical proile and metal levels which are typical of surface waters being used as reference to compare and identify possible changes in the chemical characteristics of the other sampling points. The comparison between the results obtained for the sources of the Curuperê River and the ones for the point near the discharge of industrial wastewater revealed strong changes in the values of 6 physicochemical variables (pH, electrical conductivity (EC), total dissolved solids (TDS), sulfate (SO4), ammoniacal nitrogen (NH4-N) and salinity) and an increase in magnitude of the levels of four metals (Al, Fe, Mn and Zn). These facts characterized that the wastewaters were discharged into the environment without adequate treatment. Results in other sampling sites showed that these anomalous conditions were also found along the Curuperê and Dendê Rivers, especially during low tide. This chemical characterization of the waters allowed to identify harmful conditions to aquatic ecosystems and potential health risk for the local people, who use the rivers for drinking water, recreation and transportation.
Introduction
The industrialization process accelerated since the last century increased the pressure on the environment from the intensive use of mineral resource and large amount of wastewater discharged into bays, rivers and lakes. In these drainages, the knowledge of the physicochemical conditions and the measurements of the metal levels in surface waters are control information which is relevant to environmental preservation and maintenance of life.1-7
Kaolin is a type of clay rich in kaolinite that is economically important and has several applications, including as paper coating, component in ceramics and refractory materials, disperser for paints, in rubber articles and in preparing insecticides and chemical fertilizers.8
The size, structure and shape of its particles inluence its rheological properties, opacity, impression and whiteness. The speciications for its use are based on the method for preparation or industrial puriication, which depends on the speciic physical and chemical characteristics desired.9 The
stages of the industrial processing of the kaolin produce solid wastes mixed with strongly acidic wastewaters (pH < 3) and high concentration of metals, such as Al, Cd, Cr, Fe and Zn.10-11
Ineffective, interrupted or inappropriate treatments for neutralization and reducing of the metals concentration and other toxic components may transport kaolin wastewater into bays, lakes and rivers. In these conditions, the physical and chemical characteristics of the surface waters are abruptly modified with the possibility of immediate damage to aquatic ecosystems, reduction in diversity and the disappearance of species that are more sensitive to such changes.12-16 There is a simultaneous increase in the
concentration of dissolved metals in the water and later in the accumulation of those substances in sediments and aquatic organisms.17-24 These metal compounds can
be absorbed or ingested by aquatic microorganisms and biomagnify along the food chain. In this way to the top of the chain, the accumulation can cause physiological damage to living creatures and pose risks to human health.25-34
In the decade of 1980, the producers of alumina, aluminum ingot, fertilizer and processed kaolin in manufacturing plants in Barcarena City (Pará State, Brazil) were attracted by government incentives, energy availability, easy access to river water and port structure, with the construction of the Port of Vila do Conde on the right bank of the Pará River in the Amazon estuary. In this area, a kaolin processing industry has set up its production nearby Curuperê and Dendê Rivers and wastewater from tailing ponds were discharged into the Curuperê River. This river lows into the Dendê River, a tributary of the
Pará River. After this industrial process was installed, the riverside communities in the region began to report to the environmental and health authorities changes in the water characteristics of the Curuperê and Dendê Rivers, disappearance of aquatic species and occurrence of skin irritations after primary contact with river water.35
In this study, possible environmental impacts on the Curuperê and Dendê Rivers due to discharge of industrial kaolin wastewater were evaluated taking into account physicochemical variables and metal levels of the surface water. In this context, the association between the chemical properties of water on the specific environment and statistical methods, as hierarchical cluster analysis (HCA), principal component analysis (PCA) and correlation analysis, was done. These models can be effectively used to delineate the natural characteristics of the environment and possible geochemical dispersion of pollutants due to industrial wastewater discharges.36-46
Experimental
Study area
The Curuperê River is a small drainage that originates in tailing ponds of kaolin processing plant. Near banks of the Curuperê River are located the communities of Curuperê (01o34’49”S and 48o45’17”W) and Canaã
(01o34’45”S and 48o45’52”W). Its riparian forests are
well preserved and along almost its entire extent, the river is covered over by vegetation. Local inhabitants use the Curuperê River waters as via of transport in small boats, for leisure and subsistence fishing. The Dendê River begins in an environmental preservation area (01o33’54”S
and 48o44’58”W) and its riparian forests have largely
been substituted by other species due to the action of the population that lives along its banks. Since its origins to its mouth at the Pará River, the Dendê River lows in the natural course through the communities of the industrial neighborhood (01o34’09”S and 48o45’25”W), Ilha São
João (01o34’27”S and 48o45’55”W) and Praia do Conde
(01o34’01”S and 48o46’01”W). The tidal conditions in the
Sampling
In order to assess environmental impacts in the Curuperê and Dendê Rivers due to discharge of industrial kaolin wastes, duplicate water samples were collected at a point immediately above the discharge of the efluent from the settling ponds (IR1), next to three sources (NS1, NS2 and NS3) located on the banks of the Curuperê River, nine sampling points on the Curuperê River (C1 to C9) and eight in the Dendê River (D1 to D8). In the Curuperê and Dendê Rivers, the sampling points were collected at high (H) and low (L) tides.
For metal analysis, samples were collected in polypropylene bottles with 1 L capacity and good sealing, all previously washed with 10% HNO3, deionized water,
dried and kept isolated from external contamination until the moment of sampling. After sampling, all samples were stored at 4 oC and immediately sent for analysis.
Analytical methods
For these samples, 14 physicochemical variables were measured: pH, temperature (T), electrical conductivity (EC), total dissolved solids (TDS), salinity (SALT), color (COLOR), total suspended solids (TSS), turbidity (TRB), nitrates (NO3-N), nitrites (NO2-N), ammoniacal nitrogen (NH4-N), phosphate (PO4), sulfates (SO4) and sulide (S). For the same samples, the concentrations of 12 metals were determined: aluminum (Al), barium (Ba), cadmium (Cd), cobalt (Co), chromium (Cr), copper (Cu), iron (Fe), manganese (Mn), nickel (Ni), lead (Pb), vanadium (V) and zinc (Zn).
Levels for pH, T, EC, SALT and TDS were determined using HANNA HI-9828 model multiparameter probes. The electrodes were calibrated moments before sampling with HI-769828-0, HI-769828-1, HI-769828-2 and HI-769828-3 coded standard solution, all from the HANNA brand.
The samples were iltered using HA (ester-cellulose) 0.45 µm Millipore brand membranes. The NO3-N, NO2-N, NH4-N, SO4, PO4 and S levels were determined using DIONEX model ICS2000 ion chromatography. The COLOR, TRB and TSS parameters were quantiied utilizing a model DR-4000 UV-Vis spectrophotometer, from HACH. Concentrations of Al, Ba, Cd, Co, Cr, Cu, Fe, Mn, Ni, Pb, V and Zn metals were determined utilizing an inductively coupled plasma atomic emission spectroscopy (ICP-OES), model Vista-MPX CCD Simultaneous, from VARIAN. For each analysis, 5 mL of iltrate were injected using a VARIAN brand SPS-5 automatic sampler, and control of operating conditions was managed by the ICP-Expert Vista software. The quality control of the methodology was assessed using SRM-1643e certiied water samples and excellent analytical recoveries were obtained for all metallic elements, as seen in the data presented in Table 1.
Statistics treatment
Data analysis
All data are presented as the mean ± standard deviation. Student’s two-sample t-test was employed for statistical analysis of the data. The signiicance level was set at
P < 0.05. MINITAB® release 14 (2003) was used for statistical analysis.47
Table 1. Analytic quality control for metal analysis in sample water (n = 10)
Metal Average / (mg L-1) Range / (mg L-1) aSRM-1643e / (mg L-1) LODb / (mg L-1) Recovery / %
Al 0.139 0.134-0.142 0.142 ± 0.009 0.003 98.025
Ba 0.545 0.538-0.549 0.544 ± 0.006 0.003 100.22
Cd 0.007 0.006-0.007 0.007 ± 0.001 0.001 101.21
Co 0.027 0.025-0.029 0.027 ± 0.000 0.003 99.29
Cr 0.021 0.019-0.022 0.020 ± 0.000 0.002 101.37
Cu 0.023 0.022-0.024 0.023 ± 0.000 0.002 99.21
Fe 0.099 0.098-0.102 0.098 ± 0.001 0.003 101.16
Mn 0.039 0.037-0.040 0.039 ± 0.000 0.002 98.99
Ni 0.062 0.061-0.064 0.062 ± 0.001 0.002 99.74
Pb 0.019 0.018-0.020 0.020 ± 0.000 0.001 98.57
V 0.038 0.037-0.038 0.038 ± 0.001 0.003 100.03
Zn 0.077 76.13-79.76 0.078 ± 0.002 0.002 98.50
Pre-processing of the data
Before applying the multivariate methods to the 38 samples under study, each calculated property (variable) was auto scaled. In the auto scaling method, each variable is scaled to a mean of zero and a variance of unity. This method is very important because each variable is weighted equally and this provides a measure of the ability of a variable to discriminate classes of samples. With this method, we can compare all variables at the same level although each presents different units.48,49
Multivariate methods
Hierarchical cluster analysis (HCA)
The HCA technique examines the distances between the samples in a data set and represents this information as a two-dimensional plot called a dendrogram. The HCA method is an excellent tool for preliminary data analysis. It is useful for examining data sets for expected or unexpected clusters, including the presence of outliers. It is informative to examine the dendrogram in conjunction with PCA as they give similar information in different forms. In HCA, each point forms a single cluster initially and then the similarity matrix is analyzed. The most similar points are grouped forming one cluster and the process is repeated until all the points belong to a unique group.50,51
Principal component analysis (PCA)
PCA is a multivariate statistical technique and the central idea of PCA is to reduce the dimensionality of a data set that presents a large number of interrelated variables, while retaining as much as possible of the variation present in the data set. This is achieved by transforming the original data set to a new set of variables, called the principal components (PC), which are not correlated between themselves, and are ordered so that the irst PC retains most of the variation present in all of the original variables. Three general aspects can be attained when PCA analysis is employed: (i) the original set of variables can be reduced to a smaller set that accounts for most of the variance in the data set, (ii) PCA can search the data for qualitative and quantitative distinctions in situations where the number of data available is quite large and (iii) PCA can be used to test hypotheses about the qualitative and quantitative distinctions in the data set.50,51
Results and Discussion
Evaluation of the Curuperê sources
Table 2 lists the results of the physicochemical parameters and metal levels in the surface waters for three
streams located near the sources in the Curuperê River (NS1, NS2 and NS3). These results proiled water with weak acidity, low levels of salinity, conductivity, turbidity and color, and minimum concentrations for metals and other variables (TDS, TSS, NO3-N, NO2-N, NH4-N, PO4, SO4, S) . Comparing these levels with previous values obtained for other Amazonian rivers and with surface water limits allowed by Brazilian legislation, no anomalous values was observed. Therefore, these results show that the chemical characteristics of water drained into the Curuperê River from these sources were not altered by the discharge of industrial wastewater.52,53
Table 2 also presents the physicochemical results and dissolved metal concentration obtained for the point after discharge of industrial wastewater (IR1) into the Curuperê River. At this point, the levels of acidity (pH 2.6), EC (2195.0 µs cm-1), SALT (1.22 mg L-1), TDS (1091.0 mg L-1),
NH4-N (1740.0 mg L-1), SO4 (1900.0 mg L-1), Al
(2.742 mg L-1), Fe (10.687 mg L-1), Mn (0.343 mg L-1)
and Zn (0.398 mg L-1) were much higher than the ones
recorded from the sources and suggest the ineficiency or absence of physical and chemical treatments of the efluents Table 2. Physicochemical parameters and metal concentration obtained for the water of three sources and point after discharge of industrial wastewaters into the Curuperê River
Parameters NS1 NS2 NS3 IR1
pH 5.30 5.40 6.10 2.60
T / oC 27.80 27.55 28.00 29.80
EC / (µs cm-1) 17.9 15.2 40.3 2195.0
TDS / (mg L-1) 8.8 7.8 20.1 1091.0
SALT / (mg L-1) 0.00 0.00 0.00 1.22
TRB (NTU) 2 2 1 14
TSS / (mg L-1) 2 5 4 18
COLOR / (Pt L-1) 13 1 1 84
NO3-N / (mg L-1) 0.085 0.070 0.055 0.015 NO2-N / (mg L-1) 0.007 0.008 0.006 0.014 NH4-N / (mg L-1) 0.255 0.160 0.100 1.740
PO4 / (mg L-1) 0.175 0.080 0.050 0.220
SO4 / (mg L-1) 4.0 1.0 8.0 1900.0
S / (mg L-1) 0.003 0.002 0.001 0.014
Al / (mg L-1) 0.338 0.225 0.029 2.742
Ba / (mg L-1) 0.015 0.031 0.015 0.064
Cd (mg L-1) 0.004 0.001 0.020 0.001
Co / (mg L-1) 0.001 0.001 0.001 0.001
Cr / (mg L-1) 0.001 0.001 0.001 0.001
Cu / (mg L-1) 0.001 0.001 0.001 0.001
Fe / (mg L-1) 0.341 0.158 0.337 10.687
Mn / (mg L-1) 0.002 0.002 0.002 0.343
Ni / (mg L-1) 0.012 0.001 0.001 0.001
Pb / (mg L-1) 0.025 0.002 0.001 0.001
V / (mg L-1) 0.002 0.002 0.002 0.002
before being transported into the environment. In these conditions, depending on their frequency, discharge volume and capacity for geochemical dispersion of pollutants, those industrial wastewater can alter the chemical characteristics of surface water in the Curuperê River, with harmful effects on the aquatic species that are sensitive to such changes.30,54-57 Another important aspect to be noted is that
this strong acidity and high ion concentration in the waters from IR1 point are chemical conditions that accelerate rock weathering processes with leaching and transporting of metallic ion components of soils in the region. This can contribute towards bioavailability of toxic substances that would otherwise be naturally immobilized in the mineral crystal structure.54,58-62
Assessment of surface waters
The physicochemical parameters and metal levels obtained for all points in the Curuperê and Dendê Rivers are presented in Tables 3 and 4. These data were added to the values found in Table 2 and evaluated by HCA (Figure 1). Additionally, the same data were analyzed using PCA (Figures 2 and 3).
Cluster analysis was applied to the data auto scaled, the normalized Euclidean distance was used to calculate the sample similarities and a hierarchical agglomerative procedure (Ward’s methods) was employed to establish the cluster. The results obtained are shown as a dendogram in Figure 1. In this dendogram, the vertical lines represent the sampling points and the horizontal lines represent the similarities between samples in terms of normalized Euclidian distances which originate from the cluster analysis between samples and a group of samples, and between groups of samples.
Initially, in the dendrogram presented in Figure 1, the clustering formation could be observed in groups 1 and 2 with normalized Euclidean distance of 48.87. This strong separation suggests distinct inluences on the chemical characteristics of each group that requires further details and discuss.
In group 1, there are three clusters. In the irst one (subgroup A), all points in the streams located near the sources of the Curuperê River (NS1, NS2 and NS3) were allocated. The Euclidean distance of only 4.28 between these points suggests a strong homogeneity of these data conirming previous observations presented in the
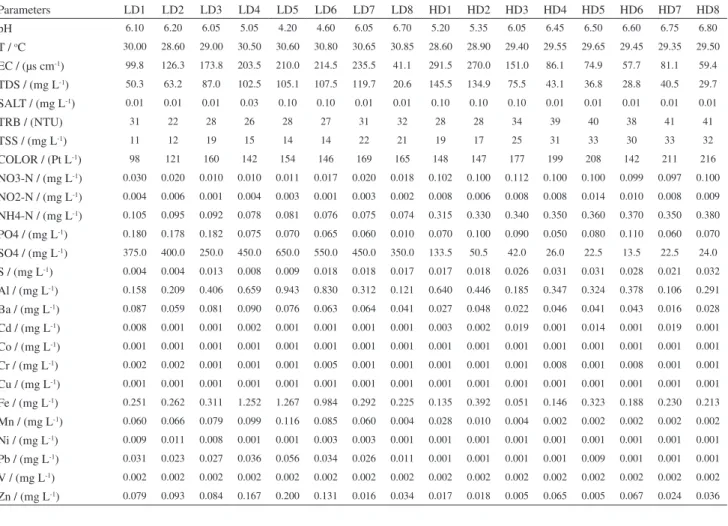
Table 3. Physicochemical parameters and metal concentration obtained for the surface waters of the Curuperê River
Parameters LC1 LC2 LC3 LC4 LC5 LC6 LC7 LC8 LC9 HC1 HC2 HC3 HC4 HC5 HC6 HC7 HC8 HC9
pH 2.80 3.30 3.60 3.60 3.70 3.65 3.70 3.90 4.20 3.70 4.90 6.40 6.45 6.60 6.70 6.90 6.05 6.10 T / oC 25.85 25.85 25.70 25.85 25.85 24.65 26.25 25.90 23.60 29.05 29.00 29.35 29.45 29.45 29.70 29.55 30.00 30.00 EC / (µs cm-1) 1609.5 1412.0 1243.0 1153.0 1033.5 883.5 1000.0 648.0 296.8 1433.0 367.0 129.0 119.0 80.0 86.0 76.0 89.0 74.0 TDS / (mg L-1) 804.0 705.5 621.0 576.0 516.0 441.5 499.5 324.0 198.8 716.0 183.5 64.4 59.7 39.9 42.9 38.0 94.6 87.0 SALT / (mg L-1) 0.80 0.70 0.60 0.60 0.50 0.40 0.50 0.30 0.10 0.70 0.20 0.10 0.10 0.10 0.10 0.10 0.10 0.10
TRB / (NTU) 10 14 9 13 17 20 15 18 31 18 31 30 27 26 27 25 23 29
TSS / (mg L-1) 6 6 9 10 8 11 9 12 20 13 10 14 16 19 18 15 30 18
COLOR / (Pt L-1) 39 43 41 66 73 89 65 87 157 102 161 146 152 154 149 139 203 166
discussion of the sources in Table 2. In the second one (subgroup B), all points in low tide of the Dendê River (LD1 to LD8) were placed with Euclidean distance of 6.4 between them, suggesting a strong homogeneity in the chemical characteristics as recorded for subgroup A. In last cluster (subgroup C), with normalized Euclidean distance of 10.48 between all points, all points in high tide of the Dendê River (HD1 to HD8) and most points in high
tide of the Curuperê River (HC4 to HC9) were allocated. However, the increase of the Euclidean distance between A, B and C (17.05) suggests the existence of some chemical characteristics differentiating these subgroups.
In group 2, there are two clusters. In irst one (subgroup D), with normalized Euclidean distance of 12.03, it was possible to allocate the point in the stream (IR1) where occurs the discharge of industrial wastewater and, in Table 4. Physicochemical parameters and metal concentration obtained for surface waters of the Dendê River
Parameters LD1 LD2 LD3 LD4 LD5 LD6 LD7 LD8 HD1 HD2 HD3 HD4 HD5 HD6 HD7 HD8
pH 6.10 6.20 6.05 5.05 4.20 4.60 6.05 6.70 5.20 5.35 6.05 6.45 6.50 6.60 6.75 6.80
T / oC 30.00 28.60 29.00 30.50 30.60 30.80 30.65 30.85 28.60 28.90 29.40 29.55 29.65 29.45 29.35 29.50 EC / (µs cm-1) 99.8 126.3 173.8 203.5 210.0 214.5 235.5 41.1 291.5 270.0 151.0 86.1 74.9 57.7 81.1 59.4 TDS / (mg L-1) 50.3 63.2 87.0 102.5 105.1 107.5 119.7 20.6 145.5 134.9 75.5 43.1 36.8 28.8 40.5 29.7 SALT / (mg L-1) 0.01 0.01 0.01 0.03 0.10 0.10 0.01 0.01 0.10 0.10 0.10 0.01 0.01 0.01 0.01 0.01
TRB / (NTU) 31 22 28 26 28 27 31 32 28 28 34 39 40 38 41 41
TSS / (mg L-1) 11 12 19 15 14 14 22 21 19 17 25 31 33 30 33 32
COLOR / (Pt L-1) 98 121 160 142 154 146 169 165 148 147 177 199 208 142 211 216
NO3-N / (mg L-1) 0.030 0.020 0.010 0.010 0.011 0.017 0.020 0.018 0.102 0.100 0.112 0.100 0.100 0.099 0.097 0.100 NO2-N / (mg L-1) 0.004 0.006 0.001 0.004 0.003 0.001 0.003 0.002 0.008 0.006 0.008 0.008 0.014 0.010 0.008 0.009 NH4-N / (mg L-1) 0.105 0.095 0.092 0.078 0.081 0.076 0.075 0.074 0.315 0.330 0.340 0.350 0.360 0.370 0.350 0.380 PO4 / (mg L-1) 0.180 0.178 0.182 0.075 0.070 0.065 0.060 0.010 0.070 0.100 0.090 0.050 0.080 0.110 0.060 0.070 SO4 / (mg L-1) 375.0 400.0 250.0 450.0 650.0 550.0 450.0 350.0 133.5 50.5 42.0 26.0 22.5 13.5 22.5 24.0 S / (mg L-1) 0.004 0.004 0.013 0.008 0.009 0.018 0.018 0.017 0.017 0.018 0.026 0.031 0.031 0.028 0.021 0.032 Al / (mg L-1) 0.158 0.209 0.406 0.659 0.943 0.830 0.312 0.121 0.640 0.446 0.185 0.347 0.324 0.378 0.106 0.291 Ba / (mg L-1) 0.087 0.059 0.081 0.090 0.076 0.063 0.064 0.041 0.027 0.048 0.022 0.046 0.041 0.043 0.016 0.028 Cd / (mg L-1) 0.008 0.001 0.001 0.002 0.001 0.001 0.001 0.001 0.003 0.002 0.019 0.001 0.014 0.001 0.019 0.001 Co / (mg L-1) 0.001 0.001 0.001 0.001 0.001 0.001 0.001 0.001 0.001 0.001 0.001 0.001 0.001 0.001 0.001 0.001 Cr / (mg L-1) 0.002 0.002 0.001 0.001 0.001 0.005 0.001 0.001 0.001 0.001 0.001 0.008 0.001 0.008 0.001 0.001 Cu / (mg L-1) 0.001 0.001 0.001 0.001 0.001 0.001 0.001 0.001 0.001 0.001 0.001 0.001 0.001 0.001 0.001 0.001 Fe / (mg L-1) 0.251 0.262 0.311 1.252 1.267 0.984 0.292 0.225 0.135 0.392 0.051 0.146 0.323 0.188 0.230 0.213 Mn / (mg L-1) 0.060 0.066 0.079 0.099 0.116 0.085 0.060 0.004 0.028 0.010 0.004 0.002 0.002 0.002 0.002 0.002 Ni / (mg L-1) 0.009 0.011 0.008 0.001 0.001 0.003 0.003 0.001 0.001 0.001 0.001 0.001 0.001 0.001 0.001 0.001 Pb / (mg L-1) 0.031 0.023 0.027 0.036 0.056 0.034 0.026 0.011 0.001 0.001 0.001 0.001 0.009 0.001 0.001 0.001 V / (mg L-1) 0.002 0.002 0.002 0.002 0.002 0.002 0.002 0.002 0.002 0.002 0.002 0.002 0.002 0.002 0.002 0.002 Zn / (mg L-1) 0.079 0.093 0.084 0.167 0.200 0.131 0.016 0.034 0.017 0.018 0.005 0.065 0.005 0.067 0.024 0.036
Figure 1. Dendrogram of the CA according to Ward’s method showing the clustering formation for the Curuperê and Dendê rivers.
sequence from the IR1 point, the most points in low tide of the Curuperê River (LC1 the LC7). The second one (subgroup E), with normalized Euclidean distance of 10.15, It was allocated the last two points in low tide of the Curuperê River, located farthest from the IR1 point, and the three points in high tide of the Curuperê River, located closer to the IR1 point.
The analysis for the two subgroups (D and E) allocated in group 2 suggests a good correlation between the chemical characteristics of waters in the stream (IR1), where occurs the discharge of wastewater, and waters for all points on the low tide (LC1 to LC9) plus a few points on the high tide (HC1 to HC3) of the Curuperê River. As the waters near the discharge point showed chemical characteristics with anomalous levels in some physicochemical variables and levels of metals, the formation of this group in the dendrogram (Figure 1) indicates that these anomalous levels have also modiied the chemical characteristics on the waters of the Curuperê River. However, the small differences that resulted in the formation of subgroups D and E may be associated with factors such as distance from the discharge point and solvating power in high tide of the Curuperê River. Otherwise, the analysis of the three subgroups (A, B and C) allocated in group 1 suggests the existence of good relationship between the chemical characteristics recorded in the waters of streams (NS1, NS2 and NS3) near the sources of the Curuperê River with the waters in all points in the low (LD1 to LD8) and high tides (HD1 to HD3) of the Dendê River and few points (HC4 to HC9) in the high tide of the Curuperê River. As the waters of streams near the sources showed optimal physicochemical characteristics and low concentrations of metals, the formation of this group in the dendrogram (Figure 1) also indicated that changes in the Curuperê River, associated with the discharge point, could be diluted keeping the chemical characteristics in the Dendê River.
However, the small differences between subgroups A, B and C may be associated with the environmental characteristics at each sampling point. The points in the subgroup A are near to the sources and, despite the small volumes of water, did not received the carrying of suspended materials or substance leached suficient to modify the physicochemical characteristics and metal levels in these waters. For some points in subgroup B, on the low tide of the Dendê River, there is the carrying of suspended materials or leaching of substances from the Curuperê River, these factors are suficient to promote small differences in the chemical characteristics of water in these points. In subgroup C were allocated only points during the high tide of both rivers and, in this condition, the waters of these rivers are mixed by by waters of the Pará River.
This distinction between groups was also observed by PCA. PCA was performed in the auto scaled data. The PCA results show that the irst component (PC1) is responsible for 56.63% of variance in the data (Figure 2). Considering the irst (PC1) and second (PC2) components, the accumulated variance increases to 43.6%. In Figure 2, it is observed that PC1 provides for good separation with the allocation of almost all of the points for group 1 in the irst and third quadrants and almost all for group 2 in the second and fourth quadrants. Complementarily, PC2 (10.6%) allows for separation of subgroups A, B and C identiied in group 1 and D and E that make up group 2.
Those data were crossed through a new loading plot-type PCA as presented in Figure 3. In this graph it was observed that the differentiation of the physicochemical proile in the points allocated to group 1 are strongly associated with levels of seven physicochemical parameters: T, COLOR, TSS, TRB, NO3-N, NO2-N and pH. Nonetheless, in the group 2, the differentiation in their characteristics is strongly associated with the physicochemical parameters and metal concentrations previously cited in the analysis in Table 3 (EC, TDS, SALT, NH4-N, PO4, SO4, Al, Fe, Mn and Zn). However, an influence of Ni and Pb concentrations appears (Figure 3), mainly associated with points LC1 to LC7 at low tide on the Curuperê River. A characteristic in the IR1 point (Table 3) was strong acidity, but not high concentrations of Ni and Pb were recorded. These low levels of Ni and Pb in point IR1 suggest that low concentrations of these metals in the points from LC7 to LC1 may be associated the solubilization of these metals in Curuperê riverbed, probably due to leaching processes of rocks in the aquatic environment due to the carrying acidic water.
Through the PC in Figure 2, it may also be observed that HC1, HC2, HC3, LC8 and LC9 points, all of them Figure 3. Principal component loading plot (PCA) considering both tide
allocated in subgroup E of group 1, are dispersed between the second, third and fourth quadrants, with differentiation strongly inluenced by PC2. This conirms the observations already cited above in the dendrogram (Figure 1), through which it was identiied that those points are located in zones for mixing and dilution of running waters with a reduction in levels of physicochemical parameter and metal concentration that characterize points in group 2.
In Figure 2, it was observed that HC1 point presents chemical characteristics of surface waters similar to those for IR1 point. The observation may be founded on the geographical proximity between those points and the inversion in low during high tide. Together, those are
factors that can lead to higher retention at HC1 point of the industrial waste load discharged at IR1 point during high tide. At the points that make up subgroup D, all of them in the second quadrant in the PC in Figure 2, a detachment was observed in relation to IR1 point in the fourth quadrant. Those observations may also be explained by the condition of the tide. Because LC1 to LC7 points were sampled at low tide of the Curuperê River, the discharge of wastewaters at IR1 point undergoes geochemical dispersion with a gradual dilution process as it approaches the river mouth. In other words, from the waters natural low in the Curuperê river occur the waste transporting to the Dendê river.
Figure 5. Strong Pearson negative correlation between the pH values and four physicochemical variables obtained for Curuperê River.
The levels of Al, Fe, Mn, Ni, Pb and Zn were, for all sampled points of the river at low tide Curuperê (LC1 to LC9), higher than the maximum levels recommended for Class II freshwaters by the Brazilian Environmental Legislation.63 In this Legislation, the freshwaters of
Class II are intended for human consumption, protection of aquatic communities, recreation, irrigation, aquaculture and ishing activity. These altered levels were also recorded in the points near sources during high tide the Curuperê River (HC1 to HC3) and, to a lesser degree, for some points at low tide the Dendê River. The levels of some physicochemical variables in surface waters for the same points that showed abnormal levels of metals were also indicative of environmental impacts, with emphasis on levels of acidity and conductivity about thousand times higher than recommended for Class II freshwaters. These conditions were unfavorable to the protection of aquatic communities and are not recommended for recreation or human consumption.64-66
Figures 2 and 3 highlight the fact that the wastewaters discharged at IR1 point were responsible for changes in the characteristics of Curuperê River waters of almost all points at low tide and some of the points at high tide. For better understanding, those changes speciically in the Curuperê River (Figures 4, 5 and 6) present the correlation matrixes
between the results observed for the physicochemical parameters and the metal concentrations.
Figure 4 highlight a strong positive correlation between pH and levels of T, TRB, TSS, COLOR, NO3-N and NO2-N (it was considered correlated variables as being those that possess correlation coeficients above 0.70). Those results demonstrate that the larger the distance from IR1 point, the more pH increases, with a resulting reduction of acidity and increase in the levels of T, TRB, TSS, COLOR, NO3-N and NO2-N. Otherwise, there was a strong negative correlation between pH, strong acidity, and levels of the variables EC, TDS, SALT and SO4 in surface waters of the Curuperê river (Figure 5).
Figure 6. Bi-dimensional illustration between the pH values and concentration (mg L-1) for four metals levels with good Pearson correlation obtained for Curuperê River.
Conclusions
The industrial wastewater discharged near IR1 point presents characteristics that set them apart from results for the sources of the Curuperê River and suggest that those wastewaters were not treated in an appropriate manner before discharging into the Curuperê riverbed.
The wastewater discharge has drastically modiied the chemical characteristics of the Curuperê River waters. Those environmental impacts represent risks to the health population, which uses those waters for recreation, transportation and their own supply. Other risks may be associated with modiications in the abiotic environment
that may result in the biomagnification of metallic components throughout the food chain affecting people.
These results encourage further discussions on the processes of vertical mining in the Amazon, from which are discharged large volumes of efluents into water bodies. Decision-making are necessary to prevent damage to ecosystems and potential risks for human health caused by environmental exposure to toxic substances.
Acknowledgements
The authors thank the Instituto Evandro Chagas by the unconditional support of research activities.
Supplementary Information
Supplementary information concerning the location map and sampling points in the Curuperê and Dendê Rivers in Barcarena City, Amazon (Pará State, Brazil) is available free of charge at http://jbcs.sbq.org.br as pdf ile.
References
1. Socolow, R. H.; Andrews, C.; Berkhout, F.; Thomas, V.; Industrial Ecology and Global Changes, Cambridge University Press: New York, 1997, pp. 19-22.
2. Ouyang, T.; Zhu, Z.; Kuang, Y.; J. Environ. Monit. 2005, 7, 664. 3. Mastoi, G. M.; Shah, S. G. S.; Khuhawar, M. Y.; Environ. Monit.
Assess. 2008, 141, 287.
4. Sood, A.; Singh, K. D.; Pandey, P.; Sharma, S.; Ecol. Indic. 2008, 8, 709.
5. Wang, J.; Da, L.; Song, K.; Li, B.; Environ. Pollut. 2008, 152, 387. 6. Ma, J.; Ding, Z.; Wei, G.; Zhao, H.; Huang, T.; J. Environ.
Manage. 2009, 90, 1168.
7. MacDonald, D. D.; Clark, M. J. R.; Whitield, P. H.; TrAC, Trends Anal. Chem. 2009, 28, 204.
8. Pandaa, A. K.; Mishra, B. G.; Mishra, D. K.; Singh, R. K.; Colloids Surf., A 2010, 363, 98.
9. Golachowski, A.; Kislenko, V.; Drozdz, W.; Carbohydr. Polym. 2005, 61, 355.
10. Silva, A. C.; Vidal, M.; Pereira, M. G.; Rem: Rev. Esc. Minas 2001, 54, 133; (online at http://www.scielo.br).
11. Jordão, C. P.; Pereira, M. G.; A. T. Matos; Pereira, J. L.; J. Braz. Chem. Soc. 2005, 16, 241.
12. Tipping, E.; Bass, J. A. B.; Hardie, D.; Haworth, E. Y.; Hurley, M. A.; Wills, G.; Environ. Pollut.2002, 116, 137. 13. Koukal, B.; Dominik, J.; Vignati, D.; Arpagaus, P.; Santiago,
S.; Ouddane, B.; Benaabidate, L.; Environ. Pollut. 2004, 131, 163.
14. Cullaj, A.; Hasko, A.; Miho, A.; Schanz, F.; Brandl, H.; Bachofen, R.; Environ. Int. 2005, 31, 133.
15. Sasaki, A.; Ito, A.; Aizawa, J.; Umita, T.; Water Res. 2005, 39, 2517.
16. Araujo, H. M. P.; Nascimento-Vieira, D. A.; Neumann-Leitão, S.; Schwamborn, R.; Lucas, A. P. O.; Alves, J. P. H.; Braz. J. Biol. 2008, 68, 751.
17. Bu-Olayan, A. H.; Al-Hassan, R.; Thomas, B. V.; Subrahmanyam, M. N. V.; Environ. Int. 2001, 26, 199.
18. Sin, S. N.; Chua, H.; Lo, W.; Ng, L. M.; Environ. Int. 2001, 26, 297.
19. Camargo, J. A.; Alonso, A.; Environ. Int. 2006, 32, 831. 20. Coynel, A.; Schäfer, J.; Dabrin, A.; Girardot, N.; Blanc, G.;
Water Res. 2007, 41, 3420.
21. Kelderman, P.; Osman, A. A.; Water Res. 2007, 41, 4251. 22. Nieto, J. M.; Sarmiento, A. M.; Olías, M.; Canovas, C. R.; Riba,
I.; Kalman, J.; Delvalls, T.A.; Envirnon. Int. 2007, 33, 445. 23. Suthar, S.; Nema, A. K.; Chabukdhara, M.; Gupta, S.K.;
J. Hazard. Mater. 2009, 171, 1088.
24. Ricciardi, F.; Matozzo, V.; Binelli, A.; Marin, M. G.; Water Res. 2010, 44, 1725.
25. Bervoets, L.; Knaepkens, G.; Eens, M.; Blust, R.; Environ. Pollut. 2005, 138, 338.
26. Radwell, A. J.; Kwak, T. J.; Environ. Manage. 2005, 35, 799. 27. Clemens, S.; Biochimie 2006, 88, 1707.
28. Dehn, L.-A.; Follmann, E. H.; Thomas, D. L.; Shefield, G. G.; Rosa, C.; Duffy, L. K.; O’Hara, T. M.; Sci. Total Environ. 2006, 362, 103.
29. Karouna-Renier, N. K.; Snyder, R. A.; Allison, J. G.; Wagner, M. G.; Rao, K. R.; Environ. Pollut. 2007, 145, 474.
30. Klaassen, C. D.; Casarett and Doull´s Toxicology: the Basic Science of Poisons, McGraw-Hill Companies: New York, 2007, p. 931.
31. Arain, M. B.; Kazi, T. G.; Jamali, M. K.; Jalbani, N.; Afridi, H. I.; Shah, A.; Chemosphere 2008, 70, 1845.
32. Wang, W.-X.; Rainbow, P.S.; Comp. Biochem. Physiol., Part C: Toxicol. Pharmacol. 2008, 148, 315.
33. Yi, Y.; Wang, Z.; Zhang, K.; Yu, G.; Duan, X.; Int. J. Sediment Res. 2008, 23, 338.
34. Polteva, A.V.; Latkovskaya, E. M.; Leonov, A. V.; Water Res. 2009, 36, 89.
35. Carneiro, B. S.; Vale, E. R.; Lima, M. O.; Relatório IEC-SEMAM 005/2007, http://iah2lab.iec.pa.gov.br/cgi-bin/wxis. exe/iah accessed in May 2009.
36. Singh, K.P.; Malik, A.; Mohan, D.; Sinha, S.; Water Res. 2004, 38, 3980.
37. Pérez, G.; Valiente, M.; J. Environ. Monit. 2005, 7, 29. 38. Ouyang, Y.; Water Res. 2005, 39, 2621.
39. Schmitt, C. J.; Hinck, J. E.; Blazer, V. S.; Denslow, N. D.; Dethloff, G. M.; Bartish, T. M.; Coyle, J. J.; Tillitt, D. E.; Sci. Total Environ. 2005, 350, 161.
40. Sodré, F. F.; Anjos, V. E.; Prestes, E. C.; Grassi, M. T.; J. Environ. Monit. 2005, 7, 581.
42. Ragno, G.; De Luca, M.; Ioele, G.; Microchem. J. 2007, 87, 119.
43. Zhou, F.; Liu, Y.; Guo, H.; Environ. Monit. Assess. 2007, 132, 1.
44. Varol, M.; Sen, B.; Environ. Monit. Assess. 2008, 159, 543. 45. Huang, F.; Wang, X.; Lou, L.; Zhou, Z.; Wu, J.; Water Res.
2010, 44, 1562.
46. Razmkhah, H.; Abrishamchi, A.; Torkian, A.; J. Environ. Manage. 2010, 91, 852.
47. MINITAB 14. MINITAB Statistical Software, Release 14 for Windows, State College, Pennsylvania, 2003.
48. Einax, J. W.; Zwanziger, H. W.; Geiss, S.; Chemometrics in Environmental Analysis, VCH Publishing: Weinheim, 1997, ch. 3.
49. Moreda-Piñeiro, A.; Marcos, A.; Fisher, A.; Hill, S. J.; J. Environ. Monit. 2001, 3, 352.
50. Kowalski, B. R.; Bender, C. F., J. Am. Chem. Soc. 1972, 94, 5632.
51. Sharaf, M. A.; Illman, D. L.; Kowalski, B. R.; Chemometrics, 1st ed., Wiley: New York, 1986.
52. Küchler, I. L.; Miekeley, N.; Forsberg, B. R.; J. Braz. Chem. Soc. 2000, 11, 286.
53. Horbe, A. M. C.; Santos, A. G. S.; J. Braz. Chem. Soc. 2009, 20, 1119.
54. Harrison, R. M.; Pollution: Causes, Effects and Control, Royal Society of Chemistry: Cambridge (UK), 2001, ch. 4. 55. Van Damme, P. A. V.; Hamel, C.; Ayala, A.; Bervoets, L.;
Environ. Pollut. 2008, 156, 1061.
56. Valente, T. M.; Gomes, C. L.; Sci. Total Environ. 2009, 407, 1135.
57. Oberholster, P. J.; Myburgh, J. G.; Ashton, P. J.; Botha, A. M.; Ecotoxicol. Environ. Saf. 2010, 73, 326.
58. McClain, M. E.; Victoria, R. L.; Richey, J. E.; The Biogeochemistry of the Amazon Basin, Oxford University Press: New York (USA), 2001, 185.
59. Miretzky, P.; Bisinoti, M. C.; Jardim, W. F.; Rocha, J. C.; Quim. Nova 2005, 28, 438.
60. Nordmyr, L.; Astrom, M.; Peltola, P.; Estuar. Coast Shelf Sci. 2008, 76, 141.
61. Cabon, J. Y.; Giamarchi, P.; Le Floch, S.; Mar. Pollut. Bull. 2010, 60, 998.
62. Huang, X.; Sillanpää, M.; Gjessing, E. T.; Peräniemi, S.; Vogt, R. D.; Sci. Total Environ. 2010, 408, 4177.
63. Conselho Nacional do Meio Ambiente (CONAMA), Resolução 357/05: dispõe sobre a classiicação dos corpos de água e diretrizes ambientais para o seu enquadramento, bem como estabelece as condições e padrões de lançamentos de eluentes, e dá outras providências, Diário Oicial da União, Brasília, Brasil, 2005 (http://www.mma.gov.br/port/conama).
64. Brodeur, J.C.; Okland, F.; Finstad, B.; Dixon, D.G.; McKinley, R.S.; Ecotoxicol. Environ. Saf. 2001, 49, 226.
65. Bjerknes, V.; Fyllingen, I.; Holtet, L.; Teien, H.C.; Rosseland, B.O.; Kroglunda, F.; Mar. Chem. 2003, 83, 169.
66. Kroglund, F.; Finstad, B.; Stefansson, S.O.; Nilsen, T.O.; Kristensen, T.; Rosseland, B.O.; Teien, H.C.; Salbu, B.; Aquaculture 2007, 273, 360.
Submitted: November 1, 2010
Supplementary Information
S
I
J. Braz. Chem. Soc., Vol. 22, No. 8, S1, 2011. Printed in Brazil - ©2011 Sociedade Brasileira de Química 0103 - 5053 $6.00+0.00
*e-mail: marcelolima@iec.pa.gov.br
Assessment of Surface Water in Two Amazonian Rivers Impacted by
Industrial Wastewater, Barcarena City, Pará State (Brazil)
Marcelo de O. Lima,*,a,b Elisabeth C. O. Santos,a Iracina M. de Jesus,a
Adaelson C. Medeiros,a Kelson do C. F. Faiala and Cláudio N. Alvesb
aSeção de Meio Ambiente, Instituto Evandro Chagas, Rod. BR-316, km 7 s/n, Levilândia, 67030-000 Ananindeua-PA, Brazil
bPrograma de Pós-Graduação em Química, Universidade Federal do Pará, Rua Augusto Corre s/n,
Campus Básico, Guamá, 66000-000 Belém-PA, Brazil