Prediction of Gas Chromatographic Retention Indices of Coumarins
Míriam de Freitas Soares
a, Franco Delle Monache
b,
Vilma Edite Fonseca Heinzen
a*, and Rosendo A. Yunes
baLaboratório de Estrutura-Atividade, Departamento de Química, CFM,
Universidade Federal de Santa Catarina, 88040-900 Florianópolis - SC, Brazil
bInstituto di Chimica Recettori Molecole Biologicamente Attive del C.N.R.,
Università Cattolica S. Cuore, Largo F. Vito 1,00168 Rome, Italy
O estudo de correlação entre estrutura-retenção (QSRR) foi usado para relacionar a retenção cromatográfica de diferentes cumarinas substituídas as suas características estruturais.
Diferentes parâmetros estruturais foram selecionados tais como: descritores topológicos, geométricos, eletrônicos, químico-quânticos e físico-químicos para encontrar uma equação que melhor explique o comportamento cromatográfico destes compostos.
O método proposto por Dimov que classifica os descritores em diferentes grupos de acordo com seus valores de coeficientes de correlação foi utilizado neste estudo.
As melhores equações de correlação linear múltipla foram obtidas com os seguintes descritores: área total (AT), índice do estado eletrotopológico (S-O-) e orbital molecular ocupado de maior energia (EHOMO), mostrando que a retenção experimental, usando fase estacionária de baixa polaridade está relacionada principalmente com fatores relacionados a forma e também eletrônicos.
Os modelos selecionados apresentaram uma boa predictabilidade, a qual foi estabelecida através dos valores do coeficiente de correlação de validação cruzada (r2cv). As equações encontradas podem ser utilizadas para auxiliar na elucidação da estrutura ou retenção cromatográfica de cumarinas similares às estudadas.
Quantitative structure-retention relationships (QSRR) were used in this study to relate the chromatographic retention of different substituted coumarins to molecular structure. Different structural parameters were selected, such as topological, geometric, electronic, quantum-chemical and physico-chemical descriptors, in order to find an equation that fitted the chromatographic retention of these compounds.
The method proposed by Dimov that classifies the descriptors in different groups in agreement with their values of correlation coefficients was analysed.
Significant correlation equations were obtained with the following molecular descriptors: the total surface area (AT), the electrotopological state index (S(-o-)) of the oxygen in position 1 of coumarin, and the highest occupied molecular orbital energy (EHOMO), showing that the experimen-tal retention, using stationary phases with low polarity, was related with the shape and electronic factors of the solutes.
The models found have a good predictive ability as established by cross-validation r2cv values and thus, can be used to aid in the elucidation of the structure or the chromatographic retention of similar coumarins.
Keywords:QSRR, retention indices, coumarins, molecular descriptors, multiple linear regression
Introduction
The quantitative structure-retention relationships (QSRR)1, establishes the relationship between a chemical structure and its chromatographic retention value. The
chromatographic retention is due to the integral effect of molecular interactions between the analyte and both mobile and stationary phase molecules. To define the structural descriptors best related to the characteristic of a particular
Article
solute to undergo both polar and dispersive interactions is an important step to understanding the process of chroma-tographic separation.
Using the QSRR approach, structural descriptors such as topological, geometric and electronic or physico-chemi-cal descriptors can be proposed for molecules with similar structural features, and a subset of them can be selected in order to describe and predict the gas chromatographic retention indices2. Numerous authors have attempted to correlate and predict retention indices of a variety of com-pounds by use of molecular structural information or physico-chemical and quantum-chemical parameters3-20.
In this study, our aim was to select the best descriptors related to the chromatographic retention of different sub-stituted coumarins (some of them are interesting natural products) using the QSRR, to broaden the approach of Dimov et al.3,4 which takes into account only hydrocarbons (alkylbenzenes, alkylnaphthalenes, isoalkanes and alke-nes).
Dimov et al.3,4 suggested that the descriptors should be divided in groups according to correlation coefficient val-ues for the simple linear regression. After this, the descrip-tors of different groups would be related through multiple regression to obtain the best equations. These equations
would be formed by two groups of descriptors: basic and tuning. The basic descriptors are those that permit the calculation of the retention index values closest to the experimental values. The tuning descriptors are those that further tune the calculated value to experimental ones.
Experimental
Samples and standards
The different coumarins studied were obtained by ex-traction in the Instituto di Chimica Recettori Molecole Biologicamente Attive del C.N.R., Università Cattolica S. Cuore. The 6-methylcoumarin, 7-methylcoumarin, 4-hy-droxycoumarin, coumarin and 3,4-dihydrocoumarin were obtained commercially from the Aldrich Chemical Com-pany Inc. The analytical standards of hydrocarbons (n-al-canes, nC12 to nC22) were supplied by Aldrich Chemical
Company Inc.
Method of chromatographic analysis
The gas chromatographic retention data for 20 substi-tuted coumarins chromatographed on two stationary phases with low polarities are indicated in Table 1. The sample solutions were prepared with acetone, and to some of them
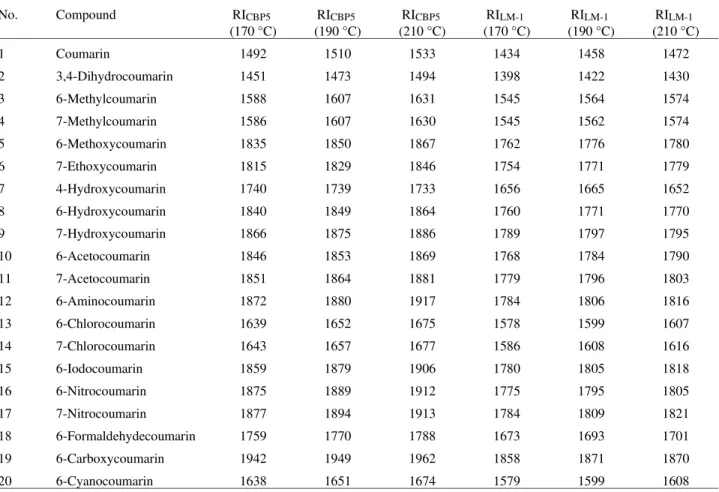
Table 1. Experimental retention indices on the CBP5 (RICBP5) and LM-1 (RILM-1) stationary phases at 170 °C, 190 °C and 210 °C for the coumarin series.
No. Compound RICBP5
(170 °C)
RICBP5
(190 °C)
RICBP5
(210 °C)
RILM-1
(170 °C)
RILM-1
(190 °C)
RILM-1
(210 °C)
1 Coumarin 1492 1510 1533 1434 1458 1472
2 3,4-Dihydrocoumarin 1451 1473 1494 1398 1422 1430
3 6-Methylcoumarin 1588 1607 1631 1545 1564 1574
4 7-Methylcoumarin 1586 1607 1630 1545 1562 1574
5 6-Methoxycoumarin 1835 1850 1867 1762 1776 1780
6 7-Ethoxycoumarin 1815 1829 1846 1754 1771 1779
7 4-Hydroxycoumarin 1740 1739 1733 1656 1665 1652
8 6-Hydroxycoumarin 1840 1849 1864 1760 1771 1770
9 7-Hydroxycoumarin 1866 1875 1886 1789 1797 1795
10 6-Acetocoumarin 1846 1853 1869 1768 1784 1790
11 7-Acetocoumarin 1851 1864 1881 1779 1796 1803
12 6-Aminocoumarin 1872 1880 1917 1784 1806 1816
13 6-Chlorocoumarin 1639 1652 1675 1578 1599 1607
14 7-Chlorocoumarin 1643 1657 1677 1586 1608 1616
15 6-Iodocoumarin 1859 1879 1906 1780 1805 1818
16 6-Nitrocoumarin 1875 1889 1912 1775 1795 1805
17 7-Nitrocoumarin 1877 1894 1913 1784 1809 1821
18 6-Formaldehydecoumarin 1759 1770 1788 1673 1693 1701
19 6-Carboxycoumarin 1942 1949 1962 1858 1871 1870
methanol was added. Samples of 1 µL were injected into a gas chromatograph Shimadzu (Model GC-14A) equipped with a flame ionisation detector, connected to a recorder (Shimadzu Model C-R6A). The carrier gas was hydrogen at a flow-rate of 2.0 mL min-1 in all instances. Two fused silica capillary columns of LM 1 no. 360696 (L&M São
Carlos, SP, Brazil) a polydimethylsiloxane liquid phase with 0.25 mm i.d. and of CBP5 PN 221-28636-25 (Shi-madzu Co., Kyoto, Japan) a polydimethylphenylsiloxane 5% phenyl, bonded liquid phase with 0.22 mm i.d. were utilised. Both the columns were 25 m long and with 0.25
µm film thickness. The injector and detector temperatures were 250 °C and 280 °C, respectively. The retention times were measured at different isothermal column tempera-tures: 170 °C, 190 °C, 210 °C, 220 °C and 230 °C. The experimental retention time (tR) was obtained using the
average of three experimental determinations. The standard deviations are less than 0.01%.
The dead time (tM) was determined by the Method of
Sharles and Vermon21. The measurements were always taken before each determination of the retention time.
The Kovàts retention indices were determined through the adjusted retention times (tR - tM), according to the
equation of Kovàts22, using n-alcanes as standards.
Method of calculation of molecular descriptors
The structural descriptors used in the present study were topological and quantum-chemical indices and physico-chemical properties.
Several extensive reviews have been published which give detailed descriptions of the theory and method of calculation of all topological indices used in the present investigation23-28.
The Wiener indices (W)23, the molecular connectivity
indices of different orders (1X, 2X, 3X
p, 4Xp, 5Xp, 3Xc, 4X
pc,1Xv, 2Xv, 3Xvp, 4Xvp, 5Xvp, 3Xvc and 4Xvpc)24, indices
of molecular shape, kappa values (1K, 2K, 3K)25, indices of
electrotopological state (Si)26,27 and topological state
indi-ces (Ti)28, were calculated by the method of Kier and Hall,
utilizing the Molconn-X computer program for molecular topological analysis29.
The topological state index Ti, of an atom, gives
infor-mation on the topological environment of the atom accord-ing to the presence of the other atoms in the molecule. The values of Ti = T(=O), are related to the oxygen of the
carbonyl in the basic structure of coumarins. T(-O-) indices
are related to the oxygen of position 1 in the coumarin. They distinguish also all the compounds studied (see Table 2).
The electrotopological state index (Si) gives
informa-tion about the electronic and topological state of an atom according to the presence of other atoms in the molecule. It was considered that S(-O-), related to the oxygen of
position 1 in the coumarin molecule, distinguished all the compounds studied (Table 2).
The molecules were drawn using the PcModel version 3.01 computer program, and the figures were exported to be geometrically energy-minimised using the PM3 quan-tum mechanical method. Subsequently, the energy-opti-mised molecular structure was used for generating a number of molecule parameters utilising the semi-empiri-cal molecular orbital Mopac program30.
The following quantum mechanical molecular proper-ties were chosen for the study: the highest occupied mo-lecular orbital energy (EHOMO), and the lowest unoccupied
molecular orbital energy (ELUMO). Other derived properties
obtained were: the total surface area (AT), saturated area
(AS), unsaturated area (AUNS), polar area (AP), molecular
volume (VMOLEC), molar volume (VMOLAR), total energy
(ET), molar refractivity (RM). In addition, the following
physical properties of the coumarins were also selected: molecular mass (MM) and boiling point (Tb). Some of the
values are given in Table 2.
The best regression equations were selected on the basis of the multiple correlation coefficient (r), r-squared, stand-ard deviation (SD), the overall F value and the F-remove for individual descriptors (F-to-remove: 4.00) in the step-wise selection. Finally, in order to estimate the predictive power of the model, cross-validation, following the leave-one-out scheme was performed32,33. The reliability of the model was tested in a cross-validation with determination of r2cv32.
All the calculations of single and multiple linear regres-sion analyses were carried out using the Statgraf and Origin
computer programs.
Results and Discussion
The basic structure of mono-substituted coumarins with the corresponding substituents studied are given below:
The values of the chromatographic retention indices (RI) of different coumarins studied, using the stationary phases LM-1 (RILM-1) and CBP5 (RICBP5) at different
iso-thermal temperatures of columns 170-210 °C, are given in Table 1. O R4 R7 R6 O
R4 = -OH; R7 = R6 = H
The retention times were determined at three different temperatures within the linear range of the curve. The correlation coefficients of these curves are in the range of 0.9992 - 0.9998 in CBP5 and 0.9962 - 0.9991 in LM-1.
Some molecular descriptors values are given in Table 2.
According to the r values, the molecular descriptors were classified in agreement with the method proposed by Dimov et al.3,4, into four groups depending on their indi-vidual significance for the retention studied. These groups are identified as follows: substantial, important, likely and specific.
In the present study, none of the available descriptors were enclosed in the group of the substantial and important ones, that is no r was obtained above 0.80. This classifica-tion is also shown in Table 3.
In the multiple linear regression, the contributors to the retention in agreement with the method proposed by Dimov
et al.3,4 were divided into two groups, basic and tuning:
RIcalc =b0+
∑
i= 1
n
bi Bi +
∑
j=n+ 1n+k
bj Tj (1)
where RIcalc represents the calculated retention. The Bi
parameters include those solute descriptors which allow the calculation of the RIcalc value closest to the experimental retention (RIexp). The parameters Tjare solute descriptors, which tune the RIcalc value to that of RIexp. Owing to the
restriction of statistically-permitted intercorrelations, there is normally only one basic descriptor to be used. The problem is choice which basic descriptor forms the best combination with tuning contributor(s).
Different combinations of the variables representing each of two terms described above were tried to obtain the equation of best fit, which would relate the RI values of the reference compounds to their molecular structure. Multiple linear equations with two variables produced correlation coefficients with low values (the best was r = 0,8498 with AT and S(-o-) in LM-1).
The series of compounds studied can be described by an equation comprising three types of terms: the size of the
Table 2. Molecular connectivity indices of 1st and 2nd orders (1X, 2X), Wiener indices (W), Kappa index (1K), topological state indices (Ti), electrotopological state indices (Si) for the oxygen of position-1 (S(-O-), T(-O-)) and for the oxygen of carbonyl in the lactone group (S(=O), T(=O)). Total surface area (AT), Polar area (AP), Molecular volume (VMolec), Total energy (ET), Energy of the highest occupied molecular orbital (EHOMO), for the coumarin series.
No 1X 2X AT
(A2) AP
(A2)
VMOLEC
(A3) ET
(eV)
EHOMO
(eV)
W 1K S(-O-) S(=O) T(-o-) T(=O)
1 5.3602 4.7228 154.66 32.443 172 -1745.2 -9.4875 643 7.6389 4.9060 10.717 13.137 10.973
2 5.3602 4.7228 161.58 32.304 182 -1776.9 -9.5136 643 7.6389 4.9929 10.803 12.884 10.748
3 5.7540 5.3566 174.06 32.198 194 -1895.0 -9.3281 776 8.5917 4.9611 10.802 13.403 11.192
4 5.7540 5.3566 174.67 32.149 193 -1895.0 -9.3530 761 8.5917 4.9869 10.828 13.375 11.196
5 6.2920 5.2557 186.54 41.123 203 -2188.2 -9.1229 880 9.5510 4.9500 10.840 13.618 11.620
6 6.7920 5.9061 205.98 38.642 226 -2337.6 -9.1716 949 10.516 5.0131 10.945 13.680 11.548
7 5.7709 5.2623 163.44 50.456 177 -2039.2 -9.5160 761 8.5917 4.8269 10.778 13.577 11.340
8 5.7540 5.3566 165.87 51.494 178 -2039.1 -9.1628 776 8.5917 4.8500 10.739 13.468 11.234
9 5.7540 5.3566 165.46 50.922 176 -2039.2 -9.2253 761 8.5917 4.8269 10.746 13.439 11.239
10 6.6647 6.2555 197.59 55.256 219 -2306.9 -9.6973 986 10.516 4.9295 10.869 13.764 11.693
11 6.6647 6.2555 200.28 55.581 218 -2306.9 -9.6556 985 10.516 4.9447 10.913 13.756 11.706
12 5.7540 5.3566 170.38 59.030 184 -1923.2 -8.7628 776 8.5917 4.9055 10.770 13.446 11.220
13 5.7540 5.3566 177.54 61.099 197 -2157.3 -9.7346 776 8.5917 4.9024 10.769 13.395 13.395
14 5.7540 5.3566 171.71 32.174 188 -2046.6 -9.4254 761 8.5917 4.9024 10.785 13.367 11.190
15 5.7540 5.3566 183.94 32.223 206 -2018.4 -9.1559 776 8.5917 4.9577 10.800 13.346 11.154
16 6.6647 6.2555 180.89 69.597 201 -2476.6 -10.233 986 10.516 4.8182 10.802 13.824 11.621
17 6.6647 6.2555 181.20 69.924 200 -2476.6 -10.189 985 10.516 4.7924 10.828 13.823 11.631
18 6.2920 5.5257 171.48 32.161 190 -2046.6 -9.3665 880 9.5510 4.8896 10.802 13.611 11.403
19 6.6647 6.2555 186.52 76.236 201 -2451.6 -9.8071 986 10.516 4.8479 10.819 13.799 13.799
molecule, and the topological and electronic factors. The best equations were obtained with AT, 1K, W, 3Xp and VM
as the first term of the equation (basic descriptors), reflect-ing the bulk properties of the molecule. These basic de-scriptors have high colinearity to each other. However, only one of them was used in each equation. The second and third terms (tuning descriptors) were represented by S(-o-)
related with the topological and electronic factors and EHOMO related with the ionisation potential of the molecule.
The colinearities between them were also checked. The best multiple linear regression Eqs. 2 - 3 with three variables with LM-1 and CBP5 stationary phases (170 °C) were:
ILM-1(170 °C) = 9.474 (±0.815)AT + 220.2
(±32.2)EHOMO- 2013 (±192)S(-O-) + 11957 (±1081) (2) n = 20 r = 0.9561 s = 41.90
F-ratio = 56.74 r2
cv = 0.8573
(F-to-remove: 4.00) F(AT ) = 135.1 F(EHOMO) = 46.79 F(S(-O-)) = 109.4
ICBP5(170 °C) = 10.07 (±0.95)AT + 233.8 (±37.3)EHOMO
-2271 (±223)S(-O-) + 13319 (±1254) (3) n = 20 r = 0.9507 s = 48.61
F-ratio = 50.16 r2cv = 0.8265
(F-to-remove: 4.00) F(AT) =113.3 F(EHOMO) = 39.22 F(S(-O-)) = 103.5
The best simple regressions were obtained with descrip-tors related to the shape, size, area, volume and molecular refractivity of the substance studied. In the multiple linear regression the electronic descriptors were introduced.
The total area was the first parameters introduced into the multiple linear equations as it was found to be the most significant (see the values of F, Eqs. 2-3). The positive sign of the coefficient in the Eqs. 2-3 indicates that retention indices increase with the total area values as is observed in Table 2. The second parameter introduced in the equations (the second most significant according to the values for F, Eqs. 2 and 3) was the electrotopological index (Si) related to the oxygen atom in the position 1 of the coumarins. The nature of the substituents in the molecule influences this index. Substituents with electron-donating effect contrib-ute to increase the value of the index and those with electron-withdrawing effect decrease it. The negative sign of the coefficient in Eqs. 2 and 3 indicates that retention indices increase as the electrotopologic indices (S-o-) in the
molecule decrease. In agreement with the experimental retention indices, it can be observed that in a general way, compounds with more electronegative substituents have larger retention values.
The third parameter introduced in the multiple regres-sion equations according to its significance (see the values of F in the Eqs. 2 and 3) was the energy of the highest occupied molecular orbital of the solute, EHOMO. The intro-Table 3. Individual correlation coefficients, r, between coumarin
reten-tion indices obtained using two stareten-tionary phases with low polarities at 170 °C and corresponding descriptors.
Descriptors Abbreviation Stationary Phase
LM-1 CBP5
Group of likely parameters
(0.80 > r > 0.45)
Wiener W 0.7327 0.7361
Kappa index 1K 0.7087 0.7097
Molecular connectivity index
2X 0.7166 0.7174
3
Xp 0.7061 0.7115 5X
p 0.7561 0.7606
Polar Area AP 0.7119 0.7342
Total Energy ET -0.7487 -0.7498
Topological state index
T(-O-) 0.7948 0.7945
T(C2) 0.7618 0.7644
T(C6) 0.7568 0.7717
T(=O) 0.7006 0.7003
Molecular connectivity index
1X 0.6873 0.6885
Kappa index 2K 0.6199 0.6201
3K 0.6797 0.6776
Molecular connectivity index
4X
p 0.6912 0.6857 4
X pc 0.6928 0.6971 3
Xc 0.7061 0.7115 6X
p 0.6873 0.6865
Total Area AT 0.5806 0.5614
Molar Refractivity MR 0.5578
Volume Molecular VM 0.4629 0.4500
Volume Molar VMolar 0.4521 0.4188
Group of specific parameters
(r < 0.45)
Electrotopological state index
S(-O-) -0.4081 -0.4362
S(=O) 0.3187 0.2940
Molecular connectivity index
1Xv 0.4033 0.3840
4X
pcv 0.3659 0.3553 3X
pv 0.3178 0.3046 2
Xv 0.3169 0.3069
3
Xcv 0.2258 0.2183 4X
pv 0.2018 0.1866 5X
pv 0.1459 0.1349
Saturated area AS -0.2244 0.3498
Unsaturated area AUNS -0.2220 0.3193
duction of this parameter, that is less significant, resulted in an increase of the multiple correlation coefficients (r). EHOMO is related to the energy necessary to remove an
electron from a molecule. The sign of the coefficient in the Eqs. 2-3 is positive, thus the negative values of EHOMO that
correspond to more electron-donating molecules, contrib-ute to decrease the chromatographic retention. This is, in accordance with the value of S(-o-), thus EHOMO should
correct the values of S(-o-), considering that EHOMO is a
molecule global value and not localised in an atom as S(-o-).
The validation of the model was checked through the values of r2cv (coefficient of validation of the capacity of
prediction of the model) which was better for the Eqs. 2 and 3, where the total area was the most significant parameter. The calculated retention indices with the Eqs. 2 and 3, residuals and standard residuals are given in Table 4.
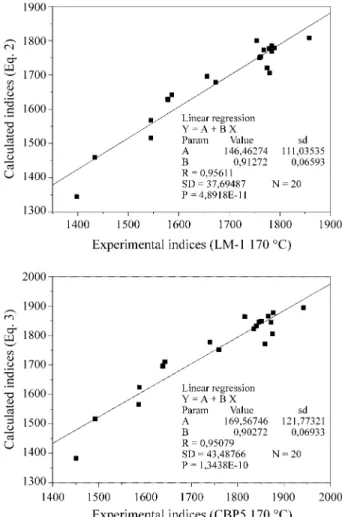
The correlation between experimental retention indices (LM-1 and CBP5) and those calculated by Eqs. 2 and 3 is shown in Fig. 1.
It is observed in Fig. 1 that two points corresponding to compounds 2 and 15 (Table 4) exhibit a significantly large
s. When the correlation is made without these outliers the
correlation coefficient is improved, r = 0.9647 for the ILM-1
and r = 0.9642 for ICBP5.
The interactions between the molecules of the solute and those of the two stationary phases used in this work are similar. These are observed by the simple linear correla-tions obtained between the experimental retention indices (or calculated) of the two stationary phases, whose corre-lation coefficient is excellent.
ICBP5 = 1.094 (±0.040) ) ILM-1 - 86.25 (±69.16) (4)
n = 20 r = 0.9971 s = 11.17 F = 3132.42 r2
cv = 0.9930
The angular coefficient of this Eq. 4 demonstrates that there is not appreciable discrimination between the phases. However, the intercept shows that the values of ICBP5 are
smaller than that of ILM-1. This fact could be explained by
different diffusion rates in the stationary phases or other dynamic factors.
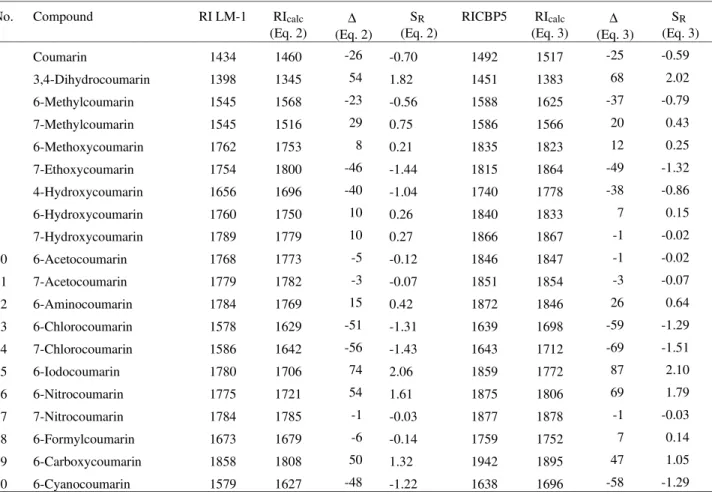
Table 4. Experimental and calculated retention indices (RI and RIcalc) determined on LM-1 and CBP5 stationary phases at 170 °C and its residual, ∆ (RI – RIcalc.) and standardized residual, SR, of Eqs. 2 and 3 for the coumarins used in this study.
No. Compound RI LM-1 RIcalc
(Eq. 2)
∆ (Eq. 2)
SR
(Eq. 2)
RICBP5 RIcalc
(Eq. 3)
∆ (Eq. 3)
SR
(Eq. 3)
1 Coumarin 1434 1460 -26 -0.70 1492 1517 -25 -0.59
2 3,4-Dihydrocoumarin 1398 1345 54 1.82 1451 1383 68 2.02
3 6-Methylcoumarin 1545 1568 -23 -0.56 1588 1625 -37 -0.79
4 7-Methylcoumarin 1545 1516 29 0.75 1586 1566 20 0.43
5 6-Methoxycoumarin 1762 1753 8 0.21 1835 1823 12 0.25
6 7-Ethoxycoumarin 1754 1800 -46 -1.44 1815 1864 -49 -1.32
7 4-Hydroxycoumarin 1656 1696 -40 -1.04 1740 1778 -38 -0.86
8 6-Hydroxycoumarin 1760 1750 10 0.26 1840 1833 7 0.15
9 7-Hydroxycoumarin 1789 1779 10 0.27 1866 1867 -1 -0.02
10 6-Acetocoumarin 1768 1773 -5 -0.12 1846 1847 -1 -0.02
11 7-Acetocoumarin 1779 1782 -3 -0.07 1851 1854 -3 -0.07
12 6-Aminocoumarin 1784 1769 15 0.42 1872 1846 26 0.64
13 6-Chlorocoumarin 1578 1629 -51 -1.31 1639 1698 -59 -1.29
14 7-Chlorocoumarin 1586 1642 -56 -1.43 1643 1712 -69 -1.51
15 6-Iodocoumarin 1780 1706 74 2.06 1859 1772 87 2.10
16 6-Nitrocoumarin 1775 1721 54 1.61 1875 1806 69 1.79
17 7-Nitrocoumarin 1784 1785 -1 -0.03 1877 1878 -1 -0.03
18 6-Formylcoumarin 1673 1679 -6 -0.14 1759 1752 7 0.14
19 6-Carboxycoumarin 1858 1808 50 1.32 1942 1895 47 1.05
Conclusions
This study demonstrates that the methodology used previously by Dimov to model GC retention characteristics of the hydrocarbons (alkylbenzenes, alkylnaphthalenes, isoalkanes and alkenes) can also be applied to model the retention indices of substituted coumarins, although the correlations were not as good as the first ones.
The descriptors that are able to describe the phenomena that took place in the process of the retention of the studied compounds are related with the shape and the electronic characteristics of the molecules.
The models found have good predictive ability as es-tablished by cross-validation r2cv values and thus can be
used to help in the elucidation of molecular structures or prediction of chromatographic retention indices of similar compounds.
Acknowledgement
The authors thank CNPq (Brazil) for financial support.
References
1. Kaliszan R. Quantitative Structure-chromatographic Retention Relationships; John Wiley & Sons; New York, 1987.
2. Sutter, J.M.; Peterson, T.A.; Jurs, P.C. Anal. Chim. Acta1997, 342, 113.
3. Dimov, N.; Osman, A. Anal. Chim. Acta1996, 323, 15.
4. Dimov, N.; Osman, A.; Mekenyan, Ov.; Papazova, D.
Anal. Chim. Acta1994, 298, 303.
5. Heinzen, V.E.F.; Yunes, R.A. J. Chromatogr. 1992,
598, 243.
6. Heinzen, V.E.F.; Yunes, R.A. J. Chromatogr. 1993,
654, 83.
7. Arruda, A.C.; Heinzen, V.E.F.; Yunes, R.A. J. Chro-matogr. 1993, 630, 251.
8. Heinzen, V.E.F.; Yunes, R.A. J. Chromatogr. A1996,
719, 462.
9. Salabert-Salvador, M.T.; Garcia-March, F.J.;Pérez-Giménez F. et al.Chromatographia1995, 41, 702. 10. Righezza, M.; Hassani, A.; Meklati, B.Y.; Chrétien,
J.R. J. Chromatogr.A1996, 723, 77.
11. Garcia-March, F.J.; Antón-Fos, G.M.; Pérez-Giménez, F.; Salabert-Salvador, M.T.; Cercós-del-Pozo, R.A.; Julian-Ortiz, J.V. J. Chromatogr.A1996,
719, 45.
12. Zhang, X.; Lu, P. J. Chromatogr. A1996, 731, 187. 13. Peng, C.T. J. Chromatogr. A1994, 687, 189. 14. Li, J.; Carr, P.W. J. Chromatogr. A1994, 659, 367. 15. Hilal, S.H.; Carreira, L.A. J. Chromatogr. A 1994,
662, 269.
16. Kalliszan, R. Anal. Chem. 1992, 64, 619A.
17. Mihalic, Z.; Trinajstic, N. J. Chem. Educ. 1992, 69, 701.
18. Kier, L.B. In Physical Chemical Properties of Drugs,
Yalkowsky, S.H.; Sinkula, A.; Valvani, S.C., eds., Marcel Dekker; N. Y., Ch. 9, p. 277, 1980.
19. Hansch, H; Leo, A. Exploring QSAR. Fundamentals and Applications in Chemistry and Biology; Washing-ton, ACS, 1995.
20. Santos, H.F.; Almeida, W.B. J. Molec. Struct. 1995,
335, 129.
21. Sharples, W.E.; Vermon, F. J. Chromatogr. 1978,
161, 83.
22. Tarjan, G.; Nyiredy, Sz.; Gyor, M. et al.J. Chroma-togr. 1989, 472, 1.
23. Wiener, H. J. Am. Chem. Soc.1947, 69, 17 and 2636. 24. Kier, L.B.; Hall, L.H. Molecular Connectivity in Structure-Activity Analysis; Wiley; New York, 1986. 25. Kier, L.B. Quant. Struct.-Act. Relat. 1987, 6, 8. 26. Kier, L.B.; Hall, L.H. Pharm. Res. 1990, 7, 801. 27. Hall, L.H.; Mohney, B.; Kier, L.B. J. Chem. Inf.
Comput. Sci.1991, 31, 76.
28. Hall, L.H.; Kier, L.B. Quant. Strut.-Act. Relat.1990,
9, 115.
29. Hall, L.H.; Kier, L.B. Molconn-X, a Program for Molecular Topology Analysis; User’s Guide. 1. ed. Quincy; Massachusetts, 1991.
30. Stewart, J.J.P. MOPAC, version 6.0, J. Seiler Research Laboratory, US Air Force Academy, Colorado Springs. CO80840-6528, USA,1990.
31. Makovskaya, V.; Dean, J.R.; Tomlinson, W.R.; Com-ber, M. Anal. Chim. Acta1995, 315, 193.
32. Muresan, S.; Bologa, C.; Mracec, M.; Chiriac, A.; Jastorff, B.; Simon, Z.; Naráy-Szabó, G. J. Molec. Struct. 1995, 42, 161.
33. Wagener, M.; Sadowski, J.; Gasteiger, J. J. Am. Chem. Soc. 1995, 117, 7769.