Nasal cavity geometry of
healthy adults assessed using
acoustic rhinometry
Summary
Adriana de Oliveira Camargo Gomes1, Ana Claudia
Martins Sampaio-Teixeira2, Sergio Henrique
Kiemle Trindade3, Inge Elly Kiemle Trindade4
1 MSc at the Graduate Program on Rehabilitation Sciences at Hospital de Reabilitação de Anomalias Craniofaciais (HRAC-USP). PhD student at the Graduate Program
on Rehabilitation Sciences at HRAC-USP, Physiology Laboratory, Bauru-SP.
2 PhD at the Graduate Program on Rehabilitation Sciences at HRAC-USP. Physiologist at the Physiology Laboratory, HRAC-USP, Bauru-SP.
3 Specialist on Otorhinolaryngology, PhD student at the Graduate Program on Otorhinolaryngology at Faculdade de Medicina (FMUSP). MD, otorhinolaryngologist at
Hospital do Servidor Público Estadual-SP, Hospital Estadual de Bauru-SP and Hospital das Clínicas-FMUSP-SP.
4 Full Professor - Department of Biologic Sciences at Faculdade de Bauru-USP and at the Physiology Laboratory at HRAC-USP, Bauru-SP.
Hospital de Reabilitação de Anomalias Craniofaciais Universidade de São Paulo
Send correspondence to: Profa. Dra. Inge Elly Kiemle Trindade - Laboratório de Fisiologia, Hospital de Reabilitação de Anomalias Craniofaciais -USP - Rua Silvio Mar-chione 3-20 Bauru-SP 17012-900.
Tel.: (0xx14) 32358137 - E-mail:[email protected] FAPESP, CNPq.
This paper was submitted to the RBORL-SGP (Publishing Manager System) on 15 June 2007. Code 4612. The article was accepted on 1 September 2007.
A
coustic rhinometry (AR) has been used as a specific test for nasal patency. Aim: this study aimed to set the reference values for nasal cavity cross-section geometry in healthy adults through AR. Study design: this is a clinical prospective study.Materials and method: thirty volunteers (14 males and 16
females) without signs of nasal obstruction and aged between 18 and 30 years were enrolled in this study. They were assessed before and after being treated topically with a nasal vasoconstrictor drug. Their nasal cross-sectional areas were measured at the three dips of the rhinogram, corresponding respectively to the nasal valve (CSA1), the anterior (CSA2), and the posterior (CSA3) region of the inferior and middle turbinate. Results: the mean areas (±SD) for 60 nasal cavities before nasal vasoconstriction were: 0.54±0.13cm2 (CSA1), 0.98±0.31 cm2 (CSA2), and 1.42±0.44cm2 (CSA3). After vasoconstriction, the mean values of the three segments analyzed were significantly larger (p<0.05). Gender was not a statistically significant variable. Conclusion: The nasal cross-sectional areas obtained for adults may be used for control purposes when studying patients with nasal obstruction, in conjunction with the nasal volume values previously reported by our group.
Keywords: nasal cavity, acoustic rhinometry, reference values.
original article Rev Bras Otorrinolaringol
INTRODUCTION
Instrumental methods were developed in the past few decades to objectively check nasal patency and allow for further clinical finding confirmation. The most frequently used technique is rhinomanometry, in which patency is estimated based on nasal airflow resistance, from the simultaneous verification of flow and transnasal pressures generated during breathing at rest. Despite its validity, nasal airflow resistance has its limitations, the most important being it is flow-dependent1,2. In order to
overcome such limitation, Warren3 introduced a
modifi-cation to conventional rhinomanometry to estimate the minimum nasal cross-sectional area, which in terms of airflow resistance measurement offers the advantage of not being flow-dependent. It was shown that in adults over 18 years of age values under 0.40 cm2 are indicative of nasal obstruction1,3.
Nasal cross-sectional area also began to be measu-red by acoustic rhinometry from the study conducted by Hilberg et al.4. The test is based on the measurement of
the reflected sound waves (echo) that emerge from the nasal cavity in response to introduced sound waves. It allows sequential measurements of nasal cavity segments, from the nostrils to the choanae, thus facilitating the on-site identification of constrictions that contribute to nasal airflow resistance. Volumes for various regions in the nose can be assessed, enabling the analysis of the topographic profiles of each nasal airway4-8. This test represents a
step forward in relation to rhinomanometry as proposed by Warren3, once it allows the assessment of only the
narrowest cross-section segment, usually the nasal valve, although it required more cooperation from the patient.
Today acoustic rhinometry is broadly recognized as a specific test for nasal patency. Normal cross-sectional area values have been reported by many authors9-25, whose
findings are summarized on Chart 1. Nonetheless, due to factors such as ethnic, weather, and laboratory-related differences, local reference values must be determined, as stressed by Hilberg and Pedersen7 and Roithman26 more
recently.
Therefore, in the study conducted in our labora-tory, we first defined the volumes of three areas in the nasal cavity (valve, concha, and nasopharynx) of adults without evidences of nasal obstruction27. This paper aims
to present values for nasal cross-sectional areas of three segments - nasal valve, anterior and posterior portions of the inferior and middle turbinates - gathered from a sample of healthy individuals, so that these values can be used as reference in studies conducted upon populations with specific diseases and to better understand the outcomes of therapeutic and surgical interventions. Additionally to that, differences related to gender and variations caused by the use of nasal vasoconstrictor drugs are analyzed.
MATERIALS AND METHOD
Materials
Sixty nasal cavities were analyzed from a sample of 30 adult volunteers without evidences of nasal obstruction (14 males and 16 females aged between 18 and 30 years), after they signed a free informed consent form. Participants were selected based on answers given in a questionnaire designed to identify past and present signs and symptoms of nasal obstruction and on nasal airflow verification using Glatzel’s mirror, as described in the first paper of the series27. Twenty-four individuals were excluded from
the original sample of 54, as they had history of structural or functional nasal anomalies, nasal trauma, recurring respiratory infection, regular use of vasoconstrictor dru-gs, mouth breathing, or clearly reduced nasal airflow in the mirror test. No formal calculations were done on the number of participants.
This study was approved by the Research Ethics Committee of our institution under permit 070/2002-UEP-CEP.
Equipment and testing principles
Tests were conducted using an Eccovision Acoustic Rhinometer (HOOD Laboratories), which consists of a sound source (loudspeaker) distally positioned in relation to a 24 cm tube equipped with a microphone for acquisi-tion in its proximal poracquisi-tion. The rhinometry tube is placed against one of the nostrils; a sound wave generated by the loudspeaker propagates through the tube, passes through the microphone and enters the nasal cavity. Variations in the cross-sectional area, i.e., constrictions reducing cavity lumen, reflect the sound waves back into the rhinometry tube. Pressure signals sensitize the microphone and are amplified and digitized. A computer equipped with spe-cific software is used to analyze the signals. The system is shown on Fig. 1.
Nasal cross-sectional areas are calculated from the echo intensity values. Distance to site of constriction is calculated based on wave speed and time of echo feed-back. The data is converted into an area-distance function and presented on the computer monitor in the shape of a graph - the rhinogram - in which areas are shown in a semi-logarithmic scale on axis Y (in cm2) and distances on the
axis X (in cm) as seen in Fig. 2. The rhinometer generates 10 sound pulses in rapid succession (approximately one every 0.5 seconds) and at each test the software calculates the average of the cross-sectional areas acquired for the 10 cycles. The system allows measurements in the entire nasal cavity, and of the right and left sides independently.
Procedure and analyzed variables
Chart 1. Nasal cross-sectional areas (CSA) reported in the literature for adults without evidences of nasal obstruction, before and after vaso-constriction (VC). A u th ors E q u ip m e n t n A g e E th n ic it y C on d it ion N C g e n d e r
CSA before VC (cm2) CSA after VC (cm2)
C SA 1 C SA 2 C SA 3 C SA 1 C SA 2 C SA 3 Gryme et al. 19899 Experimental
device 21 22-48 NS
No significant nasal complaints or septum deformity 0,70 [0,03] 2,04 [0,13] 0,83 [0,03] 2,76 [0,15] Hilberg et al. 199010 Experimental
device 34 19-40 NS
No nasal complaints, deviated septum, or concha hypertrophy 0,72 (0,02) 1,27 (0,06) 1,51 (0,06) 0,96 (0,02) 2,12 (0,08) 2,60 (0,08) Len-ders & Pirsig 199011 Experimental
device 134 21-60
Cauca-sians
No history of nasal disease, anomalies in the middle third of the face, significant septum deformity , or concha hypertrophy Len-ders et al. 199112 Experimental
device 134 21-60
Cauca-sians
No history of nasal disease, anomalies in the middle third of the face, significant septum deformity, or concha hypertrophy 0,73 (0,20) 1,16 (0,41) Grymer et al. 199113 Experimental
device 82 18-40 NS
Subjective sensation of normal nasal patency and absence of struc-tural alterations under rhinoscopy R L 0,73 (0,02) 0,72 (0,02) 1,31 (0,05) 1,31 (0,05) 2,27 (0,09) 2,31 (0,10) 0,92 (0,02) 0,95 (0,02) 2,08 (0,06) 2,20 (0,08) 2,99 (0,08) 3,19 (0,09) Roith-mann et al. 199514 Eccovision Hood Labo-ratories AR-1003 51
CN 16-66 NS
No nasal disorders, structural or mucosal obstruction 0,62 (0,01) 0,67 (0,01) Morgan et al. 199515 Eccovision Hood Labo-ratories AR-1003 20 33 (10) Cauca-sians
No evident structural anomalies, nasal polyps, previous surgery or trauma, upper airway re-current infection, regular use of nasal medication
(0,15) (0,16) Roith-mann et al. 199716 Eccovision Hood Labo-ratories AR-1003
79 16-58 NS
No nasal complaints, significant structural or functional obstruction, low nasal airflow resis-tance 0,70 {0,43-1,34} 0,76 {0,47-1,44} Grymer et al. 199717
Corey et al. 199818 Eccovision Hood Labo-ratories AR-1003
53 18-57 Cauca-sians
No obvious nasal defor-mities, deviated septum, previous trauma, nose surgery, history of aller-gic rhinitis, nasal polyps, nasal breathing proble-ms, recent or recurring respiratory infection, or other significant health problems, and not using nasal medication. 0,52 (0,12) 0,83 (0,24) 1,31 (0,42) 0,64 (0,12) 1,51 (0,36) 2,08 (0,60) Tomkin-son & Eccles 199819 AR A1-GM
Instruments 48 18-59 NS
No history of nasal di-sease and with normal nasal anatomy under rhinoscopy 0,59 (0,22) 0,69 (0,22) Mil-qvist & Bende 199820
Rhin 2000 334 15-19 20-34
Cauca-sians
No recurring nasal symptoms > > < < > > < < M F M F M F M F 0,69 (0,07) 0,73 (0,06) 0,58 (0,07) 0,52 (0,05) 0,84 (0,04) 0,69 (0,08) 0,60 (0,04) 0,50 (0,02) Silkoff et al. 199921 Eccovision Hood Labo-ratories AR-1003
6 32-48 NS No nasal symptoms R
L 0,62* (0,15) 0,68* (0,17) Sung et al. 200022 Rhinoklak RK-1000 20 24,7 (mé-dia)
NS No deviated septum or nasal disease R L 0,62 (0,17) 0,61 (0,16) Larsson et al. 200123
Rhin 2000 102 18-52
Cauca-sians Subjectively healthy
0,58 (0,18) Ogni-bene et al. 200124 Eccovision Hood Labo-ratories AR-1003 10 24 (mé-dia) NS 0,57 (0,18) Zanca-nella & An- selmo-Lima 200425 SR2000
Rhi-nometrics 20 20-60
Whites and Asians
No nasal complaints, normal nasal cavities un-der anterior rhinoscopy and nasofibroscopy
0,59 0,60
Average (standard deviation) or average [standard error] or average {minimum-maximum} NS: not specified
NC: nasal cavities (R: right; L: left) >: larger side, <: smaller side
*averages calculated from published individual values
of a nasal vasoconstrictor drug (0.1% xylometazoline) on each nostril after nasal hygiene. The values used in our analysis are the averages for the three measurements conducted in three technically acceptable curves for each condition.
As discussed in detail in the first paper of the se-ries27, in order to minimize error in the measurements as
the ones resulting from ambient temperature variation and external noise, all tests were carried out in the same room, at a relatively stable ambient temperature and with noise levels never above 60dB, and after waiting for 30 minutes for the patients to adapt to the local conditions. The rhinometry tube was always placed in a parallel po-sition in relation to the nasal dorsum. The contact area between the nasal adapter tip and the nasal cavity end was sealed with neutral gel so as to avoid sound losses. The chins and foreheads of the participants were supported to keep their heads stable during examination as they were placed parallel to the floor, as seen in Fig. 1. The tests were conducted during voluntary nasal breathing suspen-sion after exhaling. The patients were told to remain with their mouths closed, without swallowing or moving their tongues during data acquisition, so as to prevent breathing and swallowing from interfering with the measurements and harming the quality of the rhinograms. We were also careful enough not to deform the participants’ nostrils and consequently their nasal valves. The rhinometer used in the study offers an adapter that is supposed to be lightly touched against the nostril, instead of introduced into it as is the case for the olive-shaped adapters9-13, which by
itself precludes nasal valve deformation. Patients had their spectacles removed so as to remove external pressure from the nose. The equipment was calibrated at the beginning of each day.
For analysis purposes, we considered the nasal cross-sectional areas (in cm2) obtained in the second dip
of the area-distance curve which corresponds to the nasal valve region (CSA1), in the third dip which corresponds to the anterior portion of the middle and inferior turbi-nate (CSA2), and in the fourth dip which corresponds to the posterior portion of the middle and inferior turbinate (CSA3), as seen in Fig. 2. The first dip, seen from distance zero and equivalent to the nostril, was not considered for analysis28.
Figure 1. Acoustic rhinometer (Eccovision, Hood Laboratories): instru-mentation to check nasal cavity cross-sectional areas; 1=sound tube; 2= nasal adapter; 3=calibration tube 4=computer monitor showing a rhinogram. See patient in position for data acquisition.
Figure 2. Rhinogram: area-distance graph produced by acoustic rhinometry, depicting the nasal cavity cross-sectional areas measu-red in the sites corresponding to the nasal valve (CSA1), the anterior (CSA2) and the posterior (CSA3) portions of the middle and lower nasal turbinates.
Data analysis
Considering that variable CSA follows a normal distribution18, the group results are expressed as averages ± standard deviation. Student’s T test was used to analyze the statistical significance of the differences between inde-pendent samples (males vs. females). Statistical significance difference for related paired samples (before vs. after sing nasal vasoconstrictor) was assessed through Student’s T test. Significance was assigned when p<0,05.
RESULTS
Table 1 shows the average values for CSA1, CSA2 and CSA3 for the 30 right nasal cavities and 30 left nasal cavities analyzed in this study, acquired before and after nasal vasoconstrictor drug administration. Sample size is not uniform for the three samples as, in some cases, it was not possible to measure CSA2 or CSA3 as their respective dips in the rhinogram were not identified.
Therefore, both sides were considered as independent cavities and new measurements were taken and avera-ges calculated for all 60 nasal cavities (right and left), as also seen in Table 1. Gender statistical differences were analyzed. CSA averages were not statistically significant differences between males and females before and after vasoconstriction.
Table 2 shows the average CSA values for the whole group, i.e., with males and females considered
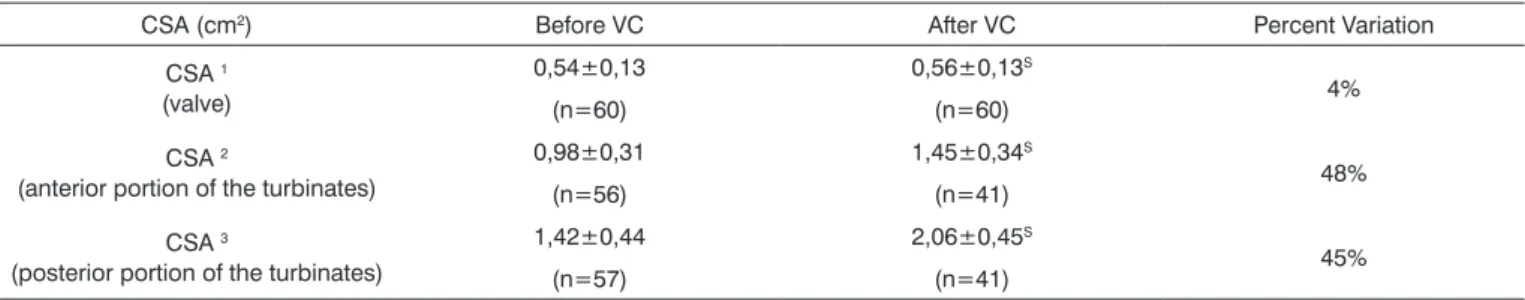
together and their respective observed percent variation after vasoconstrictor administration. Statistical analysis showed that vasoconstriction resulted in comparatively higher measured values, and larger percent variation for variables CSA2 and CSA3.
DISCUSSON
The recommendations for technical specifications and standard operating procedures from the European
Table 1. Nasal cross-sectional areas (CSA1, CSA2 and CSA3) measured through acoustic rhinometry in 60 nasal cavities of 30 adults without evidences of nasal obstruction, according to gender and cavity side (right - R; left - L), before and after nasal vasoconstriction (VC)
CSA (cm2)
Before VC After VC
R L R and L R L R and L
MALES (n=28) CSA1
(valve)
0,59±0,19 0,56±0,13# 0,57±0,16 0,62±0,15 0,57±0,13# 0,60±0,14
(n=14) (n=14) (n=28) (n=14) (n=14) (n=28)
CSA2
(anterior portion of the turbinates)
1,06±0,37 0,95±0,35# 1,00±0,36 1,63±0,34 1,47±0,22# 1,55±0,29
(n=11) (n=14) (n=25) (n=9) (n=9) (n=18)
CSA3
(posterior portion of the turbinates)
1,41±0,51 1,46±0,56# 1,43±0,53 2,05±0,32 2,16±0,36# 2,10±0,33
(n=13) (n=14) (n=27) (n=13) (n=11) (n=24)
FEMALES (n=32)
CSA1
(VALVE)
0,51±0,10 0,52±0,1# 0,51±0,10* 0,55±0,09 0,53±0,13# 0,54±0,10*
(n=16) (n=16) (n=32) (n=16) (n=16) (n=32)
CSA2
(anterior portion of the turbinates)
0,96±0,28 0,97±0,25# 0,96±0,27* 1,29±0,36 1,51±0,33# 1,37±0,36*
(n=16) (n=15) (n=31) (n=15) (n=8) (n=23)
CSA3
(posterior portion of the turbinates)
1,36±0,29 1,44±0,43# 1,40±0,36* 2,07±0,77 1,89±0,39# 1,99±0,57*
(n=15) (n=15) (n=30) (n=7) (n=10) (n=17)
Average ± standard deviation n = number of cavities analyzed
# not a statistically significant difference (right side vs. left side)
Rhinological Society7 include, among others, the
defi-nition of standard values for nasal areas and volumes. Following this guideline, this study aimed at defining reference values for cross-sectional areas (CSA) of specific segments of the nasal cavity of normal adult individuals, thus completing the data provided in a previously publi-shed paper on the reference values for nasal volumes27.
Two methodological issues deserve special at-tention. Firstly, the group of 30 individuals analyzed in this study were conveniently selected from a population of 54 apparently health individuals based on subjective reports of normal nasal patency sensation and no history of nasal functional and anatomical disorders, as also seen in control groups enrolled by other authors17,20,21,23. When
comparing the values acquired from our sample to the 0.35cm2 indicated as normal by Hilberg and Pedersen7,
we verified that only one of the 60 cavities analyzed had an area smaller than the value defining adequate nasal patency, strongly indicating that our sample was indeed made up by subjects without nasal obstruction. It is important to mention that in this case specifically the subject’s contralateral cavity had an area of 0.78cm2,
thus compensating for the likely structural or functional unilateral obstruction and sensation of adequate nasal patency. Secondly, the tests were carefully performed to take into account and control the variables pointed by other authors7,14,29 that could impact measurement
accu-racy and reproducibility, such as ambient temperature, external noise, rhinometry tube position, sound losses, head position, nostril deformation, equipment calibration, and interferences from breathing and swallowing. By doing so in other studies carried out at our laboratory, we observed variation in cross-sectional area rhinometry measurements ranging between 6% and 9%30.
Let us now analyze the nasal cross-sectional areas
acquired in this study and their differences in compari-son to those reported in the literature for normal adults, as seen in Table 1. Firstly, let us compare our results to those gathered by Corey et al.18, used as reference by the
manufacturer of the Eccovision Acoustic Rhinometer. In our study, the averages of the areas measured for all 60 cavities were 0.54±0.13cm2 (CSA1), 0.98±0.31cm2 (CSA2), and 1.42±0.44cm2 (CSA3), with no differences between genders. These values, obtained for the group as a who-le, were quite close to those reported by Corey et al.18, respectively 0.52±0.12cm2 (CSA1), 0.83±0.24cm2 (CSA2), and 1.31±0.42cm2 (CSA3). The same trend was observed for the values obtained after vasoconstriction.
For simplification purposes, we will now compare our CSA1 values (before vasoconstriction) - the standard measurement in all studies published on this subject - to the ones reported in other papers. The difference betwe-en average CSA1 values was never beyond 10%, whbetwe-en comparing our data set to that of various authors18,19,23-25,
which ranged between 0.52cm2 and 0.59cm2, thus
valida-ting the results published in this paper. The papers cited above are quite recent, and two used the same equipment employed in our study. In all others14-17,20-22, the average
CSA1 values ranged between 0.60cm2 and 0.78cm2. This
difference may be attributed to the fact that most studies - specially the ones done longer ago - used olive-type nasal adapters which ae known to introduce nasal cavity deformation, thus leading to overestimated cross-sectional area measurements14,29. Other factors that may explain
the observed differences are the characteristics and the size of the analyzed sample, the type of equipment em-ployed, and even the differences related to factors that may potentially introduce error in the measurements as mentioned before7,27. These findings stress the relevance
of defining reference values for each laboratory.
Table 2. Nasal cross-sectional areas (CSA1, CSA2 and CSA3) measured through acoustic rhinometry in 60 nasal cavities of 30 adults of both genders without evidences of nasal obstruction, before and after vasoconstriction (VC).
CSA (cm2) Before VC After VC Percent Variation
CSA 1
(valve)
0,54±0,13 0,56±0,13S
4%
(n=60) (n=60)
CSA 2
(anterior portion of the turbinates)
0,98±0,31 1,45±0,34S
48%
(n=56) (n=41)
CSA 3
(posterior portion of the turbinates)
1,42±0,44 2,06±0,45S
45%
(n=57) (n=41)
Average ± standard deviation n = number of cavities analyzed
In some of the rhinograms it was not possible to identify the dips related to CSA2 and CSA3, more speci-fically after vasoconstriction. One may speculate that this resulted from absence of constrictions along the nasal cavity after the valve that could modify sound reflection and thus create a dip in the rhinogram, similarly to what would occur in a straight tube. We cannot, however, discard the possibility that this was a technical artifact.
In terms of gender differences, differently from what was observed in the larger volumes seen in males in the areas close to the valve and turbinates27, we found
that CSA1, CSA2 and CSA3 were not statistically different for males and females. This allowed the analysis of all 60 nasal cavities in one large group, as seen in Table 2, and the consideration of reference values for both genders, an approach not recommended for nasal volumes.
Finally, we should comment on the results obtai-ned under vasoconstriction. This procedure is perfor-med to identify structural changes in the nasal fossae, considering that the functional effect of the mucosa is removed. Similarly to what was seen for nasal volumes27,
we observed a significant increase in the cross-sectional area of the three segments analyzed when under nasal vasoconstriction. The effect was more evident on CSA2 and CSA3 than on CSA1, thus confirming that the nasal valve is proportionally less susceptible to mucosal status variation than the turbinates.
CONCLUSION
This study used acoustic rhinometry to determine the reference values for nasal cross-sectional areas to be used, for comparison purposes, in the analysis of adults with functional and/or anatomical nasal obstruction. The findings we gathered reinforce the relevance of rhino-metry as a valuable tool to enhance the assessment of nasal patency and better understand nasal and respiratory physiology.
REFERENCES
1. Warren DW, Drake AF. Cleft nose: form and function. Clin Plast Surg 1993; 20:769-79.
2. Bertier CE, Trindade IEK. Deformidades nasais: avaliação e tratamento cirúrgico. In: Trindade IEK, Silva Filho OG. Fissuras Labiopalatinas: uma abordagem interdisciplinar. São Paulo: San-tos; 2007. p.87-07.
3. Warren DW. A quantitative technique for assessing nasal airway impairment. Am J Orthod 1984;86:306-14.
4. Hilberg O, Jackson AC, Swift DL, Pedersen OF. Acoustic rhino-metry: evaluation of nasal cavity geometry by acoustic reflection. J Appl Physiol 1989; 66:295-303.
5. Roithmann R, Cole P. Objective assessmentof nasal patency: why, when, how? Rev Bras Otorrinolaringol 1995;61:104-9.
6. Kunkel M, Wahlmann U, Wagner W. Nasal airway in cleft-palate patients: acoustic rhinometric data J Cranio-Max Fac Surg 1997; 25:270-4.
7. Hilberg O, and Pedersen OF. Acoustic rhinometry: recommen-dations for technical specifications and standard operating pro-cedures. Rhinol Suppl 2000; 16:3-17.
8. Hilberg O. Objective measurement of nasal airway dimensions using acoustic rhinometry: methodological and clinical aspects. Allergy 2002;57 (Suppl. 70):5-39.
9. Grymer LF, Hilberg O, ElbrØnd O, Pedersen OF. Acoustic rhi-nometry: evaluation of the nasal cavity with septal deviations, before and after septoplasty. Laryngoscope 1989; 99:1180-7. 10. Hilberg O, Grymer LF, Pedersen O, ElbrØnd O. Turbinate
hyper-trophy: evaluation of the nasal cavity by acoustic rhinometry. Arch Otolaryngol Head Neck Surg 1990; 116:283-9.
11. Lenders H, Pirsig W. Diagnostic value of acoustic rhinometry: patients with allergic and vasomotor rhinitis compared with normal controls. Rhinology 1990; 28:5-16.
12. Lenders H, Schaefer J, Pirsig W. Turbinate hypertrophy in habi-tual snorers and patients with obstrutive sleep apnea: findings of acoustic rhinometry. Laryngoscope 1991; 101:614-8.
13. Grymer L, Hilberg O, Pedersen O, Rasmussen TR. Acoustic rhino-metry: values from adults with subjective normal nasal patency. Rhinology 1991; 29:35-47.
14. Roithmann R, Cole P, Chapnik J, Shpirer I, Hoffstein V, Zamel N. Acoustic rhinometry in the evaluation of nasal obstruction. Laryngoscope 1995; 105:275-81.
15. Morgan NJ, MacGregor FB, Birchall MA, Lund VJ, Sittampalam Y. Racial differences in nasal fossa dimensions determined by acoustic rhinometry. Rhinology 1995; 33:224-8.
16. Roithmann R, Chapnik J, Zamel N, Barreto SM, Cole P. Acoustic rhinometric assessment of the nasal valve. Am J Rhinol 1997; 11:379-85.
17. Grymer LF, Hilberg O, Pedersen OF. Prediction of nasal obs-truction based on clinical examination and acoustic rhinometry. Rhinology 1997; 35:53-57.
18. Corey J, Gungor A, Nelson R, Liu X, Fredberg J. Normative standards for nasal cross-sectional areas by race as measured by acoustic rhinometry. Otolaryngol Head Neck Surg 1998; 119:389-93.
19. Tomkinson A, and Eccles R. Acoustic rhinometry: an explanation of some common artifacts associated with nasal decongestion. Clin Otolaryngol 1998; 23:20-6.
20. Millqvist E, and Bende M. Reference values for acoustic rhino-metry in subjects without nasal symptoms. Am J Rhinol 1998; 12:341-3.
21. Silkoff PE, Chakravorty S, Chapnik J, Cole P, Zamel N. Reprodu-cibility of acoustic rhinometry and rhinomanometry in normal subjects. Am J Rhinol 1999; 13:131-5.
22. Sung Y, Lee M, Kim I, Lim D, Rha K, Park C. Nasal cycle in pa-tients with septal deviation: evaluation by acoustic rhinometry Am J Rhinol 2000; 14:171-4.
23. Larsson C, Millqvist E, Bende M. Relationship between subjective nasal stuffiness and nasal patency measured by acoustic rhino-metry. Am J Rhinol 2001; 15:403-5.
24. Ognibene NE, Merrick MA, Ingersoll CD. Intra- and intercesión reliability of acoustc rhinometry in measuring nasal cross-sectional area. Ear Nose Throat J 2001; 80:536-40.
25. Zancanella E, Anselmo-Lima WT. Uso da rinometria acústica como método diagnóstico. Rev Bras Otorrinolaringol 2004; 70:500-3. 26. Roithmann R. Testes específicos da permeabilidade nasal
[edito-rial]. Rev Bras Otorrinolaringol 2007;73:2.
28. Nigro CEN, Nigro JFA, Voegels RL, Mion O, Mello Jr JF. Acoustic rhinometry: anatomic correlation of the first two notches found in the nasal echogram. Rev Bras Otorrinolaringol (Engl Ed). 2005 ;71:149-54.
29. Lai VWS, Corey JP. The objective assessment of nasal patency. Ear Nose Throat J 1993; 72:395-400.