Internal nasal dimensions of adults with nasal obstruction
Abstract
Inge Elly Kiemle Trindade1, Priscila Capelato Prado Conegliam2, Sergio Henrique Kiemle Trindade3,
Norimar Hernandes Dias4, Ana Claudia Martins Sampaio-Teixeira5
1 Full Professor (Bauru School of Denistry and Hospital for Rehabilitaion of Craniofacial Anomalies of the University of São Paulo).
2 MSc, Rehabilitaion Sciences, Hospital for Rehabilitaion of Craniofacial Anomalies of the University of São Paulo (Nurse, Hospital for Rehabilitaion of Craniofacial Anomalies of
the University of São Paulo).
3 PhD, Otorhinolaryngology, School of Medicine of the University of São Paulo (MD, ENT, Botucatu School of Medicine and Bauru State Hospital). 4 PhD, Otorhinolaryngology, Botucatu School of Medicine (MD, ENT, Botucatu School of Medicine and Bauru State Hospital).
5 PhD, Sciences, Hospital for Rehabilitaion of Craniofacial Anomalies of the University of São Paulo (Biologist, Physiology Laboratory, Hospital for Rehabilitaion of Craniofacial
Anomalies of the University of São Paulo).
Hospital for Rehabilitaion of Craniofacial Anomalies/Denistry School of Bauru, University of São Paulo. Send correspondence to: Inge Elly Kiemle Trindade. Rua Silvio Marchione, nº 3-20. Bauru - SP. Brazil. CEP: 17012-900. Paper submited to the BJORL-SGP (Publishing Management System - Brazilian Journal of Otorhinolaryngology) on December 11, 2012;
N
asal septum deviation (SD) and turbinate hypertrophy (TH) increase the resistance to respiratory airflow and may impair nasal patency.Objective: To characterize the nasal geometry of individuals with nasal obstruction secondary to SD and/or TH by means of acoustic rhinometry.
Method: This prospective study included 30 adults with complaints of nasal obstruction (NO) and SD + TH (n = 24), SD (n = 5) or TH (n = 1) seen by clinical examination. The cross-sectional areas of the three main dips of the rhinogram (CSA1, CSA2, CSA3), the distance between them and the nostrils (dCSA1, dCSA2, dCSA3), and the volumes of segments 1.0-3.2 cm (V1), 3.3-6.4 cm (V2), and 7.0-12.0 cm (V3) were measured before and after nasal decongestion (DN). For analysis, right and left cross-sectional areas and volumes were added and mean dCSA was calculated.
Results: Mean values (± standard deviation) before ND were: 0.83 ± 0.23 (CSA1), 1.66 ± 0.52 (CSA2), and 2.36 ± 0.77 (CSA3) cm2; 2.19 ± 0.20 (dCSA
1), 4.01 ± 0.33 (dCSA2), and 5.85 ± 0.37 (dCSA3) cm;
2.77 ± 0.51 (V1), 6.52 ± 1.99 (V2), and 26.00 ± 9.62 (V3) cm3; all values were lower than laboratory
reference values (p < 0.05). ND led to proportionally greater increases of sectional areas and volumes in the NO group, suggesting an associated functional component. Individual analysis revealed 12 cases with normal results despite nasal obstruction.
Conclusion: Most patients with structural nasal obstruction had results suggestive of nasal patency impairment in acoustic rhinometry.
ORIGINAL ARTICLE
Braz J Otorhinolaryngol. 2013;79(5):575-81.
BJORL
Keywords: acoustic rhinometry; nasal cavity; nasal obstruction; nasal septum; sphenoidal conchae.
.org
INTRODUCTION
The nose plays a series of vital functions. It filtrates, heats, and moistens inhaled air; it is the first line of defense against inhaled allergens; it acts as a sensory olfactory organ and affects resonance in speech produc-tion. Conditions such as deviated septum and turbinate hypertrophy affect nasal geometry and may impair nasal patency and the physiology of the nose, due to reductions in the inner dimensions of the nasal cavity and increases in the resistance to the flow of breathed air1-3.
Acoustic rhinometry can be used to verify nasal geometry in an objective non-invasive manner4,5. This test uses the acoustic reflections of a sound pulse to measure the nose and the nasal cavity6.
This study aimed to measure the nasal cavities of adult patients with nasal obstruction caused by deviated septum and/or nasal concha hypertrophy and com-pare them to measurements made in subjects without signs of involvement. Cross-sectional areas, distances to the nostrils, and volumes of specific areas of the nasal cavity were analyzed and compared to reference values of individuals without signs of nasal obstruction described by Gomes7.
METHOD
The series
This study was approved by the Research Ethics Committee of the Craniofacial Rehabilitation Hospital of the University of São Paulo (HRAC/USP) and given permit 381/2006-SVAPEPE-CEP, and by the Research Committee of the Bauru State Hospital (HEB) as per permit HEB-CC-097/06.
This prospective study included an accidental sample of 30 adult individuals with nasal obstruction due to deviated septum and/or turbinate hypertrophy (Caucasian/brown adults of both genders, aged between 18 and 40 years). Participants were selected from a group of individuals who came to the ENT Clinic of the Bauru State Hospital (HEB) for nasal obstruction of any grade confirmed through physical examination at a later stage. Patients meeting the enrollment criteria were invited to join the study. Patients with enlarged pharyngeal tonsils, nasal obstruction of different etiologies such as previous nose surgery, or other conditions that prevented them from completing the study were excluded. Patients on nasal medication of any type were requested to stop treatment for five to seven days to undergo acoustic rhinometry.
Clinical examination
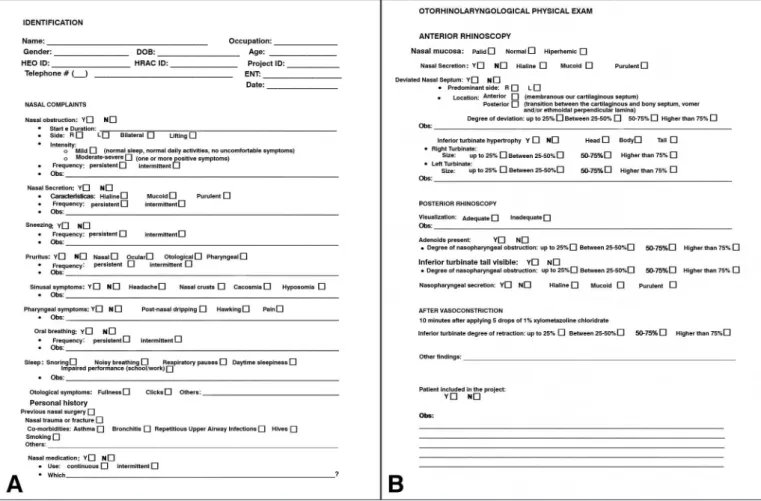
The diagnosis of nasal obstruction was based on the information collected during patient interviews and physical examinations performed in accordance with a
protocol designed with this purpose (Figure 1A-B). The assessment protocol consisted primarily of a directed interview, in which the following data was collected:
1. time and duration of obstruction symptoms; 2. side of nasal obstruction;
3. frequency of nasal obstruction episodes; 4. rhinitis symptoms;
5. pharyngeal symptoms; 6. sinus symptoms; 7. ear symptoms; 8. nasal disease history;
9. associated diseases and habits.
Physical examination included anterior rhinoscopy, performed with the aid of a frontal light source and a nasal speculum, before and after administration of nasal vasoconstrictors, posterior rhinoscopy aided by a Garcia speculum to assess the rhinopharynx, otoscopy, and neck examination to capture possible associated lesions. When the more superior portions of the nasal fossae and rhinopharynx could not be assessed satisfactorily in clinical examination, subjects underwent examination with a Storz 3.4 mm endoscope. These measures were taken to rule out the presence of obstructive lesions in the respiratory portion of the nasal fossa such as tumors and inflammatory or neoplastic polyps. The characteristics of the nasal mucosa and nasal secretions, the degree and type of septum deviation, and the presence of inferior turbinate hypertrophy were analyzed during nasal cavity examination. The observed variables had a merely explora-tory character and were considered only for the purposes of this study.
Acoustic rhinometry
Acoustic rhinometry was carried out at the Physiology Laboratory at HRAC/USP. An Eccovision Acoustic Rhinometer (HOOD Laboratories) was used and the tests were conducted as proposed by Trindade et al.8 and Gomes et al.9 Figure 2 shows a rhinogram from a patient with nasal obstruction.
for the right and left nasal cavities and the results were combined. Examination was done before and 10 minutes after administering five drops of a nasal vasoconstrictor (0.1% xylometazoline hydrochloride).
Data analysis
The variables were expressed as mean values ± stan-dard deviation. The cross-sectional areas, distances from the nostrils, and nasal volumes seen in adult subjects with similar ages as the individuals in this study and without signs of nasal obstruction included in a previous study car-ried out at the Physiology Laboratory at the HRAC/USP7-9,12 were used for comparison purposes. In order to meet the requirements of this study, the individual values verified for 60 nasal cavities of 30 patients without nasal obstruc-tion were used to calculate the summaobstruc-tion of the areas and volumes seen in the right and left nasal cavities of each individual and their mean distances. Table 1 shows the mean values seen for the group.
Acoustic rhinometry reference values minus two standard deviations were used to determine the lower limits of normality and help identify ranges of values suggestive of nasal obstruction13. Student’st-test was used to compare the groups (p < 0.05).
Figure 2. Typical rhinogram of a patient with nasal obstruction, showing the sites used to measure cross-sectional areas (CSA), distance from nostrils (dCSA), and nasal volumes (V).
Figure 1. A: Interview protocol developed for this study; B: Physical ENT examination protocol developed for this study.
RESULTS
For the purposes of analysis, the data observed for male and female subjects were combined into one group (n = 30), given that under baseline conditions, i.e., before the administration of nasal decongestants, no statistically significant differences were seen between genders. Clinical examination showed that 24 subjects had septum deviations associated with inferior nasal concha hypertrophy; five had septum deviations alone; and one had isolated inferior nasal concha hypertrophy.
Table 2 shows the mean values of cross-sectional areas and volumes (right and left sides combined) and distances of the three studied segments from the nostrils (mean right and left nostril distances) for patients with nasal obstruction.
Comparisons against the values reported for controls (Table 1) revealed the CSA values of the group with nasal obstruction were significantly lower in the three considered segments before the administration of nasal decongestants. After decongestant administration, statistically significant differences were seen only in CSA1. Table 2 shows that percent variations in CSA1, CSA2, and CSA3 of patients with nasal obstruction after decongestant administration were +17%, +58%, and +54% in relation to individuals without nasal obstruction.
In regards to the distances from the nostrils of the analyzed segments, Table 2 shows that before the administration of nasal decongestants the mean dCSA1 and dCSA2 were significantly higher in the nasal obstruction group. After the administration of deconges-tants, statistically significant differences were seen only for dAST2.
Volumes before and after decongestants were significantly lower in the nasal obstruction group in all analyzed segments. The percent variation of the mean V1, V2, and V3 values after decongestants were +18%, +55%, and +41%, respectively, in relation to obstruction-free individuals.
The comparison of individual results against the range of normality calculated from the data published by Gomes7, together with the observation of the subjects’ rhinograms, revealed that 18 patients in the nasal obstruction group had subnormal (below the limits of normality) cross-sectional areas in one or more of the analyzed segments (CSA1, CSA2, CSA3); the remaining patients (n = 12) had cross-sectional areas above the lower limits of normality.
The group with nasal obstruction was subdivided into two groups: nasal obstruction with subnormal CSA (n = 18) and nasal obstruction with normal CSA (n = 12). Mean cross-sectional areas were recalculated and compared to the reference mean values described by Gomes7, as shown in Table 3. The ‘nasal obstruction with normal CSA’ subgroup was found to have significantly lower mean CSA1 values than the controls described by Gomes7. Subgroup ‘nasal obstruction with subnormal CSA’ had statistically significant different values in the three analyzed segments when compared to the controls described by Gomes7 and to subgroup ‘nasal obstruction with normal CSA’.
Table 3 indicates that subgroup ‘nasal obstruction with subnormal CSA’ had greater percent variations in CSA1, CSA2, and CSA3 (+27%, +82%, and +74%, respectively) than subgroup ‘nasal obstruction with normal CSA’ (+6%, +32%, and +33%, respectively); the latter had cross-sectional areas comparable to the controls described by Gomes7.
Table 1. Reference values for cross-sectional areas (CSA1,
CSA2, CSA3), distances from nostrils (dCSA1, dCSA2, dCSA3), and volumes in adults without signs of nasal obstruction, before (Pre-ND) and after (Post-ND) the administration of nasal decongestants as reported by Gomes7 and Camargo12.
Variables Pre-ND Post-ND
CSA1 (cm2) 1.08 ± 0.21 1.13 ± 0.17 [+5%]
CSA2 (cm2) 1.95 ± 0.35 2.83 ± 0.40 [+45%]
CSA3 (cm2) 2.85 ± 0.51 3,97 ± 0.70 [+39%]
dCSA1 (cm) 2.12 ± 0.19 2.04 ± 0.17
dCSA2 (cm) 3.82 ± 0.34 3.89 ± 0.35
dCSA3 (cm) 5.74 ± 0.41 5.85 ± 0.51
V1 (cm3) 3.37 ± 0.50 3.65 ± 0.42 [+8%]
V2 (cm3) 7.95 ± 1.22 11.06 ± 1.70 [+39%]
V3 (cm3) 35.34 ± 7.13 45.41 ± 8.06 [+29%]
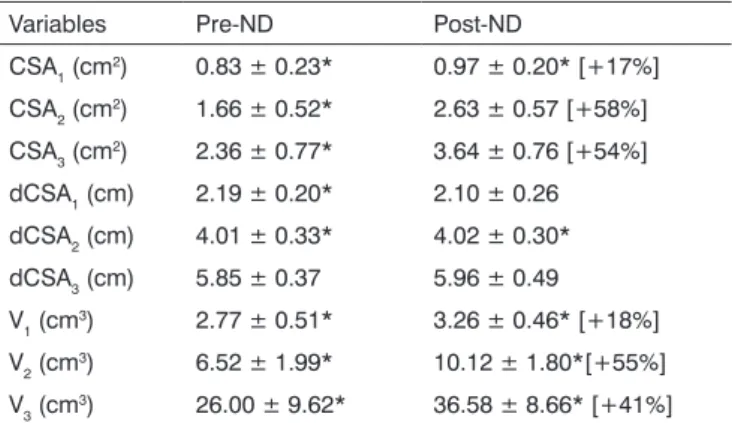
Table 2. Cross-sectional areas (CSA1, CSA2, CSA3), distances
from the nostrils (dCSA1, dCSA2, dCSA3), and nasal volumes of adults with nasal obstruction before (Pre-ND) and after (Post-ND) the administration of decongestants.
Variables Pre-ND Post-ND
CSA1 (cm2) 0.83 ± 0.23* 0.97 ± 0.20* [+17%]
CSA2 (cm2) 1.66 ± 0.52* 2.63 ± 0.57 [+58%]
CSA3 (cm2) 2.36 ± 0.77* 3.64 ± 0.76 [+54%]
dCSA1 (cm) 2.19 ± 0.20* 2.10 ± 0.26
dCSA2 (cm) 4.01 ± 0.33* 4.02 ± 0.30*
dCSA3 (cm) 5.85 ± 0.37 5.96 ± 0.49
V1 (cm3) 2.77 ± 0.51* 3.26 ± 0.46* [+18%]
V2 (cm3) 6.52 ± 1.99* 10.12 ± 1.80*[+55%]
V3 (cm3) 26.00 ± 9.62* 36.58 ± 8.66* [+41%]
DISCUSSION
Three dips were seen in the baseline rhinograms of the subjects enrolled in this study, i.e., before the administration of decongestants, as previously described for normal adults and children7-9. The narrower segment, referred to herein as the minimum cross-sectional area (mCSA), was located in the anterior portion of the nasal cavity on 26 of the 30 subjects, within up to three centimeters of the nostrils, as described by Clement & Gordts14 in a paper published by the Standardization Committee on Objective Assessment of the Nasal Airway.
Therefore, in these 26 cases CSA1 and mCSA were the same. The first dip in the rhinogram, which corresponds to the nasal valve and previously identified in European literature as the I-notch in reference to the Isthmus nasi, shifted in the anterior direction after the administration of decongestants, as observed in the original study by Grymer et al.15 Another dip was also seen in all rhinograms, situated ahead of the first dip and accounting for the nostrils. As it was deemed merely as a landmark (position 0.0), this dip was not considered in our analysis.
Comparison between results and reference values indicated that the mean cross-sectional areas of the three analyzed nasal segments - nasal valve (CSA1), anterior nasal concha (CSA2), and posterior nasal concha (CSA3) were significantly higher in the reference cross-sectional areas of adults without signs of nasal obstruction described by Gomes7. In that study, using a similar method, 60 nasal cavities were analyzed and found to have cross-sectional areas of 0.54, 0.98, and 1.42 cm2 respectively, while in this study the right-side cross-sectional areas were 0.45, 0.80, and 1.13 cm2, and the left-side cross-sectional areas were 0.37, 0.87 and 1.22 cm2 respectively. These values were significantly lower than the values observed for normal individuals, as also seen in the volumes of the three na-sal segments - nana-sal valve (V1), nasal conchae (V2), and nasopharynx (V3), with mean volumes of 1.68, 3.98, and 18.93 cm³ in normal individuals, and 1.46, 3.17, and 13.19 cm3 on the right side and 1.31, 3.35, and 12.81 cm³ on the left side of individuals with nasal obstruction, respectively.
These values are similar to the values reported by various authors. However, comparisons require caution, as a number of uncontrolled variables present in these studies impact internal nasal measurements, such as degree of nasal obstruction, age, gender, posture, ethnic group, room temperature, external noise, and breathing, among others6,16-21. Individual data analysis suggested that most patients had some degree of involvement. Although the differences appear to be minimal, given the quadratic and cubic nature of the measurements, apparently small differences may actually indicate variations large enough to significantly alter nasal patency.
After topical administration of nasal decongestants, a procedure used routinely in acoustic rhinometry to minimize mucosal edema, all mean values were increased as also seen in normal adult populations7. The increase in mean cross-sectional areas and volumes observed after nasal decongestant administration was clearly greater in the nasal obstruction group than in what Gomes7 reported for normal subjects, indicating the presence of a functional component in the origin of the obstructive symptoms of the analyzed patients in addition to skeletal alterations seen in ENT examination. Symptoms consistent with nasal obstruction of a functional origin were reported in the interviews of some of the patients.
Although no differences were seen between nasal cavity sides, it is worth pointing out that the authors of this study considered the values resulting from the combination of both sides so as to avoid possible differences related to the nasal cycle. This is an episodic physiological phenomenon characterized by the alternation of mucosal congestion and decongestion cycles which reciprocally affect the nasal cavities, producing low-flow resting phases and high-flow active phases22,23.
The mean distances from the nostril of the three dips in the rhinogram (dAST1, dAST2, dAST3) reported for adults in other studies7,12 were 2.12, 3.82 and 5.74 cm, respectively. The group of subjects with nasal obstruction included in this study had mean distances from the right nostril of 2.14, 4.00 and 5.83 cm, respectively, and 2.24, 4.04 and 5.88 cm on the left side, respectively; higher
Table 3. Comparison between nasal cross-sectional areas (CSA1, CSA2, CSA3) of adults without signs of nasal obstruction (C)
described by Gomes7 and subgroups of adults with nasal obstruction and normal and subnormal CSA analyzed in this study,
before (Pre-ND) and after (Post-ND) the administration of nasal decongestants. The data relect the combination of values from the right and left sides.
Condition Subgroup CSA1 (cm2) CSA
2 (cm
2) CSA
3 (cm 2)
Pre-ND Normal CSA (n = 12) 0.96 ± 0.19* 2.02 ± 0,41 2,83 ± 0,46 Subnormal CSA (n = 18) 0.74 ± 0.21*# [+6%] 1.43 ± 0.46*# 2,04 ± 0,77*#
Post-ND Normal CSA (n = 12) 1.02 ± 0.18* [+27%] 2.67 ± 0.40 [+32%] 3,76 ± 0,41 [+33%] Subnormal CSA (n = 18) 0.94 ± 0,21* [+27%] 2.61 ± 0.67 [+82%] 3,56 ± 0,92* [+74%]
* p < 0.05 statistically signiicant difference (nasal obstruction patients vs. reference values); #p < 0.05 statistically signiicant difference (nasal
values were seen for dAST1 and dAST2. Differences between sides did not appear to be clinically significant. The results observed in this study suggest that nasal obstruction may have caused sites of nasal constriction to move in the posterior direction, at least in part of the cases, a shift also seen after the removal of the impact of mucosal edema with the use of decongestants.
Visual analysis of rhinograms indicated that 12 of the 30 patients who had clinical evidences of nasal obstruction also had apparently normal rhinogram curves (ascending W-shaped curve). When the group was subdivided into two subgroups and the mean values were analyzed, it was found that subjects with subnormal areas (descending W-shaped curve) were different from control group subjects in all analyzed segments of the nose, while the group with 12 patients with paradoxically normal individual areas differed from the control group only in CSA1, possibly implying a trend toward small constrictions in areas of the nasal valve and explaining the subjective sensation of nasal obstruction experienced by these patients due to the resistive nature of this segment. More studies on this area are needed, as the sensation of obstruction is not limited to the size of the airway or by the ratio of laminar and turbulent flows, as suggested by Clement & Gordts14.
Although the subgroup of patients with subnormal values had clearly better response to therapy with decongestants than subjects with normal values, the 12 patients with normal values had limited response to decongestants when compared to normal subjects. Therefore, it should be investigated whether this behavior is not related to alterations in the autonomic regulation of the nasal mucosa, thus denoting diseased nasal mucosas unresponsive to adrenergic stimulation24.
In support of evidence-based medicine, this study has shown that acoustic rhinometry may contribute in the objective analysis of nasal airway obstruction, and add to the subjective data derived from scales and questionnaires and clinical ENT findings. In this aspect, this study also aided in the systematization of a clinical assessment proto-col (Figure 1A-B) useful for the purposes of documentation and research16.
CONCLUSION
This study revealed the presence of significant nasal patency involvement in patients with deviated septa and nasal concha hypertrophy confirmed through acoustic rhinometry. However, a subgroup of patients with normal acoustic rhinometry findings was identified in the group of patients with clinical signs of structural alterations; this group will be the topic of future studies.
REFERENCES
1. Wetmore RF. Importance of maintaining normal nasal function in the cleft palate patient. Cleft Palate Craniofac J. 1992;29(6):498-506. PMID: 1450189 DOI: http://dx.doi.org/10.1597/1545-1569(1992)029<0498:IO MNNF>2.3.CO;2
2. Warren DW, Drake AF, Davis JU. Nasal airway in breathing and speech. Cleft Palate Craniofac J. 1992;29(6):511-9. PMID: 1450191 DOI: http://dx.doi.org/10.1597/1545-1569(1992)029<0511:NAIBAS> 2.3.CO;2
3. Bertier CE, Trindade IEK. Deformidades nasais: avaliação e tratamento cirúrgico. In: Trindade IEK, Silva Filho OG. Fissuras labiopalatinas: uma abordagem interdisciplinar. São Paulo: Editora Santos; 2007. p.87-107.
4. Roithmann R, Demeneghi P, Faggiano R, Cury A. Effects of posture change on nasal patency. Braz J Otorhinolaryngol. 2005;71(4):478-84. PMID: 16446964
5. Roithmann R. Specific tests for nasal permeability. Braz J Otorhino-laryngol. 2007;73(1):2. PMID: 17505591
6. Roithmann R, Cole P, Chapnik J, Shpirer I, Hoffstein V, Zamel N. Acoustic rhinometry in the evaluation of nasal obstruction. Laryn-goscope. 1995;105(3 Pt 1):275-81.
7. Gomes AOC. Dimensões nasais e nasofaríngeas de indivíduos sem evidências de obstrução nasal avaliadas por rinometria acústica no repouso e na fala [Dissertação de Mestrado]. Bauru: Universidade de São Paulo - Hospital de Reabilitação de Anomalias Craniofaciais; 2004. 8. Trindade IEK, Gomes AOC, Sampaio-Teixeira ACM, Trindade SHK.
Adult nasal volumes assessed by acoustic rhinometry. Braz J Otorhi-nolaryngol. 2007;73(1):32-9.
9. Gomes AOC, Sampaio-Teixeira ACM, Trindade SHK, Trindade IEK. Nasal cavity geometry of healthy adults assessed using acoustic rhi-nometry. Braz J Otorhinolaryngol. 2008;74(5):746-54.
10. Corey JP. Acoustic rhinometry: should we be using it? Curr Opin Otolaryngol Head Neck Surg. 2006;14(1):29-34. DOI: http://dx.doi. org/10.1097/01.moo.0000193166.57129.80
11. Antila J, Sipilä J, Tshushima Y, Polo O, Laurikainen E, Suonpää J. The effect of laser-uvulopalatopharyngoplasty on the nasal and nasopharyngeal volume measured with acoustic rhinometry. Acta Otolaryngol Suppl. 1997;529:202-5. PMID: 9288310 DOI: http://dx.doi. org/10.3109/00016489709124122
12. Camargo T. Distância da válvula nasal de adultos com e sem fissura labiopalatina estimada por rinometria acústica [monografia]. Bauru: Universidade de São Paulo; 2008.
13. Snedecor GW, Cochran WG. Statistical methods. 7 ed. Ames: Iowa State University Press; 1980.
14. Clement PA, Gordts F.; Standardisation Committee on Objective Asses-sment of the Nasal Airway, IRS, and ERS. Consensus report on acoustic rhinometry and rhinomanometry. Rhinology. 2005;43(3):169-79. PMID: 16218509
15. Grymer LF, Hilberg O, Elbrønd O, Pedersen OF. Acoustic rhinometry: evaluation of the nasal cavity with septal deviations, before and after septoplasty. Laryngoscope. 1989;99(11):1180-7. DOI: http://dx.doi. org/10.1288/00005537-198911000-00015
16. Prado PC. Dimensões internas nasais de adultos com obstrução nasal avaliadas por rinometria acústica [Dissertação de Mestrado]. Bauru: Hospital de Reabilitação de Anomalias Craniofaciais da Universidade de São Paulo; 2009.
17. Morgan NJ, MacGregor FB, Birchall MA, Lund VJ, Sittampalam Y. Racial differences in nasal fossa dimensions determined by acoustic rhinometry. Rhinology. 1995;33(4):224-8.
19. Tomkinson A, Eccles R. Acoustic rhinometry: an explanation of some common artefacts associated with nasal decongestion. Clin Otolaryngol Allied Sci. 1998;23(1):20-6. PMID: 9563661 DOI: http:// dx.doi.org/10.1046/j.1365-2273.1998.00066.x
20. Hilberg O, Pedersen OF. Acoustic rhinometry: recommendations for technical specifications and standard operating procedures. Rhinol Suppl. 2000;16:3-17.
21. Parvez L, Erasala G, Noronha A. Novel techniques, standardization tools to enhance reliability of acoustic rhinometry measurements. Rhinol Suppl. 2000;16:18-28.
22. Cole P. The respiratory role of the upper airways: a selective clinical and pathophysiological review. Saint Louis: Mosby Year Book; 1993. 23. Mlynski G. Surgery of the nasal septum. Facial Plast Surg.
2006;22(4):223-9. DOI: http://dx.doi.org/10.1055/s-2006-954840 24. Ciprandi G, Cirillo I, Pistorio A, La Grutta S. Relationship between