Adult nasal volumes assessed
by acoustic rhinometry
Summary
Inge Elly Kiemle Trindade 1, Adriana de OliveiraCamargo Gomes 2, Ana Claudia Martins
Sampaio-Teixeira 3, Sergio Henrique Kiemle Trindade 4
1 Full Professor (Head of the Biological Science Department of the Bauro Dentistry School - USP and Researcher at the Craniofacial Anomalies Rehabilitation Hospital
Physiology Laboratory, HRAC-USP, Bauru-SP)
2 Master in Rehabilitation Sciences from the HRAC-USP. (Doctoral student in the Rehabilitation Science post-graduate program, Physiology Laboratory, HRAC-USP,
Bauru-SP).
3 Doctor on Sciences from the HRAC-USP. (Physiologist, Physiology Laboratory, HRAC-USP, Bauru-SP )
4 Otorhinolaryngologist (Medical doctor in the Otorhinolaryngological Clinical Division at the Clinical Hospital - FMUSP, Servidor Publico Estadual Hospital - SP and
Bauru State Hospital - SP)
Physiology Laboratory, Craniofacial Anomalies Rehabilitation Hospital Physiology Laboratory, Sao Paulo University (USP).
Address for correspondence: Professor and Doctor Inge Elly Kiemle Trindade, Physiology Laboratory, Craniofacial Anomalies Rehabilitation Hospital - USP Rua Silvio Marchione 3-20, 17012-900 Bauru-SP, Brazil telephone: (14)3235-8137 email:[email protected]
FAPESP, CNPq, CAPES
Paper submitted to the ABORL-CCF SGP (Management Publications System) on February 16th, 2006 and accepted for publication on July 24th, 2006. cod. 1731.
A
coustic rhinometry allows an objective and non-invasive assessment of nasal geometry. Aim: The present study aimed at determining the volumes of specific segments of the nasal cavity in healthy adults including the nasopharynx, using acoustic rhinometry. Study design: A clinical prospective analysis. Cases and Method: Thirty volunteers with no evidence of nasal obstruction, aged 18 to 30 years (14 males and 16 females) were analyzed. Volumes were measured at the nasal valve region (V1), the turbinates (V2), and the nasopharynx (V3), before and after application of a topical nasal vasoconstrictor. Results: The mean volumes measured in 60 cavities before nasal decongestion, were: 1.81±0.35cm3 (V1), 4.02±1.41cm3 (V2), and 17.52±4.44cm3 (V3) for males, and 1.58±0.25cm3 (V
1), 3.94±1.03cm3 (V2), and 17.80±2.73cm3 (V3) for females. Gender differences were only significant in V1 (p<0.05). After nasal decongestion, the volumes of all the analyzed segments were significantly larger (p<0.05), and the gender differences were significant for V1 and V2.
Conclusion: Volumes of the three segments in adults with no evidence of nasal obstruction may be used as reference values for other studies.
Keywords: nasal cavity, acoustic rhinometry, reference values. ORIGINAL ARTICLE
INTRODUCTION
Acoustic rhinometry analyzes the cross-sectional area and the volume of the nasal cavity based on reflected sound waves emitted from a source.3 The technique is used
to check nasal geometry, to identify altered patency, and to monitor the results of surgical procedures on nasal and nasopharyngeal airways.1-7
Hilberg e Pedersen8 underlined the importance
of creating cross-sectional and volume reference values in their recommendations to the European Rhinological Society on the use of acoustic rhinometry to analyze naso-respiratory function. Nasal volume values based on acoustic rhinometry in normal subjects have been pu-blished by various authors using different equipment to analyze nasal segments.1-4,9-15 Chart 1 summarizes the main
features raised in published papers and their main findin-gs. It is evident that few studies analyzed more than one nasal cavity segment,4,9,11,13 and only one paper11 assessed
nasopharyngeal volume.
This study aims to define reference values for the volume of three nasal cavity segments in adults with no evidence of nasal obstruction, by using acoustic rhino-metry. Our intention is to use this data in other studies of specific populations, such as patients with surgically corrected cleft palate, which are studied at the HRAC-USP physiology laboratory. Additionally, differences between nasal cavities, gender variations, and the effect of nasal vasoconstriction were also analyzed.
CASES AND METHODS
Cases
Thirty adult volunteers (14 male and 16 female) aged between 18 and 30 years, with no evidence of nasal obstruction, were studied. All signed a free and informed consent form. Fifty-four volunteers answered a question-naire based on the Kern model to investigate present and past signs and symptoms of nasal obstruction.16 Nasal patency to respiratory flow was measured with a Glatzel mirror placed under the nostrils. Based on this data, 24 subjects with a history of structural nasal anomalies and/or functional disorders, nasal trauma, recurring respiratory infection, regular use of nasal vasoconstrictors, oral bre-athing, or clearly reduced nasal air flow as shown by the Glatzel mirror (seen only in one patient), were excluded. Thus, with no formal sample size calculation, 30 subjects were included in this study.
The project was approved by the Research Ethics Committee of the Sao Paulo University Craniofacial Anomalies Rehabilitation Hospital, where the study was undertaken.
Equipment and technique
We used the Eccovision Acoustic Rhinometer
(HOOD Laboratories) system for rhinometric assessment. The technique measures reflected sound waves (echoes) in the nose. The equipment includes a source of sound waves (loudspeaker) mounted on the distal end of a 24-cm tube, and a microphone on the proximal end of the tube. The microphone detects, amplifies and digitizes pressure signals, which are fed into a computer running specific software that captures and analyzes the data (figure 1).
Figure 1 - Acoustic rhinometry: equipment used to check nasal
vo-lumes.
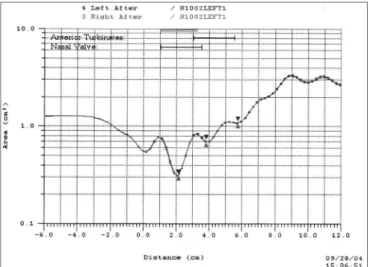
The exam proceeds as follows: the proximal end of the rhinometer tube, which is covered with a silicone nosepiece, is placed over one of the nostrils, at a 45-degree angle relative to the nasal floor. Care is taken to avoid deforming the nostril and to create an adequate acoustic seal between the nosepiece and the nostril, with help of a lubricating gel. A sound wave is emitted through the loudspeaker into the nose. Impedance variations caused by constrictions in the cavity under study reflect the sound wave back to the rhinometer tube, into the microphone. The distance from the constriction is calculated from the sound wave velocity and the time it takes for the echo to return. The cross-sectional nasal area is calculated from the echo intensity. Data are converted into an area-distance function which is presented on a chart, which is the rhino-gram (figure 2), showing the area (in square centimeters) on the vertical axis as a semi-logarithmic scale, and the distance on the horizontal axis. Volume is calculated from the integration of the area-distance curve. The rhinometer generates 10 sound pulses each 0.5 second and the softwa-re calculates the average of the ten softwa-repetitions to measusoftwa-re the cross-sectional area and the volume.
Procedure and variables
Chart 1 - Nasal volumes (V) reported in literature for adults with no evidence of nasal obstruction, before and after nasal vasoconstriction (VC).
Authors Equipment n Age
(years) Race Condition of patients
Nasal segment
V before VC*
(cm3)
V after VC*
(cm3) Grymer et
al. 19891
Experimental
equipment 21 22-48
not specified
no nasal complaints or significant septal
deformity V 0-7cm
27,15 [1,19]
Grymer et al. 19912
Experimental
equipment 82 18-40
not specified
subjective feeling of nasal patency and no evident structural change seen on rhinoscopy
V 0-7cm 22,60 [0,55] 31,00 [0,57]
Kesavana-than et al.
19959
Experimental
equipment 6 20-58
Asians and
Cauca-sians
healthy, non smokers, no history of rhinitis or use of medication that might affect the nasal mucosa
V 0-2,7cm 3,60 D
(1,00) 3,40 (1,20)
3,30 E
(1,10) 3,80 (1,20)
V 2,2- 7,9cm 13,90 D (5,50)
13,20 (6,70) 11,60 E
(5,60)
17,40 (5,90)
Morgan et al. 199510
Eccovision Hood Labo-ratories
(AR-1003)
20 33 (10) Cauca-sians
no evident structural anomalies, nasal polyps, no past surgery or nasal trauma, recurring upper airway infection, no regular use of nasal medication
V 0-4cm 4,70 (0,83) 5,59 (0,71)
Roithmann et al. 19953
Eccovision Hood Labo-ratories
(AR-1003)
51 ca- vi-ties
16-66 specifiednot
healthy volunteers, with no nasal com-plaints, no significant functional or struc-tural nasal obstruction
V 0-8cm 12,14 [0,30]
15,02 [0,30]
Roithmann et al. 19974
Eccovision Hood Labo-ratories
(AR-1003)
66 16-58 specifiednot
no nasal complaints, no significant functional or structural obstruction or low nasal resistance
V 0-4cm 3,73 4,23
V 4-8cm 7,05 10,18
Tomkinson & Eccles
199811
AR A1 GM
Instruments 48 18-59
not specified
no history of nasal diseases; normal
anatomy on rhinoscopy V 0-11cm 3,44 (0,96) 4,02 (1,18)
V 11-14cm 6,99 (2,88) 8,22 (3,15)
V 14-17cm 12,56 (5,40) 14,01 (5,82)
Corey et al. 199812
Two micro-phone AR Hood Labo-ratories
53 18-57 Cauca-sians
no obvious nasal deformities, septal deviation, past trauma, nasal surgery, history of allergic rhinitis, nasal polyps, breathing difficulties, use of nasal me-dication, recent or recurring respiratory infection, or other significant health problems
V 0-6cm 8,25 (3,23) (4,40)11,90
Kunkel et al. 199913
Rhinoklak-1000 15 adultos not specified
subjective feeling of normal nasal
pa-tency V 0-2,3cm 4,00 [0,60] 3,60 [0,80]
V 2,3-4,6cm 5,70 [1,40] 8,10 [1,60]
V 4,6-7cm 8,90 [2,60]
11,10 [2,60]
specifically for this end (figure 1), to immobilize the head in an axial plane parallel to the ground for rhinometric exams. During data acquisition subjects were asked to hold their breaths at the end of expiration while at rest. Data for three rhinometric curves were collected for each nostril before and 10 minutes after application of 5 drops of a topical nasal vasoconstrictor (xylometazoline chloridrate 0.1%) in each nostril following nasal hygiene, with the subject’s head reclined backwards. Rhinograms with irregular tracings or discrepant measurements due to swallowing, head movements or inadequate sealing of the nostrils were discarded. Values considered for analysis were an average of three measurements taken from three technically acceptable curves.
Volume measurements were taken in the following nasal cavity segments: the volume of the segment loca-ted from 10 to 32 mm from the nostril corresponding to the nasal valve region (V1), the volume of the segment located between 33 and 64 mm from the nostril, corres-ponding to the turbinate region (V2), and the volume of
the segment located between 70 and 120mm from the nostril, corresponding to the nasopharyngeal region (V3), as recommended in Antilla et al’s6 study.
Data analysis
Volume is expressed in cubic centimeters and results for each group are presented as an average ± standard de-viation. Student’s t test was used to analyze the significance between independent samples (male x female). Student’s t test for paired samples was used to analyze the significan-ce of the differensignifican-ce between related samples (right x left nasal cavity, before and after the vasoconstrictor). Values of p<0.05 were considered significant.
RESULTS
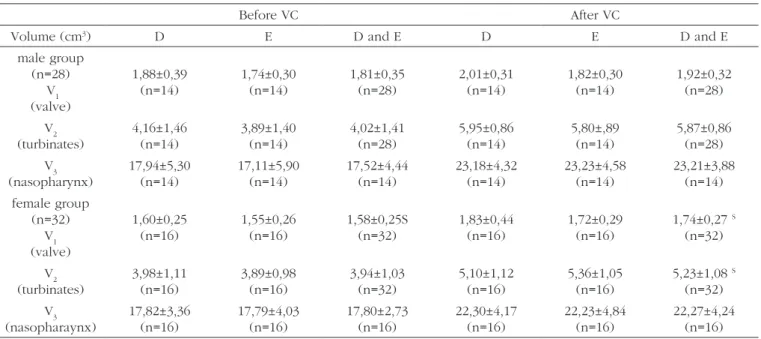
Table 1 shows the average volumes (V1, V2 and V3) of the 30 right nasal cavities (D) and the 30 left nasal ca-vities (E) of the 30 subjects according to gender, obtained before and after the nasal vasoconstrictor (VC). Statistical analysis revealed no significant difference between right and left measurements in both study groups. Therefore, for simplicity, right and left nasal cavities were considered independent cavities in V1 and V2. Table 1 also shows the average values of 60 right and left measurements (28 male and 32 female). For V3, values obtained from the right and left nasal cavities were not consolidated, as they are measurements of a single cavity obtained from different sides of the nasal cavity. We chose to calculate the right and left average, which resulted in 30 measurements (14 male and 16 female).
We found that the average right and left nasal volume (V1 and V2) in the female group was lowe than the corresponding volume in the male group, before and after using the vasoconstrictor. However, statistical analysis demonstrated that the differences weer significant only for V1 values before and after vasoconstrictor use, and significant for V2 volumes only after vasoconstrictor use.
Silkoff et al. 199914
Eccovision Hood Labo-ratories
(AR-1003)
6 32-48 not
specified no nasal symptoms V 0-5cm
5,72 D# (0,27)
5,60 E# (0,31)
Sung et al. 200015
Rhinoklak-RK 1000 20
24,7
(avera-ge)
not
specified no septal deviation or rhinopathy V 0-7cm
12,98 D (2,27)
12,51 E (1,76)
* average (standard deviation) or average [standard error] D: right nasal cavity; E: left nasal cavity
# average values calculated from published individual value
Figure 2 - Rhinogram.
Table 1 - Nasal volumes (V1, V2 and V3) established by acoustic rhinometry in 60 nasal cavities from 30 adults with no evidence of nasal obs-truction, according to gender and nasal cavity (right-D and left-E), before and after applying nasal vasoconstriction (VC).
Before VC After VC
Volume (cm3) D E D and E D E D and E
male group (n=28)
V1 (valve)
1,88±0,39 (n=14)
1,74±0,30 (n=14)
1,81±0,35 (n=28)
2,01±0,31 (n=14)
1,82±0,30 (n=14)
1,92±0,32 (n=28)
V2 (turbinates)
4,16±1,46 (n=14)
3,89±1,40 (n=14)
4,02±1,41 (n=28)
5,95±0,86 (n=14)
5,80±,89 (n=14)
5,87±0,86 (n=28) V3
(nasopharynx)
17,94±5,30 (n=14)
17,11±5,90 (n=14)
17,52±4,44 (n=14)
23,18±4,32 (n=14)
23,23±4,58 (n=14)
23,21±3,88 (n=14) female group
(n=32) V1 (valve)
1,60±0,25 (n=16)
1,55±0,26 (n=16)
1,58±0,25S (n=32)
1,83±0,44 (n=16)
1,72±0,29 (n=16)
1,74±0,27 S
(n=32)
V2 (turbinates)
3,98±1,11 (n=16)
3,89±0,98 (n=16)
3,94±1,03 (n=32)
5,10±1,12 (n=16)
5,36±1,05 (n=16)
5,23±1,08 S
(n=32) V3
(nasopharaynx)
17,82±3,36 (n=16)
17,79±4,03 (n=16)
17,80±2,73 (n=16)
22,30±4,17 (n=16)
22,23±4,84 (n=16)
22,27±4,24 (n=16)
average ± standard deviation n= number of nasal cavities analyzed
S p<0.05 statistically significant difference (male vs. female for D and E
Table 2 - Nasal volumes (V1, V2 and V3) established by acoustic rhinometry in 60 nasal cavities from 30 male and female adults with no
eviden-ce of nasal obstruction, according to gender and nasal cavity (right-D and left-E), before and after applying nasal vasoconstriction (VC).
Volume (cm3) Before VC After VC Percentage variation
V1 (valve) 1,68±0,32
(n=60)
1,82±0,30 S
(n=60) 8%
V2 (turbinates) 3,98±1,21(n=60) 5,53±1,03 S(n=60) 39%
V3 (nasopharynx) 17,67±3,57(n=30) 22,72±4,06 S(n=30) 29%
average ± standard deviation n = number of nasal cavities analyzed
S p<0.05: statistically significant difference (before vs. after VC)
The nasopharyngeal volume (V3) did not differ significantly between males and females.
Male and female data were consolidated to study the effect of vasoconstriction on nasal volume. Averages for the whole group and percentage variations due to the vasoconstrictor are presented on Table 2. Statistical analy-sis revealed that values obtained after the vasoconstricto were significantly higher compared to pre-vasoconstric-tion volumes in all three nasal segments. V2 (39%) and V3 (24%) variations were more pronounced than V1 (08%) variations.
DISCUSSION
This study aimed to define reference volumes for specific segments of the nasal cavity in adults. As men-tioned above, initially 54 apparently healthy subjects were selected, from which a sample of 30 subjects with a subjective feeling of normal nasal patency were chosen, a criterion also adopted by other authors.5,9,14,19-21 These
the study - due to evidence of nasal disorders - showed that the volume and area of segments V1 and V2 were significantly lower in this group than in those groups with no complaints. We were also able to find that measure-ment variability, expressed by the standard deviation, was comparable to that reported by Corey et al12 for normal
subjects, which have a more homogeneous profile than individuals with variable degrees of nasal obstruction.
We also underline that only young adults with no evident African or Asian physical traits were selected; nasal cavity dimensions depend not only on age but also on race.8,10,12 Also, our analysis of 30 patients in fact
corres-ponded to measurements from 60 nasal cavities, which is a significant number for the aims of this study.
Our critical analysis is based on Hilberg and Pedersen’s8 recommendations. There are many causes of errors in measuring the internal nasal dimensions using acoustic rhinometry, as shown by various authors.8,17-19,22
These include ambient temperature variations and external noise that can reduce the accuracy and reproducibility of the technique. These variables were not controlled for in our study; however, measurements were done always in the same room, which had a relatively stable temperature and a maximum noise level of 60dB. Before each exam, subjects answered the questionnaire and were instructed about the procedure; this stage took about 30 minutes, enough time for adaptation to the environment.
Other causes of errors according to Hilberg and Pedersen8 are changes in the position of the rhinometer
and sound loss due to maladjustment of the nasal adaptor and the nostril. We were careful to uniformly place the tube always parallel to the dorsum of the nose. Neutral electrocardiogram gel was used between the nasal adap-tor and the nostril to assure adequate sealing, as recom-mended in literature. Due care was also taken to avoid deforming the nostril and consequently, the nasal valve. The Eccovision Acoustic Rhinometer has an adaptor that only touches the nostril and is not introduced into the nasal vestibule (as was the case with older olive-shaped models), which in itself avoids deformation of the nasal valve. Spectacles were also removed to avoid external pressure on the nose.
Additional care was taken to maintain the head in a stable position during rhinometry. A special frame was developed to support the chin and the forehead so that measurements could be done with the head in a stable position and parallel to the ground. These last recommen-dations do not appear in Hilberg and Pedersen8 paper, however, other studies18,22 have stated that postural
chan-ges interfere on measurements, and sugchan-gest controlling the head position, with which we agree. Similarly, breathing and swallowing were also mentioned as factors that may interfere with rhinogram measurements and quality.18,22
Subject were thus asked to close their mouths, to hold their
breaths, and not to swallow or move their tongue during data acquisition (which takes only a few seconds).
On the whole these strategies were used to increase the consistency of results and to reduce as much as possi-ble those factors that could interfere on the measurements. Additionally, calibration of the equipment was done at the beginning of each period for each day, curves with irregularities were discarded, and those values used for analysis were calculated from the average of three techni-cally acceptable curves. Having used these procedures in the past in our laboratory, we were able to obtain variation coefficients between 6% and 8% in our rhinometric volume measurements.23
With this background, we analyze and compare our results with published papers. This comparison is somewhat limited due to the fact that many authors who assessed nasal volumes in subjects with no evidence of nasal obstruction1-4,6,9-12,14,15 studied different segments
from those used by Antila et al,6 on which our study is
based, or else reported bilateral measurements.13 On the
other hand, Antila et al6 analyzed patients with evidence
of nasopharyngeal obstruction, complaints of snoring and sleep apnea, which also compromises a comparison. Ne-vertheless, Antila et al6 obtained similar average results for V1 (2.03±0.48 for the right side, and 2.04±0.53 for the left side) and V2 (3.49±1.20 for the right side, and 3.40±1.05 for the left side), corroborating our findings. The average value for V3 (9.47±3.13 for the right side, and 9.11±3.34 for the left side) was markedly lower, which may be explained by the diseases the subjects presented.
The utility of measurements in those segments we assessed has to be discussed; V1 corresponds to the nasal valve region (1.0 to 3.2cm from the nostril), V2 is the region of the turbinates (3.3 to 6.4cm), and V3 is the nasopharynx (7 to 12cm). As seen on chart 1, points and segments chosen for analysis are not uniform in published papers. Some authors combined segments and others chose different regions. We believe that segmentation of measurements into nasal valve region, turbinate region and nasopharynx, as proposed by Antila,6 is the preferred option to meet the aims of our study.
There was a tendency for women to have lower volumes than men, different from what is stated in Grymer et al’s2 paper, who reported the opposite situation for volumes calculated between 0-7cm before nasal vasocons-triction. Although we found a statistical significance for these measurement differences only in anterior nasal cavity regions (V1 before and V1 and V2 after nasal vasoconstric-tion) we suggest using male and female nasal volumes separately, as reference values. This does not apply to the nasopharynx, where there was no gender difference.
analysis revealed that values obtained after nasal vaso-constriction were significantly higher. The decongestion effect was more evident in V2, meaning that the region of the turbinates reacted most to vasoconstriction, confirming past results.2-4,10-12
Finally, we emphasize that data on nasopharyngeal volumes should be analyzed with care, as other studies have shown that systematic or random errors may be introduced in measurements done in the posterior region of the nasal cavity. This may be due, for instance, to ma-rked anterior vasoconstriction resulting in underestimated values, or sound reflection to the contralateral cavity or the paranasal sinuses, or changes in the tonus of the pha-ryngeal muscles and involuntary movement of the soft palate during the exam.3,24-28 Furthermore, a recent study
on normal subjects29 compared measurements done by
acoustic rhinometry and computed tomography, which is considered a gold standard, and showed a good correlation (r=0.839) between both methods for assessments made up to an average distance of 6cm from the nostrils. Beyond this point, the correlation is reduced (r=0.419), showing that acoustic rhinometry systematically underestimates true measurements. Based on these findings, we concluded that acoustic rhinometry, compared to computed tomography, provides accurate measurements up to the turbinates, with lower accuracy in posterior regions. Evidence also shows that these technical limitations do not invalidate the clinical usefulness of this method for posterior regions of the nasal cavity. The method may be employed in com-parisons in the same subject, such as when investigating relative volume variations caused by velar movement in silent speech,30-32 or to analyze variations caused by
sur-gery (tonsillectomies,33,34 septoplasty/turbinectomy1,35,36, or
maxillomandubilar osteotomy37,38), taking into account that
systematic errors are common, that random errors may be minimized, and that measurements are reproducible in the same subject.29
CONCLUSION
The different volumes verified in this study are representative of internal nasal dimensions in adults with no nasal obstruction, and may be taken as reference va-lues for comparative studies involving populations with various nasal diseases.
REFERENCES
1. Grymer LF, Hilberg O, Elbrond O, Pedersen OF. Acoustic rhinometry: evaluation of the nasal cavity with septal deviations, before and after septoplasty. Laryngoscope 1989;99:1180-7.
2. Grymer LF, Hilberg O, Pedersen OF, Rasmussen TR. Acoustic rhi-nometry: values from adults with subjective normal nasal patency. Rhinology 1991;29:35-47.
3. Roithmann R, Cole P, Chapnik J, Shpirer I, Hoffstein V, Zamel N. Acoustic rhinometry in the evaluation of nasal obstruction. Laryn-goscope 1995;105(3):275-81.
4. Roithmann R, Chapnik J, Zamel N, Barreto SM, Cole P. Acoustic rhi-nometric assessment of the nasal valve. Am J Rhinol 1997;11(5):379-85.
5. Kunkel M, Wahlmann U, Wagner W. Nasal airway in cleft-palate patients: acoustic rhinometric data. J Cranio-Max Fac Surg 1997;25:270-4.
6. Antila J, Sipilä J, Tshushima Y, Polo O, Laurikainen E, Suonpää J. The effect of laser-uvulopalatopharyngoplasty on the nasal and nasopharyngeal volume measured with acoustic rhinometry. Acta Otolaryngol 1997;529 Suppl:202-5.
7. Zancanella E, Anselmo-Lima WT. Uso da rinometria acústica como método diagnóstico. Rev Bras Otorrinolaringol 2004;70(4):500-3. 8. Hilberg O, Pedersen OF. Acoustic rhinometry: recommendations for
technical specifications and standard operating procedures. Rhinol Suppl 2000;16:3-17.
9. Kesavanathan J, Swift DL, Bascom R. Nasal pressure-volume rela-tionship determined with acoustic rhinometry. J Appl Physiol 1995, 79(2):547-53.
10. Morgan NJ, MacGregor FB, Birchall MA, Lund VJ, Sittampalam Y. Racial differences in nasal fossa dimensions determined by acoustic rhinometry. Rhinology 1995;33:224-8.
11. Tomkinson A, Eccles R. Acoustic rhinometry: an explanation of some common artifacts associated with nasal decongestion. Clin Otolaryn-gol 1998;23:20-6.
12. Corey JP, Gungor A, Nelson R, Liu X, Fredberg J. Normative standar-ds for nasal cross-sectional areas by race as measured by acoustic rhinometry. Otolaryngol Head Neck Surg 1998;119(4):389-93. 13. Kunkel M, Wahhlmann U, Wagner W. Acoustic airway profiles in
unilateral cleft palate patients. Cleft Palate Craniofac J 1999;36(5):434-40.
14. Silkoff PE, Chakravorty S, Chapnik J, Cole P, Zamel N. Reproducibility of acoustic rhinometry and rhinomanometry in normal subjects. Am J Rhinol 1999;13(2):131-5.
15. Sung Y, Lee M, Kim I, Lim D, Rha K, Park C. Nasal cycle in patients with septal deviation: evaluation by acoustic rhinometry. Am J Rhinol 2000;14(3):171-4.
16. Kern EB. Use of a questionnaire for patients with nasal symptoms. Rhinology 1972;10:133-7.
17. Lai VWS, and Corey JP. The objective assessment of nasal patency. Ear Nose Throat J 1993;72:395-400.
18. Tomkinson A, and Eccles R. Acoustic rhinometry: do we need a standardized operating procedure? Clin Otolaryngol 1996;21:284-7. 19. Hamilton JW, McRae RDR, Jones AS. The magnitude of random errors
in acoustic rhinometry and re-interpretation of the acoustic profile. Clin Otolaryngol 1997;22:408-13.
20. Millqvist E, and Bende M. Reference values for acoustic rhinometry in subjects without nasal symptoms. Am J Rhinol 1998;12:341-343. 21. Larsson C, Millqvist E, Bende M. Relationship between subjective
nasal stuffiness and nasal patency measured by acoustic rhinometry. Am J Rhinol 2001;15(6):403-5.
22. Parvez L, Erasala G, Noronha A. Novel techniques, standardization tools to enhance reliability of acoustic rhinometry measurements. Rhinol Suppl 2000;16:18-28.
23. Garbino JF, Gomes AOC, Sampaio ACM, Lauris JRP, Trindade IEK. A rinometria acústica como método de aferição da geometria nasal: reprodutibilidade das medidas de volume. Anais do V Encontro Científico de Pós-Graduação do HRAC-USP, 21-23 nov;Bauru, Brasil. p.29, 2003.
24. Jackson AC, Butler JP, Millet EJ, Hoppin Junior FG, Dawson SV. Ai-rway geometry by analysis of acoustic pulse response measurements. J Appl Physiol 1977;43:523-36.
25. Hilberg O, Jackson AC, Swift DL, Pedersen OF. Acoustic rhinometry: evaluation of nasal cavity geometry by acoustic reflection. J Appl Physiol 1989;66:295-303.
26. Kunkel M, Hochban W. Acoustic rhinometry: rationale and perspec-tives. J Cranio-Max-Fac Surg 1994;22:244-9.
Surg 1994;23:409-12.
28. Fisher EW, Morris DP, Biemans CR, Palmer CR, Lund VJ. Practical aspects of acoustic rhinometry: problems and solutions. Rhinology 1995;33: 219-23
29. Terheyden H, Maune S, Mertens J, Hilberg O. Acoustic rhinometry: validation by three dimensionally reconstructed computer tomogra-phic scans. J Appl Physiol 2000;89: 1013-21.
30. Seaver EJ, Karnell MP, Gasparaitis A, Corey J. Acoustic rhinometric measurements of changes in velar positioning. Cleft Palate Craniofac 1995;32:49-54.
31. Gomes AOC. Dimensões Nasais e Nasofaríngeas de Indivíduos sem Evidência de Obstrução Nasal Avaliadas por Rinometria Acústica no Repouso e na Fala. 2004. Dissertação (Mestrado) - Hospital de Reabilitação de Anomalias Craniofaciais, Universidade de São Paulo, Bauru.
32. Kunkel M, Wahlmann U, Wagner W. Objective evaluation of velopha-ryngeal function by acoustic reflection measurements. Mund Kiefer Gesichtschir 1998;2(Suppl 1):158-62.
33. Elbrond O, Hilberg O, Felding JU, Blegvad-Andersen O. Acoustic rhinometry, used as a method to demonstrate changes in the vo-lume of the nasopharynx after adenoidectomy. Clin. Otolaryngol 1991;16:84-6.
34. Kim YK, Kang JH, Yoon KS. Acoustic rhinometric evaluation of nasal cavity and nasopharynx after adenoidectomy and tonsillectomy. Int J Pediatr Otorhinolaryngol 1998;44:215-220.
35. Pirilä T, Tikanto J. Unilateral and bilateral effects of nasal septum surgery demonstrated with acoustic rhinometry, rhinomanometry, and subjective assessment. Am J Rhinol 2001;15:127-33.
36. Voegels RL, Goto EY, Lessa MM, Romano FR, Neves MC, Tavares R, Mello Jr JF. Avaliação pré e pós-operatória por rinometria acústica de pacientes submetidos à cirurgia de septo nasal e conchas inferiores. Arq Otorrinolaringol 2002;6:169-73.
37. Kunkel M, Hochban W. The influence of maxillary osteotomy on nasal airway patency and geometry. Mund Kiefer Gesichtschir 1997;1:194-8.