ZONATION OF BENTHIC MACROFAUNA ON CASSINO BEACH,
SOUTHERNMOST BRAZIL
Luciano Peyrer das Neves*, Pedro de Sá Rodrigues da Silva and Carlos Emílio Bemvenuti
Fundação Universidade Federal do Rio Grande - FURG
Departamento de Oceanografia, Laboratório de Ecologia de Invertebrados Bentônicos (Av. Itália Km 8, Caixa Postal 474, 96201-900 Rio Grande, RS, Brasil)
*Address for author: [email protected]
(Rua Aduana, 26, Ipiranga, 04279-040 São Paulo, SP, Brasil)
ABSTRACT
Benthic macrofauna zonation was studied for one year (June 2004 to May 2005) with monthly sampling on Cassino Beach, Rio Grande do Sul, Brazil. Three sites (spaced 50 m apart) were selected. Three transects were anchored at each site, spaced equidistantly 2 m apart. Each transect extended from the base of the primary dunes to the inner surf zone at approximately 1m in depth, with between 7 and 8 sampling levels. Monthly, with a 20 cm diameter core, one biological sample was collected per transect at each level, a total of nine samples per level.Within transects, the distance between the levels was 20 m until the upper swash zone, from which the distance was 10 m until the 1-meter isobath. Zonation proved to be variable throughout the year. Variability was mainly a reflection of the greater instability of the lower part of the beach, which comprised the lower mesolittoral zone and the inner surf zone. This was evidenced seasonally with the formation of distinct groups of fauna in accordance with the peculiarity of each season of the year. The formation of these groups was strongly influenced by fluctuations in densities stemming from recruitments and the migration of juvenile and adult infauna, as well as superimposing of the distribution of organisms as a result of rises in sea level due to storms.
RESUMO
A zonação da macrofauna bentônica na praia do Cassino, Rio Grande do Sul, Brasil, foi estudada durante um ano (junho 2004 a maio de 2005) com base em coletas mensais. Para isso escolheu-se 3 locais, com 50 m de distância um do outro, sendo que em cada local foram fundeadas 3 transversais 2 m eqüidistantes. Cada transversal se estendeu desde a base das dunas primárias até aproximadamente 1m de profundidade no infralitoral, sendo 7 a 8 níveis de coleta distribuídos em cada uma das transversais.Mensalmente, utilizando-se um tubo extrator de 20 cm de diâmetro, coletou-se uma amostra biológica por transversal em cada nível, totalizando nove amostras por nível. A distância dos níveis de coleta em cada transversal foi de 20 m até o limite superior da zona de varrido, a partir da qual a distância foi de 10 m. A zonação mostrou-se variável ao longo do ano, sendo que esta variabilidade refletiu, principalmente, a maior instabilidade da zona inferior da praia, que compreendeu o mesolitoral inferior e a zona de arrebentação interna. Isto ficou evidenciado sazonalmente, com a formação de distintos grupos faunísticos de acordo com a peculiaridade de cada estação do ano. A formação destes grupos foi fortemente influenciada pelas flutuações das densidades, decorrentes dos recrutamentos e migrações de juvenis e adultos da infauna, e da sobreposição da distribuição dos organismos, em função da elevação do nível da água devido às ressacas.
Descriptors: Sandy beaches; Benthic macrofauna; Zonation; Cassino Beach.
Descritores: Praias arenosas; Macrofauna bentônica; Zonação; Praia do Cassino.
INTRODUCTION
Beaches are dynamic environments where elements such as wind, water and sand interact, resulting in complex hydrodynamic and depositional processes (BROWN; MCLACHLAN, 1990). The peculiar demands or tolerations of each species to different ecological factors result in a vertical distribution of organisms in characteristic zones, which is known as zonation.
Despite the difficulty in identifying zonation on sandy beaches, some schemes have been proposed. Based on the distribution of crustaceans, Dahl (1952) proposed a universal division into three zones. Salvat (1964) proposed a zonation scheme that divides
beaches into four zones (dry sand, retention,
It has been verified that the zonation pattern of macrofauna changes according to the type of beach, and the number of zones increases from reflective beaches to dissipative beaches (DEFEO et al., 1992a; JARAMILLO et al., 1993).
An analysis of macrofauna in the mesolittoral zone of 15 beaches in the state of Rio de Janeiro (Brazil) indicated more than one zonation scheme. There was the recognition of two or three biological zones, and reflective beaches presented a more stable pattern of two zones (VELOSO et al., 2003).
In a study carried out on a sandy beach in the state of Paraná (Brazil), a persistent pattern of four fauna zones was recorded throughout the year (SOUZA; GIANUCA, 1995). Also in Paraná, a study analyzing the influence of morphodynamics on the benthic community of 10 beaches recognized 4 fauna zones following the scheme proposed by Salvat (1964) (BORZONE et al., 1996). Borzone and Souza (1997) verified that macrofauna zonation adjusted to the Salvat (1964) scheme, but evidenced temporal variations in zonation patterns, which were more related to the stability of the sediment than tide levels. Based on data from six beaches, Barros et al. (2001) demonstrated that the macrofauna zonation pattern was better adjusted to the Salvat (1964) scheme, with a small difference between the winter and summer results.
The Uruguayan coast on the border of the state of Rio Grande do Sul (Brazil) biogeographically constitutes what is known as the Riogrande-Uruguayan Sector, due to the similarity in the fauna composition of sandy beaches (ESCOFET et al., 1979). A one-year accompaniment of macrofauna zonation at Barra del Chuy (Uruguay) indicated the existence of three zones between the supralittoral zone and the lower levels of the swash zone (BRAZEIRO; DEFEO, 1996). However, the authors identified an important variation in the zonation of organisms throughout the seasons of the year, which reinforces the need for temporal follow-ups of the benthic macrofauna in the Riogrande-Uruguayan Sector.
On the northern coast of the state of Rio Grande do Sul (Brazil), daily accompaniment (for five days) of benthic macrofauna zonation between the mid mesolittoral zone and the beginning of the surf zone on three sandy beaches, distinguished only two fauna zones (NEVES; BEMVENUTI, 2006). Despite work carried out regarding the composition and distribution of benthic macrofauna on beaches along the southern coast of Rio Grande do Sul (GIANUCA, 1983, 1987; BORZONE; GIANUCA, 1990), there is a lack of approaches regarding quantitative sampling with replication between the supralittoral zone and the lower bounds of the swash zone. The aim of the present study was to determine the vertical distribution
of benthic macrofauna during the four seasons of the year on a sandy beach on the southern coast of Rio Grande do Sul.
MATERIALS AND METHODS
Study AreaThe sandy beaches of southernmost Brazil are exposed, with a slight decline, fine sand, moderate to strong wave action and well-developed surf zone, presenting dissipative to intermediate morphodynamic states (GIANUCA, 1988; GARCIA; GIANUCA, 1998; BORZONE; GIANUCA, 1990). The astronomical tides are insignificant, and meteorological factors are the main cause of variations in water level (CALLIARI; KLEIN, 1993).
Cassino Beach, Rio Grande (RS) presents dissipative characteristics in the area near the jetties of Barra de Rio Grande, whereas 17.2 km southwards of the western jetty (052º 14’ 040 W and 32º 15’ 554 S) (Fig. 1), intermediate characteristics were observed (CALLIARI; KLEIN, 1993; PEREIRA, 2005).
For the zonation denomination, the nomenclature proposed by Gianuca (1998) for Cassino beach was used. The supralittoral level is a zone under the effect of sea spray, which is only inundated by the ocean during extreme events, such as tides of storms. The mesolittoral corresponds to the zone inundated by the tides, with the swash zone in its lower bounds, which is subjected to the swash and backwash of waves. The upper bounds of the infralittoral was denominated the inner surf zone, which is characterized by shallow sandy bottoms and turbulent between the lower swash zone and approximately 2 m in depth.
Sampling
The sampling of benthic macrofauna was performed monthly for a period of 12 months (June 2004 to May 2005). Three sites were selected at a distance of 50 m from each other. At each site, 3 transects were demarked, 2 m equidistant from one another. Each transect extended from the base of the primary dunes to the inner surf zone at approximately 1 m depth, with between 7 and 8 collection levels. Monthly one biological sample was collected per transect at each level, a total of nine samples per level. Within transects, the distance between the levels was 20 m until the upper swash zone, from which distance was 10 m until the 1-meter isobath (Fig. 1). The smaller distance between levels on the lower parts of the beach was due to the greater number of species and organisms that tend to concentrate in this area (GIANUCA, 1983).
Fig. 1. Location of study area and sampling design from which the benthic macrofauna was collected.
macrofauna abundance is found in the first 15-20 cm of depth in the sediment (BALLY, 1983). Samples were sieved with a nylon mesh with a 0.5 mm pore opening, and the material collected was fixed in a 10 % formaldehyde solution. In the laboratory, organisms were quantified and identified to the smallest possible taxonomic level under a stereoscopic microscope.
A monthly quantification was also performed on the number of Ghost Crab burrows (Ocypode quadrata), which were mainly located in the supralittoral zone. The method utilized to quantify the density of O. quadrata through the number of burrows was also used by Neves and Bemvenuti (2006) and Alberto and Fontoura (1999) in works carried out on
the coast of the state of Rio Grande do Sul. Starting from the bases of the primary dunes, 100 m lines parallel to the beach were established. These lines were anchored in the area of occurrence of the O. quadrata burrows at a distance of 5 m from one another. Through the continuous arrangement of 1x1m grid, the density of burrows along each line was recorded.
Regarding the bivalve Mesodesma
according to the procedure proposed by Masello and Defeo (1986) and Defeo et al. (1992b). Recruits, juveniles and adults of the bivalve Donax hanleyanus were defined respectively as organisms of 1-5 mm, 5.5-15 mm and >15 mm in length, following Defeo and de Alava (1995).
For the analysis of the spatial variation of the benthic macrofauna, samples pertaining to each level at each site were totaled on a monthly basis.
Environmental Data
Seasonal sediment samples were taken at each of the levels of the 3 sites. The grain size analysis of sediment were performed through the proportions of sand, silt and clay in the sediment were determined through sieving (> 0.062 mm in diameter) and pipetting (< 0.062 mm in diameter), following procedures described by Suguio (1973). During the monthly sampling, wave height (visual observations), average wave period (digital chronometer) and salinity (optical refractometer) were recorded, along with air and water temperatures Using a fixed reference, the monthly topographic profile of the beach was obtained for the central transversal at Site 2. For such, a dumpy level was used. Hourly data on wind speed and direction were provided by the Barra de Rio Grande Pilotage Authority.
To characterize the seasonal morphodynamics state of the beach, the Dean’s
dimensionless parameter (Ω=Hb/Ws.T) was
employed, where Hb is the wave height of the surf, Ws is the rate of sediment decantation and T is the wave period. The Ω values less than 1 represent reflective beaches; intermediate beaches are classified within the 1 to 6 interval; and dissipative beaches present Ω values greater than 6 (SHORT; WRIGHT, 1983).
Statistical Analyses
In order to analyze the zonation and possible variations of the benthic macrofauna distribution throughout the year, statistical analyses were performed on the PRIMER v5 program (Plymouth Routines in Multi Ecological Research) using quantitative data (CLARKE; WARWICK, 1994). For the multivariate analyses, the sum of the samples of each level, for site, was used to draw up a similarity spreadsheet (Q mode) using the Bray-Curtis dissimilarity index. The spring and summer data and the annual total were transformed into √√ due to the considerable difference in the density of individuals (CLARKE; GREEN, 1988). Multi-Dimensional Scaling (MDS) analysis was then performed to find the groups. This analysis is considered the most robust to verify the benthic macrofauna zonation on sandy beaches (KENKEL; ORLOCI, 1986; RAFFAELLI et al., 1991). The difference between groups was tested through the analysis of similarity (ANOSIM), at a
significance level of p<5% and R statistic > 0.5. Similarity percentage analysis (SIMPER) was used for the determination of dissimilarity between the groups formed and to verify the contribution of the principal species in the groups formation. Levels 1 and 2 (supralittoral) were not considered in the multivariate analyses, as they presented only benthic macro-invertebrates originating from the stranding, i.e. organisms that were flung to these levels by storms. The vast majority of them were dead at the time of sampling.
The Shannon-Weaver diversity index (H’) and the Peilou evenness index (J') were also determined for each level.
RESULTS
Environmental VariablesMinimum salinity was recorded during the July sampling (29 ‰) and maximums in January (36 ‰) and March (36 ‰). Water temperature of the inner surf zone followed the same tendency as air temperature, with minimums recorded in July (water = 14ºC and air = 15ºC) and May (water = 13.5ºC and air = 15ºC), and the maximum in January (water = 26ºC and air = 30ºC). Wave height presented higher values in November (1.5 m) and July (1 m), whereas the average wave period ranged from 8 to 11.9 sec. Average declivity of the beach was 1.7º throughout the sampling period.
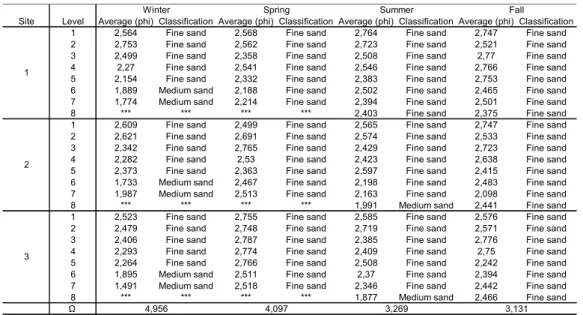
From the Ω values, it was determined that the beach studied presented an intermediate stage throughout the four seasons of the year (Table 1). The sediment type for most of the area was classified as fine sand, but on some occasions medium sand predominated on the lower part of the beach (Table 1). The beach presented constant erosion and accretion throughout the year, but the profiles that composed the summer were more stable (Fig. 2).
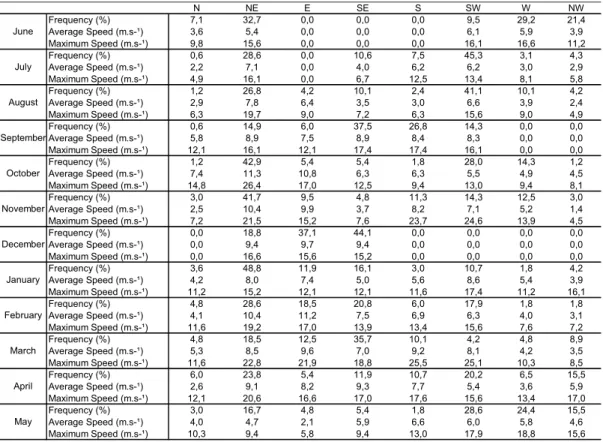
During the 7 days prior to sampling of the benthic macrofauna, NE wind was the most frequent, with a maximum velocity of 26.4 m.s-1 in October.
The SW wind was more frequent in periods of lower temperature, but its maximum velocity of 25.1 m.s-1
occurred in March (Table 2).
Benthic Macrofauna
A total of 18 taxa were collected in winter (June, July and August). Crustacea was the most diverse, followed by polychaeta, which also occurred in the other seasons. At Level 4, there was a greater average index of diversity (H’=1.29) and greater average density of macrofauna, but the highest number of taxa occurred at Level 6 (Table 3).
Table 1. Average grain size (phi), sediment classification and seasonal value of Ω.
Fig. 2. Profiles of the beach between July 2004 and May 2005, grouped according to the months that make up each season of the year.
-1 -0,5 0 0,5 1 1,5 2 2,5 3
0 25 50 75 100 125 150 175
m
m
July August
-1,5 -1 -0,5 0 0,5 1 1,5 2 2,5 3
0 25 50 75 100 125 150 175
m
m
March April May -1
-0,5 0 0,5 1 1,5 2 2,5 3
0 25 50 75 100 125 150 175
m
m
September October November
-1,5 -1 -0,5 0 0,5 1 1,5 2 2,5 3
0 25 50 75 100 125 150 175
m
m
December January February
Site Level Average (phi) Classification Average (phi) Classification Average (phi) Classification Average (phi) Classification
1 2,564 Fine sand 2,568 Fine sand 2,764 Fine sand 2,747 Fine sand
2 2,753 Fine sand 2,562 Fine sand 2,723 Fine sand 2,521 Fine sand
3 2,499 Fine sand 2,358 Fine sand 2,508 Fine sand 2,77 Fine sand
4 2,27 Fine sand 2,541 Fine sand 2,546 Fine sand 2,766 Fine sand
5 2,154 Fine sand 2,332 Fine sand 2,383 Fine sand 2,753 Fine sand
6 1,889 Medium sand 2,188 Fine sand 2,502 Fine sand 2,465 Fine sand
7 1,774 Medium sand 2,214 Fine sand 2,394 Fine sand 2,501 Fine sand
8 *** *** *** *** 2,403 Fine sand 2,375 Fine sand
1 2,609 Fine sand 2,499 Fine sand 2,565 Fine sand 2,747 Fine sand
2 2,621 Fine sand 2,691 Fine sand 2,574 Fine sand 2,533 Fine sand
3 2,342 Fine sand 2,765 Fine sand 2,429 Fine sand 2,723 Fine sand
4 2,282 Fine sand 2,53 Fine sand 2,423 Fine sand 2,638 Fine sand
5 2,373 Fine sand 2,363 Fine sand 2,597 Fine sand 2,415 Fine sand
6 1,733 Medium sand 2,467 Fine sand 2,198 Fine sand 2,483 Fine sand
7 1,987 Medium sand 2,513 Fine sand 2,163 Fine sand 2,098 Fine sand
8 *** *** *** *** 1,991 Medium sand 2,441 Fine sand
1 2,523 Fine sand 2,755 Fine sand 2,585 Fine sand 2,576 Fine sand
2 2,479 Fine sand 2,748 Fine sand 2,719 Fine sand 2,571 Fine sand
3 2,406 Fine sand 2,787 Fine sand 2,385 Fine sand 2,776 Fine sand
4 2,293 Fine sand 2,774 Fine sand 2,409 Fine sand 2,75 Fine sand
5 2,264 Fine sand 2,766 Fine sand 2,508 Fine sand 2,242 Fine sand
6 1,895 Medium sand 2,511 Fine sand 2,37 Fine sand 2,394 Fine sand
7 1,491 Medium sand 2,518 Fine sand 2,346 Fine sand 2,442 Fine sand
8 *** *** *** *** 1,877 Medium sand 2,466 Fine sand
Ω 4,097 3,269 3,131
Winter Spring Summer Fall
1
2
3
Table 2. Wind characteristics during the 7 days before the benthic macrofauna sampling (June 2004 to May 2005).
Table 3. Organisms mean density (ind. m-2) and standard deviation (SD) in winter at each level. The average index of
diversity (H’), evenness (J’), average total densities and number of species at each level are also presented.
N NE E SE S SW W NW
Frequency (%) 7,1 32,7 0,0 0,0 0,0 9,5 29,2 21,4
Average Speed (m.s-¹) 3,6 5,4 0,0 0,0 0,0 6,1 5,9 3,9
Maximum Speed (m.s-¹) 9,8 15,6 0,0 0,0 0,0 16,1 16,6 11,2
Frequency (%) 0,6 28,6 0,0 10,6 7,5 45,3 3,1 4,3
Average Speed (m.s-¹) 2,2 7,1 0,0 4,0 6,2 6,2 3,0 2,9
Maximum Speed (m.s-¹) 4,9 16,1 0,0 6,7 12,5 13,4 8,1 5,8
Frequency (%) 1,2 26,8 4,2 10,1 2,4 41,1 10,1 4,2
Average Speed (m.s-¹) 2,9 7,8 6,4 3,5 3,0 6,6 3,9 2,4
Maximum Speed (m.s-¹) 6,3 19,7 9,0 7,2 6,3 15,6 9,0 4,9
Frequency (%) 0,6 14,9 6,0 37,5 26,8 14,3 0,0 0,0
Average Speed (m.s-¹) 5,8 8,9 7,5 8,9 8,4 8,3 0,0 0,0
Maximum Speed (m.s-¹) 12,1 16,1 12,1 17,4 17,4 16,1 0,0 0,0
Frequency (%) 1,2 42,9 5,4 5,4 1,8 28,0 14,3 1,2
Average Speed (m.s-¹) 7,4 11,3 10,8 6,3 6,3 5,5 4,9 4,5
Maximum Speed (m.s-¹) 14,8 26,4 17,0 12,5 9,4 13,0 9,4 8,1
Frequency (%) 3,0 41,7 9,5 4,8 11,3 14,3 12,5 3,0
Average Speed (m.s-¹) 2,5 10,4 9,9 3,7 8,2 7,1 5,2 1,4
Maximum Speed (m.s-¹) 7,2 21,5 15,2 7,6 23,7 24,6 13,9 4,5
Frequency (%) 0,0 18,8 37,1 44,1 0,0 0,0 0,0 0,0
Average Speed (m.s-¹) 0,0 9,4 9,7 9,4 0,0 0,0 0,0 0,0
Maximum Speed (m.s-¹) 0,0 16,6 15,6 15,2 0,0 0,0 0,0 0,0
Frequency (%) 3,6 48,8 11,9 16,1 3,0 10,7 1,8 4,2
Average Speed (m.s-¹) 4,2 8,0 7,4 5,0 5,6 8,6 5,4 3,9
Maximum Speed (m.s-¹) 11,2 15,2 12,1 12,1 11,6 17,4 11,2 16,1
Frequency (%) 4,8 28,6 18,5 20,8 6,0 17,9 1,8 1,8
Average Speed (m.s-¹) 4,1 10,4 11,2 7,5 6,9 6,3 4,0 3,1
Maximum Speed (m.s-¹) 11,6 19,2 17,0 13,9 13,4 15,6 7,6 7,2
Frequency (%) 4,8 18,5 12,5 35,7 10,1 4,2 4,8 8,9
Average Speed (m.s-¹) 5,3 8,5 9,6 7,0 9,2 8,1 4,2 3,5
Maximum Speed (m.s-¹) 11,6 22,8 21,9 18,8 25,5 25,1 10,3 8,5
Frequency (%) 6,0 23,8 5,4 11,9 10,7 20,2 6,5 15,5
Average Speed (m.s-¹) 2,6 9,1 8,2 9,3 7,7 5,4 3,6 5,9
Maximum Speed (m.s-¹) 12,1 20,6 16,6 17,0 17,6 15,6 13,4 17,0
Frequency (%) 3,0 16,7 4,8 5,4 1,8 28,6 24,4 15,5
Average Speed (m.s-¹) 4,0 4,7 2,1 5,9 6,6 6,0 5,8 4,6
Maximum Speed (m.s-¹) 10,3 9,4 5,8 9,4 13,0 17,9 18,8 15,6
October
November June
July
August
September
April
May December
January
February
March
Levels
Av SD Av SD Av SD Av SD Av SD Av SD Av SD Av SD
Bivalvia
Donax hanleyanus 0 0 0 0 0 0 4,72 14,52 201,60 343,74 473,93 878,60 224,00 306,65 244,04 387,24
Mesodesma mactroides 0 0 0 0 1,18 6,13 49,51 55,37 269,97 476,02 172,12 277,95 78,99 129,56 120,25 171,99 Polychaeta
Euzonus furciferus 0 0 24,76 42,64 235,78 273,86 156,80 466,64 2,36 8,50 1,18 6,13 0 0 0 0
Scolelepis gaucha 0 0 1,18 6,13 3,54 10,19 350,14 834,73 10,61 24,97 2,36 8,50 0 0 0 0
Hemipodus olivieri 0 0 0 0 1,18 6,13 3,54 10,19 3,54 13,49 2,36 8,50 11,79 26,70 14,15 16,78
Sigalion cirriferum 0 0 0 0 0 0 0 0 5,89 15,39 3,54 10,19 5,89 12,60 3,54 10,61 Crustacea
Platyischnopidae 5,89 15,39 4,72 14,52 27,12 40,17 682,60 441,62 239,32 348,84 63,66 130,65 3,54 10,19 3,54 10,61
Phoxocephalopsis sp. 0 0 0 0 1,18 6,13 463,32 506,40 47,16 83,46 35,37 65,07 60,13 57,44 99,03 99,96
Bathyporeiapus sp. 9,43 35,11 12,97 28,28 5,89 12,60 18,86 42,58 93,13 143,69 200,42 228,48 108,46 149,89 56,59 44,39
Excirolana armata 0 0 0 0 35,37 41,72 106,10 61,16 17,68 31,00 1,18 6,13 0 0 0 0
Emerita brasiliensis 0 0 0 0 0 0 0 0 3,54 10,19 42,44 56,53 5,89 12,60 7,07 21,22
Macrochiridothea sp. 0 0 0 0 0 0 0 0 10,61 17,66 16,50 34,61 11,79 23,60 3,54 10,61
Pinnixa patagoniensis 0 0 0 0 0 0 0 0 0 0 2,36 12,25 0 0 0 0
Excirolana brasiliensis 0 0 2,36 8,50 0 0 0 0 0 0 0 0 0 0 0 0
Puelchesp. 0 0 0 0 0 0 1,18 6,13 0 0 0 0 0 0 0 0
Balloniscus sellowii 0 0 0 0 1,18 6,13 0 0 0 0 0 0 0 0 0 0 Gastropoda
Olivancillaria auricularia 0 0 0 0 0 0 0 0 0 0 0 0 1,18 6,13 0 0 Nemertea
Nemertea 0 0 0 0 0 0 8,25 18,92 7,07 22,22 5,89 15,39 4,72 14,52 3,54 10,61
Average Total Densities 15,33 39,85 45,98 51,73 312,41 261,45 1845,01 1292,69 912,49 673,21 1023,30 1373,52 516,37 387,98 555,27 458,55 Number of Taxas
J' *** *** *** *** 0,62 0,31 0,66 0,10 0,57 0,16 0,76 0,16 0,70 0,22 0,70 0,12
H'(loge) 0,07 0,20 0,31 0,42 0,76 0,44 1,29 0,22 1,05 0,40 1,25 0,30 1,19 0,40 1,28 0,19
Winter 2004
5 6 7 8
1 2 3 4
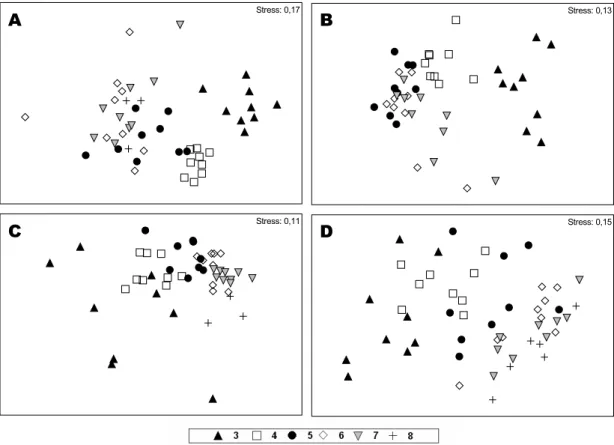
and p=0.1%; 4x5-8 R=0.5 and p=0.1%) (Fig. 3a). Through the SIMPER analysis, the dissimilarity between groups 3x4, 3x5-8 and 4x5-8 was 87%, 96% and 86%, respectively. Table 4 displays the contribution percentages of the main taxa in the formation of the distinct groups.
A total of 21 taxa were collected in spring (September, October and November). Level 4 had the greater average index of diversity (H’=1.02), whereas Level 5 presented the greatest average density and Level 7 contained the highest number of taxa (Table 5).
The formation of 2 groups was verified: one formed by Level 3 and the other by Levels 4 to 7
(ANOSIM R=0.8 and p=0.1%) (Fig. 3b). The
difference between these groups was 76%. Table 4 displays the percentages of the main taxa that formed each group.
A total of 21 taxa were found in summer (December, January and February). For the period, Level 6 presented the greater average index of diversity (H’=1.35) and highest number of taxa,
whereas Level 5 presented the greatest average density (Table 6).
Four groups were identified: Level 3, Levels 4-5, Levels 6-7 and Level 8 (ANOSIM 3x4-5 R=0.5 and p=0.1%; 3x6-7 R=0.8 and p=0.1%; 3x8 R=0.3 and p=7.7%; 4-5x6-7 R=0.5 and p=0.1%; 4-5x8 R=0.8 and p=0.4%; 6-7x8 R=0.6 and p=0.5%) (Fig. 3c). There was no significant difference between Levels 3 and 8. The likely cause for this was the abrupt reduction in the density of Euzonus furciferus at Level 3, which was the characteristic species of the level. The difference between groups 3x5, 3x6-7, 5x6-7, 4-5x8 and 6-7x8 were 70%, 83%, 55%, 69% and 49%, respectively. Table 4 displays the percentages of the main taxa in the formation of each group.
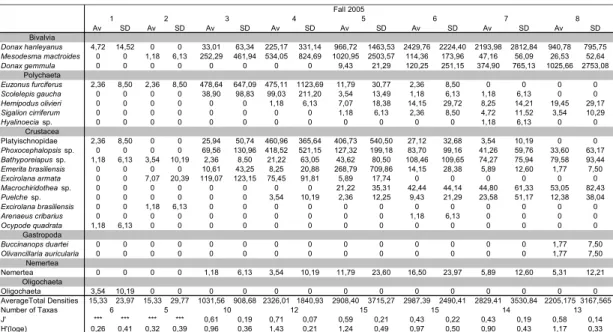
A total of 22 taxa were collected in fall (March, April and May). Level 4 presented the greatest average index of diversity (H’=1.43), whereas Level 6 showed the greatest average density. Level 5 and 6 contained the highest number of taxa for the season (Table 7).
Fig. 3. Seasonal MDS analysis of the sampling levels along transects. Each analysis contains the referent months that formed each season of the year. The letters A, B, C and D refer to winter, spring, summer and fall, respectively.
Stress: 0,17
A
B
Stress: 0,13Stress: 0,11
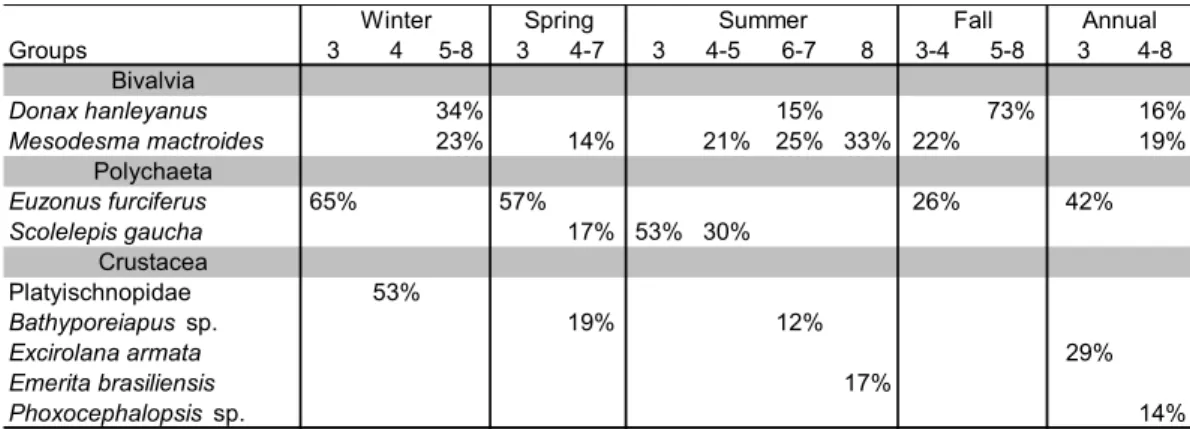
Table 4. Contribution percentage of principal taxa on the groups formed during winter, spring, summer, fall and the entire year (June 2004 to May 2005).
Table 5. Organisms mean density (ind. m-2) and standard deviation (SD) in spring at each level. The average index of
diversity (H’), evenness (J’), average total densities and number of species at each level are also presented.
Only 2 groups were identified in the period: one was formed by Levels 3-4, and the other by Levels 5 to 8 (ANOSIM R=0.6 and p=0.1%) (Fig. 3d). The dissimilarity between these groups was 87%. Table 4 displays the contribution percentages of the main taxa in the formation of each group.
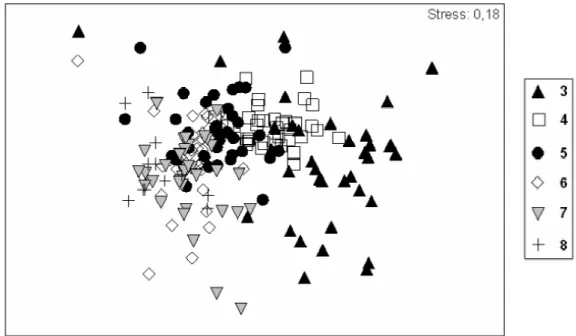
Based on the analyses of data throughout the sampling period, the formation of 2 groups was distinguished: one formed by Level 3 and the other by Levels 4 to 8 (ANOSIM R=0.6 and p=0.1%) (Fig. 4). These groups presented a dissimilarity of 76%. Table
4 displays the contribution percentages of the main taxa in the formation of each group.
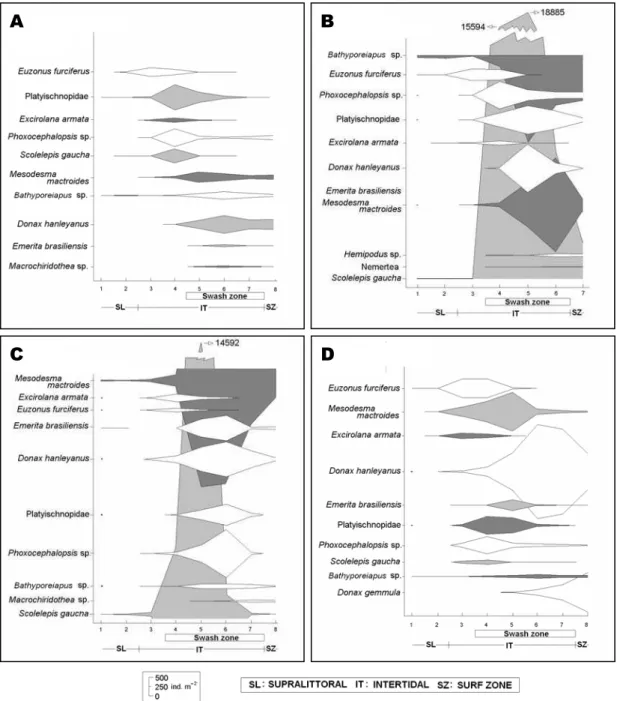
The zonation of the 10 taxa that presented
the greatest densities throughout the seasons of the year indicated a clear spatial/temporal pattern in the benthic macrofauna abundance. The greatest densities of benthic macrofauna were concentrated in the swash zone (Figs 5a, 5b, 5c, 5d). With regard to seasonality, the months of spring and, especially, summer presented greater benthic macrofauna densities, reflecting the recruitments recorded in these warmer seasons.
Groups 3 4 5-8 3 4-7 3 4-5 6-7 8 3-4 5-8 3 4-8
Bivalvia
Donax hanleyanus 34% 15% 73% 16%
Mesodesma mactroides 23% 14% 21% 25% 33% 22% 19%
Polychaeta
Euzonus furciferus 65% 57% 26% 42%
Scolelepis gaucha 17% 53% 30%
Crustacea
Platyischnopidae 53%
Bathyporeiapus sp. 19% 12%
Excirolana armata 29%
Emerita brasiliensis 17%
Phoxocephalopsis sp. 14%
Annual
Winter Spring Summer Fall
Levels
Av SD Av SD Av SD Av SD Av SD Av SD Av SD
Bivalvia
Mesodesma mactroides 3,54 18,38 0 0 2,36 8,50 76,63 98,41 1183,64 1194,89 2540,58 3312,00 298,27 367,74
Donax hanleyanus 0 0 0 0 0 0 40,08 60,90 1307,43 830,70 321,85 508,48 21,22 40,46
Donax gemmula 0 0 0 0 0 0 0 0 0 0 0 0 1,18 6,13 Polychaeta
Scolelepis gaucha 20,04 59,32 28,29 75,08 22,40 38,29 31187,22 46173,01 37770,33 61418,21 6936,78 17581,52 2024,21 5215,19
Euzonus furciferus 1,18 6,13 8,25 22,67 318,31 260,55 274,69 325,35 20,04 30,77 0 0 0 0
Hemipodus olivieri 0 0 0 0 0 0 23,58 34,86 11,79 20,03 95,49 177,23 81,35 106,43
Sigalion cirriferum 0 0 0 0 0 0 1,18 6,13 3,54 10,19 5,89 12,60 7,07 16,12
Grubeulepis bracteata 0 0 0 0 0 0 0 0 0 0 0 0 1,18 6,13
Capitella sp. 0 0 0 0 0 0 0 0 0 0 0 0 1,18 6,13
Hesionidae 0 0 0 0 0 0 0 0 0 0 0 0 1,18 6,13
Crustacea
Bathyporeiapus sp. 101,39 270,53 145,01 294,44 50,69 102,67 598,89 1231,48 4725,12 14985,79 2738,64 3824,43 2421,51 4674,16
Platyischnopidae 3,54 10,19 0 0 1,18 6,13 352,50 418,85 754,51 842,02 468,03 474,42 102,57 150,17
Phoxocephalopsis sp. 2,36 8,50 0 0 9,43 27,66 720,32 792,89 281,76 352,22 176,84 189,00 166,23 245,51
Macrochiridothea sp. 0 0 0 0 0 0 0 0 2,36 8,50 16,50 29,77 22,40 43,08
Emerita brasiliensis 0 0 0 0 0 0 0 0 11,79 21,89 11,79 20,03 0 0
Excirolana armata 0 0 1,18 6,13 25,94 42,37 106,10 109,91 2,36 12,25 1,18 6,13 0 0
Puelche sp. 0 0 0 0 0 0 1,18 6,13 4,72 19,15 1,18 6,13 2,36 8,50
Excirolana brasiliensis 1,18 6,13 1,18 6,13 0 0 0 0 0 0 0 0 0 0 Gastropoda
Olivancillaria auricularia 0 0 0 0 0 0 0 0 0 0 0 0 1,18 6,13 Nemertea
Nemertea 0 0 0 0 0 0 17,68 23,91 17,68 35,68 24,76 36,76 27,12 39,19
Oligochaeta
Oligochaeta 24,76 101,56 0 0 0 0 0 0 0 0 0 0 0 0
Average Total Densities 157,98 294,99 183,91 319,33 430,31 323,58 33400,06 46611,94 46097,06 59816,95 13339,51 18044,72 5180,19 7301,227 Number of Taxas
J' *** *** *** *** 0,66 0,20 0,49 0,32 0,37 0,26 0,49 0,23 0,51 0,21
H'(loge) 0,29 0,33 0,29 0,39 0,72 0,24 1,02 0,64 0,79 0,54 0,97 0,44 1,01 0,48
5 6 7
Spring 2004
1 2 3 4
14 13 16
Table 6. Organisms mean density (ind. m-2) and standard deviation (SD) in summer at each level. The average index of diversity
(H’), evenness (J’), average total densities and number of species at each level are also presented.
Table 7. Organisms mean density (ind. m-2) and standard deviation (SD) in fall at each level. The average index of diversity
(H’), evenness (J’), average total densities and number of species at each level are also presented.
Levels
Av SD Av SD Av SD Av SD Av SD Av SD Av SD Av SD Bivalvia
Donax gemmula 0 0 0 0 1,18 6,13 0 0 0 0 3,54 10,19 56,59 75,60 24,76 21,22
Mesodesma mactroides 23,58 69,29 1,18 6,13 53,05 111,67 282,94 366,70 5761,40 12224,50 5614,03 8758,62 2416,79 2171,48 923,10 1129,55 Donax hanleyanus 2,36 8,50 0 0 15,33 33,47 156,80 495,72 643,69 796,57 949,03 1444,80 471,57 698,44 116,71 222,82
Polychaeta
Hemipodus olivieri 0 0 0 0 0 0 1,18 6,13 2,36 8,50 2,36 8,50 4,72 11,52 0 0
Scolelepis gaucha 12,97 44,37 17,68 50,97 109,64 206,92 3697,10 5663,47 29184,23 38207,78 1055,14 1836,98 57,77 110,98 7,07 14,04
Sigalion cirriferum 0 0 0 0 0 0 0 0 1,18 6,13 4,72 14,52 4,72 14,52 10,61 15,92
Capitellidae 0 0 2,36 8,50 0 0 0 0 0 0 0 0 0 0 0 0
Euzonus furciferus 1,18 6,13 0 0 23,58 103,93 97,85 143,69 25,94 51,51 1,18 6,13 0 0 0 0
Crustacea
Phoxocephalopsis sp. 0 0 0 0 2,36 8,50 51,87 104,89 475,11 852,33 1279,13 1673,80 74,27 155,94 0 0 Emerita brasiliensis 1,18 6,13 1,18 6,13 0 0 0 0 462,14 624,34 677,88 744,92 24,76 55,37 67,20 80,28 Platyischnopidae 1,18 6,13 0 0 0 0 17,68 41,72 245,22 345,75 557,63 869,24 103,75 215,27 0 0 Bathyporeiapus sp. 1,18 6,13 0 0 1,18 6,13 2,36 8,50 121,43 327,37 123,79 119,86 101,39 122,66 14,15 28,07
Excirolana armata 2,36 8,50 0 0 17,68 35,68 200,42 141,48 91,96 116,56 31,83 81,39 0 0 0 0
Macrochiridothea sp. 0 0 0 0 0 0 0 0 5,89 25,03 28,29 39,81 67,20 115,89 49,51 71,37
Pinnixa patagoniensis 0 0 0 0 0 0 0 0 0 0 1,18 6,13 1,18 6,13 10,61 31,83
Puelche sp. 0 0 0 0 0 0 0 0 0 0 3,54 13,49 7,07 20,39 0 0
Arenaeus cribarius 0 0 0 0 0 0 0 0 0 0 1,18 6,13 0 0 0 0
Gastropoda
Buccinanops duartei 0 0 0 0 0 0 0 0 0 0 0 0 2,36 8,50 21,22 35,59
Olivancillaria auricularia 0 0 0 0 0 0 0 0 0 0 1,18 6,13 0 0 3,54 10,61
Oligochaeta
Oligochaeta 83,70 307,49 0 0 0 0 0 0 0 0 0 0 0 0 0 0 Nemertea
Nemertea 0 0 0 0 0 0 0 0 27,12 42,07 54,23 50,57 29,47 44,08 14,15 16,78 AverageTotal Densities 129,68 313,12 22,40 50,57 224,00 282,85 4508,20 5686,90 37047,65 46896,91 10389,85 11077,75 3423,59 2655,20 1262,63 1292,68 Number of Taxas
J' *** *** *** *** *** *** 0,57 0,31 0,49 0,33 0,59 0,17 0,46 0,18 0,47 0,19 H'(loge) 0,26 0,39 0,06 0,19 0,43 0,45 0,89 0,46 1,06 0,70 1,35 0,36 1,05 0,42 0,96 0,31
Summer 2004 - 2005
9 4 8 9 13 18 15 12
1 2 3 4 5 6 7 8
Av SD Av SD Av SD Av SD Av SD Av SD Av SD Av SD Bivalvia
Donax hanleyanus 4,72 14,52 0 0 33,01 63,34 225,17 331,14 966,72 1463,53 2429,76 2224,40 2193,98 2812,84 940,78 795,75 Mesodesma mactroides 0 0 1,18 6,13 252,29 461,94 534,05 824,69 1020,95 2503,57 114,36 173,96 47,16 56,09 26,53 52,64
Donax gemmula 0 0 0 0 0 0 0 0 9,43 21,29 120,25 251,15 374,90 765,13 1025,66 2753,08
Polychaeta
Euzonus furciferus 2,36 8,50 2,36 8,50 478,64 647,09 475,11 1123,69 11,79 30,77 2,36 8,50 0 0 0 0
Scolelepis gaucha 0 0 0 0 38,90 98,83 99,03 211,20 3,54 13,49 1,18 6,13 1,18 6,13 0 0
Hemipodus olivieri 0 0 0 0 0 0 1,18 6,13 7,07 18,38 14,15 29,72 8,25 14,21 19,45 29,17
Sigalion cirriferum 0 0 0 0 0 0 0 0 1,18 6,13 2,36 8,50 4,72 11,52 3,54 10,29
Hyalinoeciasp. 0 0 0 0 0 0 0 0 0 0 0 0 1,18 6,13 0 0
Crustacea
Platyischnopidae 2,36 8,50 0 0 25,94 50,74 460,96 365,64 406,73 540,50 27,12 32,68 3,54 10,19 0 0 Phoxocephalopsis sp. 0 0 0 0 69,56 130,96 418,52 521,15 127,32 199,18 83,70 99,16 41,26 59,76 33,60 63,17 Bathyporeiapus sp. 1,18 6,13 3,54 10,19 2,36 8,50 21,22 63,05 43,62 80,50 108,46 109,65 74,27 75,94 79,58 93,44 Emerita brasiliensis 0 0 0 0 10,61 43,25 8,25 20,88 268,79 709,86 14,15 28,38 5,89 12,60 1,77 7,50
Excirolana armata 0 0 7,07 20,39 119,07 123,15 75,45 91,81 5,89 17,74 0 0 0 0 0 0
Macrochiridothea sp. 0 0 0 0 0 0 0 0 21,22 35,31 42,44 44,14 44,80 61,33 53,05 82,43
Puelche sp. 0 0 0 0 0 0 3,54 10,19 2,36 12,25 9,43 21,29 23,58 51,17 12,38 38,04
Excirolana brasiliensis 0 0 1,18 6,13 0 0 0 0 0 0 0 0 0 0 0 0
Arenaeus cribarius 0 0 0 0 0 0 0 0 0 0 1,18 6,13 0 0 0 0
Ocypode quadrata 1,18 6,13 0 0 0 0 0 0 0 0 0 0 0 0 0 0
Gastropoda
Buccinanops duartei 0 0 0 0 0 0 0 0 0 0 0 0 0 0 1,77 7,50
Olivancillaria auricularia 0 0 0 0 0 0 0 0 0 0 0 0 0 0 1,77 7,50
Nemertea
Nemertea 0 0 0 0 1,18 6,13 3,54 10,19 11,79 23,60 16,50 23,97 5,89 12,60 5,31 12,21 Oligochaeta
Oligochaeta 3,54 10,19 0 0 0 0 0 0 0 0 0 0 0 0 0 0 AverageTotal Densities 15,33 23,97 15,33 29,77 1031,56 908,68 2326,01 1840,93 2908,40 3715,27 2987,39 2490,41 2829,41 3530,84 2205,175 3167,565 Number of Taxas
J' *** *** *** *** 0,61 0,19 0,71 0,07 0,59 0,21 0,43 0,22 0,43 0,19 0,58 0,14 H'(loge) 0,26 0,41 0,32 0,39 0,96 0,36 1,43 0,21 1,24 0,49 0,97 0,50 0,90 0,43 1,17 0,33
15 15 14 13
6 5 10 12
Fall 2005
Fig. 4. MDS analysis of the sampling levels along transects with the data for the entire sampling period (June 2004 to May 2005).
The greatest average density of Ocypode quadrata burrows was found in March (0.2125 dens m-2), while no burrows were encountered in July, August, September, October, December and May. For all months in which burrows were found, there was a greater concentration in dune proximities, with a reduction in number of burrows toward the lower parts of the beach.
DISCUSSION
A 3-zone pattern was found based on data recorded throughout the year: the supralittoral, where the Ghost Crab Ocypode quadrata occurred; the upper mesolittoral, characterized by polychaeta Euzonus furciferus and the isopod Excirolana armata; and the final zone including the lower mesolittoral and inner surf zone, which was characterized by the tidal migrants clams Donax hanleyanus and Mesodesma
mactroides, together with the amphipod
Phoxocephalopsis sp. The fauna of the supralittoral zone may be related to the subterrestrial zone described by Dahl (1952) and the dry sand zone described by Salvat (1964). In the scheme proposed by Dahl (1952), the mesolittoral, which corresponds to the retention zone proposed by Salvat (1964), is characterized by cirolanid isopods. In the present study, Excirolana armata was found in this zone, along with Euzonus furciferus, similarly to what was
observed on Uruguayan beaches (DEFEO et al., 1992a; GIMÉNEZ; YANNICCELLI, 1997). The third fauna zone corresponds to the infralittoral zone of Dahl (1952), that includes the resurgence and saturation zones of Salvat (1964) (MCLACHLAN, 1990).
In a one-year accompaniment of a Uruguayan beach with similar characteristics of the beach studied in the present work, 3 zones were also observed based on the annual average abundance of each species. In the study, however, the occurrence of the talitrid amphipod Pseudorchestoidea brasiliensis was recorded in the supralittoral zone (BRAZEIRO; DEFEO, 1996). An earlier study on Cassino Beach reports the occurrence of this amphipod in the supralittoral zone (GIANUCA, 1983). As recorded for other amphipods in the estuary region of Patos Lagoon, this species presents an aggregated distribution, which is reflected in its absence from the sampling of the present study.
In winter, there was the formation of 4 biological zones: the supralittoral, where the Ghost
Crab Ocypode quadrata occurred; the upper
mesolittoral, characterized by Euzonus furciferus and, to a lesser degree, Excirolana armata; the mid mesolittoral, represented by the amphipod Platyischnopidae; and the lower mesolittoral together with the inner surf zone, inhabited by the tidal
migrants Donax hanleyanus and Mesodesma
Fig. 5. Average densities per level of the organisms with greater densities during the seasons of the year. The letters A, B, C and D refer to winter, spring, summer and fall, respectively (June 2004 to May 2005).
The winter zonation pattern presented a division of the mesolittoral zone, similar to that found by James and Fairweather (1996). Raffaelli et al. (1991) concluded that up to 3 zones based on macrofauna assemblages could be identified within the
mesolittoral zone defined by Dahl (1952). The division of the mesolittoral zone was mainly due to the occurrence of the amphipod Platyischnopidae. The low temperatures of the season may determine the distribution of the amphipod in this zone. Charvat et
A
B
al. (1990) observed that amphipods were more important in the infralittoral than in the mesolittoral zone, suggesting that higher temperatures exclude amphipods from the upper parts of the beach.
Another factor that may have influenced the division of the mesolittoral zone was the low density of organisms found in winter, mainly stemming from the absence of recruitments. Even if meteorological factors are the main cause of variations in water level on the beach studied (CALLIARI; KLEIN, 1993), where winds from the south can raise the sea level by as much as 2 m (BARLETTA; CALLIARI, 2003), the greater frequency of southwestern winds, which reached as much as 16.1 m.s-1 in the 7 days prior to the sampling, did not cause a significant superimposing of organisms, probably due to the low density of benthic macrofauna in the period.
In spring, a 3-zone pattern was found, with the supralittoral composed basically of Ocypode quadrata, the upper mesolittoral dominated by Euzonus furciferus and the lower mesolittoral together with the inner surf zone characterized by amphipod Bathyporeiapus sp., polychaeta Scolelepis gaucha and Mesodesma mactroides. The spring zonation pattern fits into Dahl proposal (1952), but, similar to what occurred in the upper mesolittoral in winter, the cirolanid isopod zone was inhabited mostly by Euzonus furciferus. On a dissipative beach in
Uruguay, Defeo et al. (1992a) observed that
Excirolana armata and Euzonus furciferus were dominant organisms in the mesolittoral zone, the latter being responsible for 44% of the overall benthic macrofauna on the beach.
The high densities of Bathyporeiapus sp. and Scolelepis gaucha in spring were probably the cause of the junction of levels located from the upper swash zone to the last level, located in the inner surf zone, thereby forming a single broad band that corresponded to the infralittoral zone of Dahl (1952).
On a beach in the state of Paraná (Brazil), Bathyporeiapus ruffoi was normally well represented in the lower zones of the beach, extending its distribution with high abundance into the infralittoral zone, especially in the spring months (BORZONE; SOUZA, 1997). In the present study area, the action of the south, southwest and southeast winds, which occurred in the 7 days prior to the sampling, reaching velocities of up to 24.6 m.s-1, raised the sea level and should have collaborated to the increased density of Bathyporeiapus sp. in the mid mesolittoral zone. In this zone, the amphipod significantly superimposed its distribution with Scolelepis gaucha, the latter of which a species that present greater density in the mesolittoral zone, with values reaching 100 000 m-2 in spring and early summer (SANTOS, 1991).
On flatter beaches, the lower zones can often be fused and divided (DEFEO; MCLACHLAN,
2005). In Chile, Jaramillo et al. (1993) observed that the lower zone of the beach was broader on most dissipative beaches in comparison to other types of beaches. Giménez and Yannicelli (1997) observed that seasonal changes in wind direction may cause a variation in the position of the swash zone, leading to the superimposing of species and broadening the lower zone of the beach. Furthermore, McLachlan (1990) verified that species inhabiting the lower zones of the beach can extend their distribution to the infralittoral zone, which may explain the greater amplitude of the lower zone of the beach.
A differentiated zonation pattern was found in summer, when up to 5 zones were identified: the supralittoral, composed of Ocypode quadrata; the upper mesolittoral, dominated by Scolelepis gaucha and Excirolana armata; the mid mesolittoral, represented by Scolelepis gaucha and Mesodesma mactroides; the lower mesolittoral, inhabited mostly by the tidal migrants Mesodesma mactroides and Donax hanleyanus together with Bathyporeiapus sp; and the inner surf zone, characterized by Mesodesma mactroides and Emerita braziliensis (Anomura, Hippidae).
The similarity between the groups that characterized the upper mesolittoral and inner surf zone was influenced by the low densities of benthic macrofauna at the two levels. A relevant factor for this similarity was the low density of Euzonus furciferus in the upper mesolittoral zone, a zone which was well characterized by this species in the other seasons of the year. In summer, E. furciferus presented greater abundance at a level below the upper mesolittoral zone, but even here its abundance was still not very high. The greater abundance at a lower level of the beach (mid mesolittoral) may be the result of a damper substrate, which would favor the survival of this species in summer, season when occur the higher incidence of sunlight and warmer temperatures.
During the summer months, a greater number of people visit Cassino Beach, with consequently greater vehicle traffic precisely in the zone where the polychaeta occur, which may have influenced the lower density of Euzonus furciferus for the period. Jaramillo et al. (1996) observed no evidence of human impact on the benthic macrofauna of a Chilean beach, but Gianuca (1983) pointed out that vehicles of all types, including trucks used by fishermen, affect the macrofauna of Cassino Beach.
The possible segregation of the other two biological zones (mid and lower mesolittoral) was partially due to the greater occurrence of Scolelepis gaucha in the mid mesolittoral. Even with the superimposing of Mesodesma mactroides recruits in the lower part of this zone (the species has two recruitment periods – one between November and January, and another between February and April (DEFEO et al., 1992b), the low frequency of winds from the south, except the SE in December, may not have been sufficient enough to superimpose the species and thereby fuse these zones, as occurred in spring. Even with this separation, the 2 zones were not as distinct as the upper zones. McLachlan (1990) observed that the lower zones of the beach were less clearly defined than the upper levels, though the definition was still evident.
In general, we can compare the summer zonation pattern to that proposed by Salvat (1964). Thus, the supralittoral, upper mesolittoral, mid mesolittoral and lower mesolittoral respectively corresponded to the dry sand, retention, resurgence and saturation zones of Salvat (1964). The inner surf zone was much more evident in this season and was separated from the lower zones of the beach.
Similar to the summer zonation pattern found in the present study, Barros et al. (2001) and Borzone et al. (2003) observed that the resurgence zone was characterized by abundance peaks of Scolelepis squamata.
In fall, the 3-zone pattern repeated once again, with the supralittoral composed basically of Ocypode quadrata, the upper mesolittoral inhabited by Euzonus furciferus and Mesodesma mactroides and the final zone, including the lower mesolittoral and the inner surf zone, was largely characterized by Donax hanleyanus. This pattern can be related to that proposed by Dahl (1952), but it should be pointed out that the zonation scheme the author suggests is only based on crustacean distribution, whereas in the present study, other classes along with the Crustacea were found in the distinct zones of the beach in different seasons.
Euzonus furciferus once again characterized the upper mesolittoral in fall, significantly extending its distribution to a level below. This was especially due to the recruitment of the polychaeta, which occurred in this season. Kemp (1988) observed that Euzonus mucronata adults were restricted to the upper mesolittoral, whereas juveniles settled both within and below this zone. This can explain the significant expansion in the distribution of Euzonus furciferus at this time of year. Throughout the study, E. furciferus extended its distribution principally to Level 4, but this was only evident in fall, as a result of the recruitment of the species.
In the present study, the lower zone of the beach in fall encompassed nearly the entirety of the swash zone, and was inhabited largely by Donax hanleyanus recruits. Cardoso and Veloso (2003) found a similar result for a tropical beach, recording higher abundances of this species in winter and fall, when recruits were mainly found in the swash zone.
During the study, the levels 1 and 2 (supralittoral) were not considered in the multivariate analyses because there were many organisms originated from the stranding, i.e. organisms that were flung to these levels by storms, without the possibility of their returning to the lower parts of the beach, consequently interfering in the recognition of the zones. This phenomenon is commonly observed in sand beaches of Rio Grande do Sul, Uruguay and Argentina, where strong southern winds carry and deposit a large number of organisms on the upper parts of the beach (Ramírez et al., 2004).
In summary, zonation on Cassino Beach proved to be variable throughout the seasons of the year, however, based on the data for the entire year, the following general zonation pattern is suggested: the supralittoral, characterized by Ocypode quadrata; the upper mesolittoral, characterized by the polychaeta Euzonus furciferus; and a broad lower zone, more variable, including the lower mesolittoral and the inner surf zone, characterized by diverse species.
The two upper zones (supralittoral and upper mesolittoral) were more stable throughout the study period. Brazeiro and Defeo (1996) observed that the supralittoral was the zone that presented greater stability over time, which was corroborated in the present study. This stability was also recorded for the upper mesolittoral zone, principally due to the distribution and occurrence of Euzonus furciferus. Borzone et al.(1996) concluded that biological zones may be more evident in the presence of sedentary species than in the presence of migrant ones. Euzonus furciferus was found at depths greater than 10 cm in the sediment, which should have influenced the greater stability of this zone.
The greater variability of benthic macrofauna in the lower zone of the beach, which included the lower mesolittoral and the inner surf zone, was evident seasonally with the formation of distinct fauna groups according to the peculiarity of each season.
two groups. In spring, the high density of individuals at the lower levels of the beach, together with strong winds that likely raised the sea level, caused the expressive superimposing of species resulting in the formation of a single large group.
In summer, recruitments and milder hydrodynamic conditions may have led to the formation of three groups in the lower zone of the beach. Even with the high densities of benthic macrofauna, the frequency of winds from south in the 7 days prior to sampling was probably not sufficient enough to cause the superimposing of species. In this season, the separation of the group corresponding to the inner surf zone became more evident as a result of greater densities in the swash zone, reflecting the recruitment of tidal migrants. In fall, there was once again the formation of a single group in the lower zone of the beach, reflecting the recruitment of one tidal migrant (Donax hanleyanus) in the swash zone.
In general, the spatial variability of the benthic macrofauna groupings in the lower zone of the beach during the distinct seasons of the year was strongly influenced by fluctuations in densities stemming from both recruitments and the migration of juvenile and adult infauna. Another factor that influenced the vertical distribution of benthic macrofauna was the superimposing of species distribution due to the rise in sea level during storms.
REFERENCES
ALBERTO, R. M. F.; FONTOURA, N. F. Distribuição e estrutura etária de Ocypode quadrata (Fabricius, 1787) (Crustacea, Decapoda, Ocypodidae) em um praia arenosa do litoral sul do Brasil. Revta. bras. Biol., v. 59, n. 1, p. 95-108, 1999.
BALLY, R. Intertidal zonation on sandy beaches of the west coast of South Africa. Cah. Biol. mar., v. 24, p. 85-103, 1983.
BARLETTA, R. C.; CALLIARI, L. J. An assessment of the atmospheric and wave aspects determining beach morphodynamic characteristics along central coast of RS state, southern Brazil. J. coast. Res., v.35, p. 300-308, 2003. (special issue).
BARROS, F.; BORZONE, C. A.; ROSSO, S. Macroinfauna of six beaches near Guaratuba bay, southern Brazil.
Braz. Archs. Biol. Technol., v. 44, p.351-364, 2001. BORZONE, C.A.; GIANUCA, N.M. A zonação infralitoral
em praias arenosas expostas. Simpósio sobre Ecossistemas da Costa Sul e Sudeste Brasileira, 2. Publ. ACIESP, São Paulo, v. 3, p. 280-287, 1990.
BORZONE, C. A.; SOUZA, J. R. B.; SOARES, A. G. Morphodynamic influence on the structure of inter and subtidal macrofaunal communities of subtropical sandy beaches. Revta. chil. Hist. natur., , v. 69, p. 565-577, 1996.
BORZONE, C.A.; SOUZA, J.R.B. Estrutura da macrofauna bentônica no supra, meso e infralitoral de uma praia arenosa do sul do Brasil. Oecol. Brasiliensis, v. III, p. 197-212, 1997.
BORZONE, C.A.; MELO, S.G.; REZENDE, K.V.; VALE, R.; KRUL, R. Macrobenthic intertidal communities from wave to tide dominated beach enviroments. A case study in two brazilian beaches. J. coast. Res., v. 35, p. 472-480, 2003. (special issue).
BRAZEIRO, A.; DEFEO, O. Macroinfauna zonation in microtidal sandy beaches: is possible to identify patterns in such variable environments? Estuar. coast. Shelf Sci.,
v. 42, p. 523-536, 1996.
BROWN, A.C.; MCLACHLAN, A. Ecology of Sandy Shores. Amsterdam: Elsevier, 1990. 328 p.
CHARVAT, D.L.; NELSON W.G.; ALLENBAUGH, T.A. Composition and seasonality of sand-beach amphipod assemblages of the east coast of Florida. J. crustacean Biol., v. 10, n. 3, p. 446-454, 1990.
CALLIARI, L.J.; KLEIN, A.H.F. Características morfodinâmicas e sedimentológicas das praias oceânicas entre Rio Grande e Chuí, RS. Pesquisas, Porto Alegre, v. 20, p.48-56, 1993.
CARDOSO, R.S.; VELOSO, V.G. Population dynamics and secondary production of the wedge clam Donax
haleyanus (Bivalvia:Donacidae) on a high-energy
subtropical beach of Brazil. Mar. Biol., v. 142, p.153-162, 2003.
CLARKE, K.R.; GREEN, R.H. Statistical design and analysis for a ‘biological effects’ study. Mar. Ecol. Prog. Ser., v. 46, p.213-226, 1988.
CLARKE, K. R.; WARWICK, R. M. Change in marine communities: an approach to statistical analysis and interpretation. Plymouth, UK: Natural Environment Research Council,1994. 144 p.
DAHL, E. Some aspects of the ecology and zonation of the fauna of sandy beaches. Oikos, v. 4, p.1-27, 1952. DEFEO, O.; JARAMILLO, E.; LYONNET, A. Community
structure and intertidal zonation of the macroinfauna on the Atlantic coasts of Uruguay. J. coast. Res., v. 8, p.830-839, 1992a.
DEFEO, O.; ORTIZ, E.; CASTILLA, J. C. Growth, mortality and recruitment of the yellow clam Mesodesma mactroides on uruguayan beaches. Mar. Biol., v. 114, p. 429-437, 1992b.
DEFEO, O.; DE ALAVA, A. Effects of human activities on long-term trends in sandy beach populations: the wedge clam Donax hanleyanus in Uruguay. Mar. Ecol. Progr. Ser., v. 123, p.73-82, 1995.
DEFEO, O. & MACLACHLAN, A. Patterns, processes and regulatory mechanisms in sandy beach macrofauna: a multi-scale analysis. Mar. Ecol. Progr. Ser., v. 295, p. 1-20, 2005.
ESCOFET, A.; GIANUCA, N. M.; MAITIA, S.; SCARABINO, V. Playas arenosas Del Atlântico Sudoccidental entre los 29ºY 43ºLS: Consideraciones generales y esquema biocenologico. In: SEMINÁRIO SOBRE ECOLOGIA BENTÓNICA Y SEDIMENTACION DE LA PLATAFORMA CONTINENTAL DEL ATLÁNTICO SUR, 1979, Montevideo. Memórias... Montevideo: UNESCO, 1979. p. 254-258.
GIANUCA, N.M. A preliminary account of the ecology of sandy beaches in southern Brazil. In: MCLACHLAN, A.; ERASMUS, T.(Ed.). Sandy beaches as ecosystems.
Boston: Dr.W Junk, 1983. p. 413-420.
GIANUCA, N. M. Zonação e produção nas praias arenosas do litoral sul e sudeste do Brasil. In: SIMPÓSIO DE ECOSSISTEMAS DA COSTA SUL E SUDESTE BRASILEIRA, 1987, Cananéia. Síntese dos conhecimentos... Cananéia, SP, 1987. v. 1, p. 313-332. GIANUCA, N. M. Recursos naturais das praias arenosas do
sul do Brasil. Inf. UNESCO Cienc. Mar., Montevideo, v. 47, p.89-94, 1988.
GIANUCA, N. M. Invertebrados bentônicos da praia. In: SEELIGER, U.; ODEBRECHT, C.; CASTELLO, J.P. (Ed). Os ecossistemas costeiro e marinho do extremo sul do Brasil. Rio Grande, RS: Ecoscientia, 1998. p. 127-130.
GIMÉNEZ, L.; YANNICELLI, B. Variability of zonation patterns in temperate microtidal Uruguayan beaches with different morphodynamic types. Mar. Ecology Progr. Ser., v.160, p.197-207, 1997.
JAMES, R.J.; FAIRWEATHER, P.G. Spatial variation of intertidal macrofauna on a sandy ocean beach in Australia. Estuar. coast Shelf Sci., v. 43, p. 81-107, 1996.
JANSSEN, G.; MULDER, S. Zonation of macrofauna across sandy beaches and surf zones along the Dutch coast.
Oceanologia, v. 47, n. 2, p. 265-282, 2005.
JARAMILLO, E.; MACLACHLAN, A.; COETEZEE, P. Intertidal zonation patterns of macroinfauna over a range of exposed sandy beaches in south-central Chile. Mar. Ecol. Progr. Ser., v. 101, p. 105-117, 1993.
JARAMILLO, E.; CONTRERAS, H.; QUIJON, P. Macroinfauna and human disturbance in a sandy beach of south-central Chile. Revta. chilen. Hist. natur.,, v. 69, p.655-663, 1996.
KEMP, P. F. Production an life history of a deposit-feeding polychaete in an atypical enviroment. Estuar. coast. Shelf Sci., v. 26, p.437-446, 1988.
KENKEL, N. C.; ORLOCI , L. Applying metric and nonmetric multidimensional scaling to ecological studies: some new results. Ecology, v. 67, p. 919-928, 1986.
MASELLO, A.; DEFEO, O. Determinación de la longitud de primera madurez sexual en Mesodesma mactroides
(Deshayes 1854). Com. Soc. Malac., Uruguay, v. 6, p. 387-392, 1986.
MCLACHLAN, A. Dissipative beaches and macrofauna communities on exposed intertidal sands. J. coast. Res., v. 6, p. 57-71, 1990.
NEVES, F. M.; BEMVENUTI, C. E. The ghost crab
Ocypode quadrata (Fabricius,1787) as a potential
indicator of anthropic impact along the Rio Grande do Sul coast, Brazil. Biol. Conserv., v. 133, n. 4, p. 431-435, 2006.
NEVES, F. M.; BEMVENUTI, C. E. Spatial distribution of macrobenthic fauna on three sandy beaches from northern Rio Grande do Sul, southern Brazil. Braz. J. Oceanogr.v, v. 54, n. 2, p. 135-145, 2006.
PEREIRA, P. S. Variabilidade da orla oceânica do Rio Grande do Sul e suas implicações na elaboração de planos de contingência: aspectos morfodinâmicos, sedimentológicos e geomorfológicos. 2005. 160 f. Dissertação (Mestrado em Oceanografia Geológica) - Fundação Universidade Federal do Rio Grande, Rio Grande do Sul, 2005.
RAFFAELLI, D.; KARAKASSIS, I.; GALLOWAY, A. Zonation schemes on sandy shores: A multivariate approach. J. Exp. mar. Biol. Ecol. , v. 148, p. 241-253, 1991.
RAMÍREZ, C. F.; MIANZAN, H.; CHIAVERANO, L. Varamientos e arribazones. In: BOSCHI, E. E.; COUSSEAU, M. B. (Ed). La Vida Entre Mareas: Vegetales y Animales de Las Costas de Mar Del Plata. Argentina: INIDEP, 2004. p. 59-64.
SALVAT, B. Les conditions hydrodynamiques interstitielles de sediments meubles intertidaux et la repartition verticale de la faune endogee. Cah. Rech. Acad. Sci., Paris, v. 259, p.1576-1579, 1964.
SANTOS, P. J. P. Morphodynamical influence of temporary freshwater stream on the population dynamics of
Scolelepis gaucha (polychaeta: Spionidae) on a sandy beach in southern Brazil. Bull. mar. Sci. , v. 48, n. 3, p. 657-664, 1991.
SHORT, A. D.; WRIGHT, L. D. Physical variability of sandy beaches. In: MCLACHLAN, A.; ERAMUS, T. (Ed).
Sandy beaches as ecosystems. Boston: Dr.W Junk , 1983. p.133-144.
SOUZA, J. B. R.; GIANUCA, N. M. Zonation and seasonal variation of the intertidal macrofauna on a sandy beach of Paraná State, Brazil. Scient. mar., v. 59, n. 2, p. 103-111, 1995.
SUGUIO, K. 1973. Introdução a Sedimentologia. São Paulo: EDUSP. 317 p.
VELOSO, V.G.; CAETANO, C.H.S.; CARDOSO, R.S. Composition, structure and zonation of intertidal macroinfauna in relation to physical factors in microtidal sandy beaches in Rio de Janeiro state, Brazil. Scient. mar., v. 67, p. 393-402, 2003.