164 Brazilian Journal of Physics, vol. 36, no. 1B, March, 2006
Effect of Experimentally Observed Hot Atom Adsorption Mechanism on the Phase
Diagram of Monomer-Dimer Catalytic Reaction on Pt(111): A Monte-Carlo
Simulation Study
M. Khalid1, Q. N. Malik1, A. U. Qaisrani1, and M. K. Khan2 1Department of Physics Gomal University, Dera Ismail Khan, Pakistan and
2Department of Physics, Quaid-i-Azam University, Islamababd, Pakistan
Received on 18 March, 2005
The effect of experimentally observed hot atom mechanism on the phase diagram using Pt (111) surface of the monomer-dimer reaction has been studied. While using this mechanism, whenever O2molecule hits the randomly vacant selected site, it breaks up into atomic form and then executes ballistic flight. The path of the two oxygen atoms is taken exactly opposite to each other i.e. anti-parallel and range of the atoms is taken equal i.e. they may fly upto 1 and 1.73 atomic spacing from the site of impact . Two cases have been studied on the basis of the range of hot atoms. The steady reactive window is observed and the continuous transition disappears. As soon as the CO partial pressure departs from zero the production of CO2is observed, which clearly verifies the experimental observation.
Keywords: Catalytic surface reactions; Monte Carlo simulation; Adsorption mechanism; Heterogeneous catalysis
I. INTRODUCTION
The reaction of carbon monoxide on transition metal sur-faces was one of the first reactions studied by surface science methods [1]. Since that time oxidation of carbon monoxide has served as the most important and best understood model for surface reactions. Moreover, the adsorption of CO on plat-inum surfaces has been extensively studied due to its chem-ical and industrial importance in various catalytic processes. Lattice models of catalytic processes have been used success-fully to predict a wide range of experimental observations in catalysis and have been extremely helpful in gaining a better understanding of the kinetics of catalytic processes [2]. Many experimental and theoretical works for the CO catalytic oxi-dation system are given in the literature [3], but Monte- Carlo Simulation has been widely used to investigate the details of this reaction system. Computer simulations have been used extensively to explore adsorption, desorption, and phase tran-sitions reaction kinetics and other aspects of surface chemistry and physics. In particular, interest is growing to develop a better understanding of heterogeneous catalysis [4-6]. In this regard, the pioneering work has been done by Ziff, Gulari and Barshad (ZGB) [7]. They introduced a monomer-dimer (MD) model, which has been used to study a reaction system of the type 2A + B2→2AB. In this reaction A is CO, B2is O2and AB is CO2. . This model is generally known as the ZGB model. Details of this seminal work can be found in the lit-erature elsewhere [7,8]. The reaction mechanism exhibits two phase transitions y1 and y2. If the feed concentration of CO (yCO)is less than y1, the surface is completely covered with oxygen and if the feed concentration of CO is greater than y2, the lattice is totally filled with CO. Only in the range y1<yCO <y2 does the system exhibit a steady reactive state (SRS). The transition at y1 is continuous while at y2it is discontin-uous. Here y1is the critical concentration of CO at which an SRS starts, while y2is the critical concentration of CO where
an SRS stops. Experiments show that the production of CO2 starts as soon asyCOdeparts from zero [9-11]. Inspired by the work of Ziff et al [7], different authors have studied variants of the ZGB model [12-27] .
Recent experiments by scanning tunneling microscopy (STM) on the dissociative adsorption of oxygen molecules on an Al (111) surface [28] pointed to a “hot atom” mechanism according to which the two oxygen atoms are propelled apart upon dissociation by distances exceeding 80 ˚A in a ballistic type of motion before equilibrating with the substrate. The hot oxygen atoms react with adsorbed CO molecule or can stimu-late desorption of other co- adsorbed particles [28-30]. Wint-terlin et al [29] showed existence of a hot atom mechanism for the dissociation of O2on Pt (111) surface through variable temperature STM. Pt (111) surface can be approximated to a two dimensional hexagonal lattice where first nearest neigh-boring (nn) sites have a distance of one atomic spacing.
The objective of this work is to study the influence of exper-imentally observed hot atom mechanism on the phase diagram of A-B2reaction system. We have chosen the hexagonal lat-tice Pt (111) for this study. The effect of the reaction between a hot oxygen atom and CO-adsorbed (A ) atom on the phase diagram of the system has also been studied.
II. MODEL AND SIMULATION
The usual simple LH surface model of the system can be written in the form of the following equations:
A(g) +S→AS (1)
B2(g) +S→Bb+Bb+S (2)
M. Khalid et al. 165
As+Bs
→AB(g) +2S (4)
Bb+As→AB(g) +S (5)
Where (g) indicates the species in the gas phase and S rep-resents a vacant surface site. Xb and XS represent the atom executing ballistic motion and the adsorbed species, respec-tively.
The relative impingement rates of A and B2species, which are proportional to their partial pressures are normalized (YA + YB= 1), so the model has a single parameter, i.e.YA.
We consider an infinite reservoir filled with A and B2with partial pressures YAand 1-YA, respectively. This reservoir is in contact with a surface which is simulated by means of a hexagonal lattice of linear dimension L = 128. It is observed that an increase of the lattice size can change the critical pres-sures slightly but the overall qualitative nature of the phase diagram is not affected [31]. Periodic boundary conditions are utilized in order to avoid boundary effects. The simula-tion starts with a clean surface. The equilibrium coverages are measured as a function of YA. In order to locate the critical points ten independent runs each up to 50,000 Monte Carlo (MC) cycles are carried out. If all the ten runs proceed up to 50,000 MC cycles without the lattice getting poisoned, the particular point is considered to be within SRS. The poisoning of even a single run is a sufficient criterion for considering the point to belong to the poisoned state. If the run does not end up in a poisoned state, then in order to get the coverages cor-responding to the SRS, the initial 10,000 MC cycles are disre-garded and averages are taken over the subsequent 40,000 MC cycles. The values of coverages (production rate) are obtained after every 10 MC cycles, so that the final coverage (produc-tion rate) is an average taken over 4000 configura(produc-tions.
The simulation proceeds as follows: There are two possibil-ities for the randomly selected site (i) site might be occupied or (ii) vacant. The trial ends if the selected site is occupied. If the site is vacant and A molecule happens to be selected, then adsorption is carried out via reaction step (1). After adsorp-tion, A molecule goes for reaction step (4). If ASfinds B in its nearest neighbors, then AB (g) is produced with the creation of two vacancies otherwise trial ends.
If the selected molecule is B2and selected site is vacant, then the B2molecule dissociates into two hot atoms via reac-tion step (2). These two hot atoms execute a ballistic flight and fly in opposite direction (anti-parallel) from the site of impact and their range is taken to be equal, i.e. both atoms may fly up to the first nearest (1 atomic spacing from the site of impact,
case a) or up to second nearest neighbors (1.73 atomic spacing from the site of impact,case b). Two hot atoms may take one of the following courses: (i) if the selected site (one or both) is occupied by B, then trial will end; (ii) if both the sites are vacant, then both the B atoms will be adsorbed via reaction step (2). After adsorption both adsorbed oxygen atoms go for reaction step (4). If B atom (one or both) finds AS, in its first nearest neighbors, then AB (g) is produced with the creation of two vacancies, otherwise trial ends. (iii) If one site is vacant and A occupies the other then one Bbatom is adsorbed via re-action step (3) and then goes for rere-action step (4). The other
Bbwill directly react with ASvia step (5). (iv) If A occupies both randomly selected sites, then both Bbatoms go through reaction step (5). The output of the reaction step (5) is AB(g) with the creation of one vacancy.
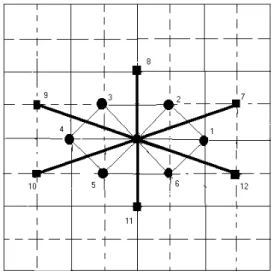
FIG. 1: Surface and subsurface layers of Hexagonal lattice. The sites marked by 1-6 are first nn at a distance of 1 atomic spacing; and the sites marked by 7-12 are second nn at a distance of 1.73 atomic spacing.
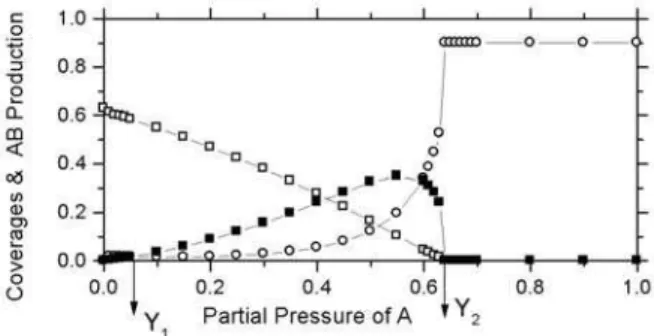
FIG. 2: Coverage’s of B (open square), A (open circle) and the production rate of AB (solid square) versus A partial pressure for case (a).
III. RESULTS AND DISCUSSION
166 Brazilian Journal of Physics, vol. 36, no. 1B, March, 2006
FIG. 3: Coverages of B (open square), A (open circle) and the pro-duction rate of AB (solid square) versus A partial pressure for case b.
1101110110000111111111001110000111011011100101011000111110010 0001101011001101101111111111111111100111111011101101011011110 1000110111111111010110100010010010110011000011111011100001111 1000111110010011011101111111111011001001110011111010110101111 0101110001111011011100001111011011110111110011000010111011001 0010011101011100111111100110111111111100001111110011011001110 1101111111011010001001101111011110100011110111111101101000110 1111101100000110111100111101000111001110101000011000110011000 1011100010001100110010011111111110111011011111000000111101111 1111111001000100001111010111000011111111010001111111101110110 2000110111111010000110001010111111100110111111111110011110111 0010111111110110110011001111011001010101001000001111110001111 1111100001111111111101101001110111101111111110111001101001110 1101101001111001111011101111001111111111100010111000011001110 0001111111101100110100101111110110100110110110111110111111111 0001010011010001001011101010111011100000111100001100001110100 1111111111010011100001110101011101101111111001010111111111110 1011110000001101100011111001110111111111111111101002001111111 0100110111111111010101011111111100101111011111011010011101111 0001110111111111111101111111111100111010010100111111110010110 0110111110001001100011001111110111111011111111001101010001001 0101100011111100000111111101110010001010011011001111111111110 1001110101111011101101010100100010010001111001011111101100110 0111110001101001110011010011011101111111011111111010100101110 0201011111111111111111100001100011110111110010110001111011011 0001111000110001001000101010001010100111111111100111110001111 1111110111110111110011011101101101111101111001101011111001100 0010101110111110011100111111000010000011111011110110110111110
FIG. 4: Snap shot on yco= 0.14 (1 for B, 2 for A and 0 for vacant
site).
change cannot affect the situation when the partial pressure of the species B2is high (A is low). This is because in this region no A is available to adsorb on the surface (every CO impinging on the surface is reacted and burnt); only B2 mole-cules are available for adsorption on the surface. That is why the value of y1 (where y1(y2)is the partial pressure or feed concentration of the monomer at which the production starts (terminates)) and the qualitative nature of the phase diagram observed in our model is similar to that of the ZGB model. However, the requirement of a single vacancy for accommo-dation of molecule of B2in contrast to the ZGB model plays an important role in the region where A starts adsorbing on the
surface. In the ZGB model, when the supply of oxygen is lim-ited due to unavailability of a pair of vacancies then A starts occupying the single vacancies whereas in the present model only a single vacancy is required to accommodate both species (B2and A) on the surface. So, naturally in contrast to ZGB model the reaction will be sustained to a higher value of feed concentration, which results in the shift of y2 from 0.525 (in ZGB) to 0.65. It is fairly known that at high partial pressure, B2forms large islands (Fig. 4). In this situation, if you pick a single vacancy as a site of impact, then there is a small chance that the other vacancy at a distance mentioned above can be obtained. Under these conditions, every trial of B2 impinge-ment will end unsuccessfully. However, in the same situation every trial of A impingement will end in the burning of oxy-gen. This means that indirectly, adsorption (supply) rate of B2is decreased whereas that of A is increased. This fact will shift the value of y1towards lower feed concentration. That is why the value of y1in all the two cases has been shifted from 0.39 to 0.05. However, the qualitative nature of the phase di-agrams are similar for case(a)and(b). It is clear in Figs. 1 and 2 that for low concentration of A, the elimination of the second-order phase transition takes place and the production of AB starts the moment the feed concentration departs from zero. In this situation the phase diagram closely resembles the experimental one qualitatively.
The experimental observation of Wintterlin et al [29] that the chance of dissociative adsorption of B2molecule on a pair of nearest neighbouring sites (like ZGB model) is very small seems to be almost true in our simulation as it does give a phase diagram (Figure 2,3) comparable to the real one [32]. However, the phase diagrams shown in Figure 2 and 3 closely resemble to that of experimental one and are consistent with the observation of Wintterlin et al [29] that the two hot oxygen atoms appear in pairs.
IV. CONCLUSION
In conclusion, we have studied catalytic oxidation of A on a Pt (111) on the basis of a ballistic type mechanism. The effect of this adsorption mechanism on the phase diagram of ZGB model have been studied. This model depicts a situation, which is observed in experiments i.e. the production of AB starts the moment A partial pressure departs from zero. The phase diagram becomes qualitatively similar to that observed experimentally for the reaction system.
[1] G. Ertl and P. Rau, Surf. Sci.15,443 (1969). [2] R. Imbihl and G. Ertl, Chem. Rev.95,697 (1995). [3] T. Engel and G. Ertl, Adv. Catal.2,28 (1997). [4] M. Silverberg et al, J. Chem. Phys.87,3178 (1987). [5] B. Chopard, Mdroz, J. Phys. A21,205 (1988).
[6] X. P. Jiang and H. Metiu, J. Chem. Phys.88,1891 (1988). [7] R. M. Ziff, E. Gulari, and Y. Barshad , Phys. Rev. Lett.56,2553
(1986).
[8] K. M. Khan, A. Basit, and K. Yaldram, J. Phys.A 33, L215 (2000).
[9] H. H. Rotermund, J. Lauterbach, and G. Haas, Appl. Phys. A57,
507 (1993).
[10] S. Ladas, R. Imbihl, and G. Ertl, Surf. Sci.219,88 (1989). [11] P. Meakin and D. J. Scalapino, J. Chem. Phys.87,731 (1987). [12] V. Schmatloch, I. Jirka, S. Heinze, and N. Kruse, Surf. Sci.331,
M. Khalid et al. 167
[13] I. Jensen and H. C. Fogedby, Phys. Rev. A42,1969 (1990). [14] J. W. Evans, J. Chem. Phys.98,2463 (1993).
[15] F. Bagnoli, B. Sente, M. Dumont, and R. Dagonnier, J. Chem. Phys.94,777 (1991).
[16] K. M. Khan and N. Ahmad, Physica A280,391 (2000). [17] K. M. Khan and K. Yaldram, Surf. Sci.445,186 (2000). [18] K. M. Khan, Surf. Sci.470,155 (2000).
[19] N. Ahmad and K. M. Khan, Chem. Phys.263,339 (2001). [20] P. Meakin, J. Chem. Phys.93,2903 (1990).
[21] K. M. Khan and W. Ahmed, J. Physica A 35,2713 (2002). [22] R. Imbihl and G. Ertl, Chem. Rev.95,697 (1995).
[23] A. U. Qaisrani, M. Khalid et al, Chin. Phys. Lett.21,1838 (2004).
[24] M Khalid, K. M. Khan , A. U. Qaisrani, and Q. N. Malik, Chin. Phys. Lett.21,1171 (2004).
[25] M. Khalid and A. U. Qaisrani, Int. J. Mod. Phys. C15,1215
(2004).
[26] K. M. Khan and E. V. Albano, Chem. Phys.276,129 (2002). [27] T. Tome and R. Dickman, Phys. Rev. E47,948 (1993). [28] H. Brune, J. Wintterlin, J. Trost, G. Ertl, Wiechers R. J. Behm,
Chem. Phys.99,2126 (1993).
[29] J. Wintterlin, R. Schuster, and G. Ert, Phys. Rev. Lett.77,123 (1996).
[30] A. N. Artsyukhovich and I. Harrison, Surf. Sci. 350, 1199 (1996).
[31] K. M. Khan, K. Yaldram, and N. Ahmad, J. Chem. Phys.109,
5054 (1998).