Article
J. Braz. Chem. Soc., Vol. 27, No. 9, 1558-1568, 2016. Printed in Brazil - ©2016 Sociedade Brasileira de Química 0103 - 5053 $6.00+0.00
*e-mail: [email protected]
Interaction of
β
-Carbolines with DNA: Spectroscopic Studies, Correlation with
Biological Activity and Molecular Docking
Marina M. Silva,a Franciele C. Savariz,b Edeíldo F. Silva-Júnior,a Thiago M. de Aquino,a Maria Helena Sarragiotto,b Josué C. C. Santosa and Isis M. Figueiredo*,a
aInstituto de Química e Biotecnologia, Universidade Federal de Alagoas, Campus A.C. Simões,
57072-900 Maceió-AL, Brazil
bDepartamento de Química, Universidade Estadual de Maringá, 87020-900 Maringá-PR, Brazil
Quantitative interaction of twelve β-carboline derivatives with calf thymus deoxyribonucleic acid (ctDNA) using spectroscopic techniques was evaluated. The values of the binding constants (Kb)
obtained for the complexes formed with the ctDNA ranged from 3.30 × 10² to 1.82 × 10⁶ mol L−1,
being the β-carbolines with the N,N-dimethylaminophenyl group at position 1 the ones which
presented the highest Kb values. The binding mode between the β-carbolines evaluated and
ctDNA was proposed from the KI assay, competition with ethidium bromide, and DNA thermal denaturation profile (Tm), where it was possible to infer that the evaluated alkaloids interact with
ctDNA preferably via intercalation. Additionally, the correlation of Kb values obtained with the
IC50 of seven human cancer cell lines was carried out. From this study, it was possible to observe a
linear relation among most of the evaluated derivatives, obtaining r2 values from 0.5360 to 0.9600.
In addition, in silico molecular docking was performed to corroborate the experimental results.
Keywords:β-carboline derivatives, ctDNA interaction, molecular fluorescence, anti-tumor activity
Introduction
The β-carboline alkaloids are a large group of natural and synthetic indole alkaloids that possess a common tricyclic pyrido[3,4-b]indole ring structure, and can
be categorized according to the saturation of their
N-containing six-membered ring.1 Studies demonstrate
that these alkaloids have several pharmacological actions, among them, anticonvulsant, viral, anti-tumor, anti-proliferative and anti-microbial activity.1-5
Moreover, β-carbolines act as deoxyribonucleic acid (DNA) intercalating agents and are able to inhibit the topoisomerases I and II enzymes,6-8 which are responsible
for regulating processes such as transcription, replication and DNA recombination.9,10
Due to different activities demonstrated by this class of compounds, we have synthesized and evaluated the biological activities of several derivatives with different substituents at positions 1 and 3 of the β-carboline nucleus. Scheme 1 shows a compilation of some of our works
highlighting compounds with activity against different
in vitro assays.11-17
In a recent study from our group,16 we showed
that a series of 1-substituted phenyl 3-(2-oxo-1,3,4-oxadiazol-5-yl) and 3-(2-oxo-3-alkylaminomethyl-1,3,4-oxadiazolyl)-β-carboline derivatives presented in vitro
antiproliferative activity against cancer cell lines, being more active for resistant ovarian (NCI-ADR/RES) and breast (MCF7) cancer cell lines. Investigation of the DNA interaction mode for the most active compound, 1-(4-N,N
-dimethylaminophenyl)-3-(2-oxo-1,3,4-oxadiazol-5-yl)
β-carboline, showed a strong interaction with DNA via intercalation, indicating that its action mechanism may be associated with this process.
In this context, some studies have tried to establish the existence of the relationship between the binding constants (Kb) values with DNA and in vitro activity parameters,18-20
Rodriguez et al.19 evaluated the correlation of
antitripanossomal activity and Kb values (interaction with
DNA) obtaining Pearson’s coefficients of 0.9056 and 0.5994 for bis(2-amino-imidazolin) and bisguanidine derivatives, respectively. These data indicate the contribution of DNA interaction process to understanding the action mechanism of these compounds. However, this behavior can not be generalized, since other mechanisms are also likely to occur, as observed for imidazoacridinones derivatives, which act as anti-tumor agents and present poor correlation between Kb and IC50 (r = 0.07).20
In general, it was noted that studies with β-carboline alkaloids, in which biological activities are related to the interaction with DNA, do not present a quantitative approach, as for example the determination of its binding constants and interaction mode.21-23
Thus, due to the significant anti-tumor activity of
β-carbolines already been demonstrated in several
studies, this work deals to evaluate the interaction, on a quantitative approach, of the β-carboline derivatives previously reported16 with DNA (calf thymus, ctDNA)
using spectroscopic techniques. In order to propose the action mechanism, the correlation of the Kb with the IC50
values (µmol L−1) previously obtained towards seven cancer
cell lines was performed. Also, in silico molecular docking
was performed to corroborate the experimental results, by predicting the binding mode, relative binding energy of the complex formed between β-carboline derivatives with DNA and to assist in the comprehension of correlation studies for the most active compounds.
Experimental
β-Carboline alkaloids: synthesis, characterization and anti-tumor activity
Synthesis and structural characterization of the
β-carboline derivatives evaluated in this study, as well as the activity against seven cancer cell lines, breast (MCF7), ovarian resistant (NCI-ADR/RES), ovarian (OVCAR-03), lung (NCI-H460), colon (HT29), prostate (PC-3) and melanoma (UACC-62), were described in detail recently.16
Reagents and solutions
DNA sodium salt from calf thymus (ctDNA type I, fibers form; Sigma-Aldrich, St. Louis, MO, USA) was employed in studies of interaction with the β-carboline derivatives evaluated. A stock solution of ctDNA was prepared by dissolving an appropriate amount of Tris-HCl
buffer (50 mmol L−1, pH 7.2 ± 0.1 containing 100 mmol L−1
of NaCl) and stored at 4 °C. The concentration of the stock solution of ctDNA was determined by ultraviolet (UV) absorption at 260 nm, using the molar extinction coefficient (ε260) of 6600 mol L−1 at 25 °C. The purity of
ctDNA solution was evaluated by monitoring the ratio of the absorbance (A) values at 260 and 280 nm. The obtained value (1.8 < A260/A280 < 1.9) indicated that the stock solution
was sufficiently free of protein contamination.24 The stock
solutions of the evaluated compounds were prepared by dissolving in dimethyl sulfoxide (DMSO) and further dilution in Tris-HCl buffer.
In assays to evaluate the binding mode of compounds with ctDNA, it was employed a stock solution of KI (0.2 mol L−1) containing 1.0 mmol L−1 of Na
2S2O3. In
competition studies, a solution of ethidium bromide (EB, 2.0 µmol L−1) containing ctDNA (6.0 µmol L−1) was used.
To demonstrate the effect of intercalation, it was employed a free solution of EB 2.0 µmol L−1.
In studies to assess the denaturation temperature (Tm)
of ctDNA, the samples were slowly heated in the range of 40 to 100 °C. The absorbance values were monitored at 260 nm for ctDNA (100 µmol L−1) in the presence and
absence of the compounds (10 µmol L−1).25 As an evaluation
parameter, it was used the variation of Tm (∆Tm, ºC) in the
presence and absence of the alkaloid under evaluation.
Apparatus
Fluorescence measurements were carried out in RF-5301 spectrofluorophotometer (Shimadzu, Kyoto, Japan) equipped with a source of xenon lamp (150 W) using quartz cuvette with 10 mm of optical path. UV spectra were recorded in AJX-6100PC double beam spectrophotometer (Micronal S.A., São Paulo, SP, Brazil). In studies evaluating the Tm of ctDNA, the samples were heated using a water
bath model SP-12/200ED (SP Labor, Presidente Prudente, SP, Brazil).
Molecular modeling
The structures of β-carboline derivatives were first treated by semi-empirical theory at level PM3 using ArgusLab v. 4.0.1 software.26 The optimized structures
with the lowest energy were used for the molecular docking calculations.
The MGL Tools 1.5.4 with AutoGrid 4 and AutoDock 427
were used to set up and perform blind docking calculations between molecules and DNA sequence.The DNA sequence
(CGCGAATTCGCG)2 dodecamer (PDB ID: 1BNA) was
obtained from the Protein Data Bank.28 DNA (as rigid
molecule) and β-carboline derivatives (as flexible ligands) files were provided using AutoDock Tools, which means that all non-ring torsions were maintained.29
Initially, the water molecules were deleted and polar hydrogen atoms were added into DNA molecules.30 Then,
the partial atomic charges of the DNA and ligands were calculated using Gasteiger-Marsili and Kollman methods, respectively. The DNA was put inside a box with number of grid points in x × y × z directions, 94 × 104 × 126 and a grid spacing of 0.375 Å. Lamarckian genetic algorithms were employed to perform docking calculations.31 The number of
genetic algorithm runs and the number of evaluations were set to 100 and 2.5 million, respectively. All other parameters were default settings. For each docking cases, the lowest energy docked conformation was selected as the binding mode. The output results were rendered with PyMol.29
Molecular models were built to discuss the binding modes by docking using an AutoDock program, for the interactions of β-carboline derivatives with multiple DNA fragments.31
The resulting complexes were used for calculating the energy parameters which support the spectroscopic results.32 For better accuracy, the energy calculations
using AutoDock Vina were performed from the 20 most important conformations for each compounds studied.33 The
conformer with minimum binding energy was picked up from the one minimum energy (root mean square deviation, RMSD = 0.0) conformers from the 20 runs.31
Results and Discussion
Evaluation of ctDNA interaction applying spectroscopy methods
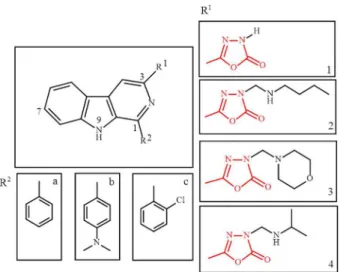
The structures of the β-carbolines evaluated (1a-c, 2a-c, 3a-c and 4a-c) are shown in Scheme 2, which presents
different substituents at positions 1 and 3.
In the studies employing molecular fluorescence, it was observed that all the evaluated compounds exhibit emission in the range of 410 to 430 nm when excited between 280-286 nm. However, the β-carboline derivatives 1b, 2b, 3b and 4b presented two emission maximums (additional
emission band in 480-500 nm); this way, it was selected the spectral region common of all assessed compounds.
Thus, according to this spectroscopic characteristic, the
β-carbolines 1-4(a-c) were titrated with ctDNA. By adding
Among the evaluated compounds, 3b (Scheme 2) presented
the highest constant interaction with ctDNA, therefore this compound was employed as a model for presentation of some results. Figure 1a shows the spectral profile obtained for compound 3b. Similar behavior was observed for the
other evaluated β-carboline derivatives.
The quantitative effect of the quencher agents in the fluorescence emission process can be obtained from the Stern-Volmer.34 To determine the value of the Stern-Volmer
constant, it was employed the following equation (equation 1):
(1)
where F0 and F are the fluorescence intensities in the
absence and presence of ctDNA, respectively. [Q] is the ctDNA concentration (which acts as a quencher) and KSV is the Stern-Volmer constant. From the variation in
intrinsic fluorescence of the compound in the presence of
ctDNA, it is also possible to calculate Kb of the compound
of interest (ligand) and the macromolecule (ctDNA). Thus, the determination of Kb and the number of binding sites
(n) of the supramolecular complex formed between the
β-carbolines evaluated and ctDNA was performed from a fluorimetric titration.35 These parameters were calculated
according to the following equation (equation 2):
(2)
The values of Kb of n are obtained from the curve of
log[(F0 − F)/F] vs. log[ctDNA]. Figures 1b and 1c show
the profiles of the curves for compound 3b from the
linearization of the equations 1 and 2, respectively. Reducing the ligand fluorescence intensity in the presence of a macromolecule is an indication that the interaction has occurred. Therefore, it is necessary that occurs the energy transfer from the ligand to DNA.36 Based
on Table 1 data, it has been observed that the KSV values
ranged from 1.94 to 56.5 103 mol L−1, indicating that there
was an interaction of all β-carboline derivatives evaluated with ctDNA.
To carrying out studies of molecular fluorescence it is fundamental to evaluate the type of dominant quenching in the interaction process, which can occur in various ways, especially the dynamic (collisional) and static quenching (complex formation).
The evaluation of the quenching typecan be performed based on a study by UV-visible (Vis) through the absorption spectra of ctDNA, the free compound and the complex formed (Figure 1S). The values of maximum absorption of compound 3b and ctDNA are located at 280 and 260 nm,
respectively. When ctDNA was added to the solution of the β-carboline derivatives, an increase in absorbance, i.e., a hyperchromic effect, was noticed, which indicated the
Scheme 2. Chemical structures of β-carboline derivatives evaluated.
Figure 1. (a) Fluorescence spectral profile for compound 3b (5.0 µmol L−1) at different molarities of calf thymus DNA (ctDNA); (b) Stern-Volmer linear
plot for 3b quenching process; (c) double logarithmic curve of ctDNA quenching fluorescence of 3b. Condition: pH = 7.2 (Tris-HCl 50 mmol L−1 and
interaction of the molecule with ctDNA,24 corroborating
the results of molecular fluorescence.
These changes can be observed in the absorbance values of the mixture 3b-ctDNA (Acomplex = 0.928),
and the sum of the values of absorbance of 3b and
ctDNA (A3b + ActDNA = 1.015). This result indicates
that the quenching mechanism was static because
∆A = Acomplex − (Acompound + ActDNA) = −0.087. How it was
different of zero, it indicates that there was alteration in the fundamental state due to the formation of 3b-ctDNA
complex. If the dynamic quenching mechanism changes at the molecular absorption spectrum in the UV-Vis of the complex, it would not be expected (Acomplex = A3b + ActDNA),
since dynamic quenching only affects the excited state and not the fundamental state.36 Similar behavior was observed
for other compounds evaluated, as shown in Table 2. The values of the Kb obtained for the complexes formed
with ctDNA ranged from 3.30 × 10² to 1.82 × 10⁶ mol L−1
(Table 1). In general, the compounds with a
N,N-dimethylaminophenyl group at position 1 (group b) presented higher values of the binding constants (3.98 × 10⁵ to
1.82 × 10⁶ mol L−1). This result can be related to the
presence of a nitrogen substituent attached directly to the aromatic ring, which increase the polarity of the molecule, and especially allowing the presence of a positive charge from protonation of the group N(CH3)2. According to the
literature, the presence of positive groups in the ligand, such as protonated amino group (pH dependent) or quaternary nitrogen (not pH dependent), leads to a greater interaction between the ligand and DNA. Compounds as ethidium bromide, acridine orange, methylene blue, thioflavin T, berenil, 2-(4-amidinophenyl)-6-indolecarbamidine (DAPI)
and Hoechst 33258, for example, present positive charge and strong interaction with DNA.37-39 The Scheme S1
shows these cited compounds and respective Kb values
with different DNA type.
The β-carbolines with the phenyl (group a) and
o-chlorophenyl (group c) substituents at C-1 presented
Kb values ranging from 3.0 × 10³ to 7.76 × 10⁴ mol L−1,
and 3.3 × 10² to 1.07 × 10⁵ mol L−1, respectively. The
smaller values of binding constants for 1-(o-chlorophenyl)
β-carboline derivatives, when compared to other
substituents (namely, a and b) can be attributed, in part,
Table 2. Absorbance values of the evaluated β-carboline derivatives 1-4(a-c) (Acompound), calf thymus DNA (ActDNA) and compound-ctDNA
(Acomplex)
Compound Acompounda / a.u ActDNAb / a.u. Acomplex / a.u. ∆A
1a 0.162 0.696 0.773 −0.085
1b 0.185 0.695 0.862 −0.018
1c 0.136 0.696 0.784 −0.048
2a 0.045 0.695 0.786 +0.046
2b 0.109 0.695 0.858 +0.054
2c 0.059 0.695 0.792 +0.038
3a 0.229 0.695 0.896 −0.028
3b 0.325 0.690 0.928 −0.087
3c 0.298 0.695 1.004 +0.011
4a 0.132 0.698 0.980 +0.150
4b 0.068 0.705 0.775 −0.018
4c 0.150 0.695 0.857 +0.012
a10 µmol L−1; b100 µmol L−1. ∆A = A
complex − (Acompound + ActDNA). Condition:
pH = 7.2 (Tris-HCl 50 mmol L−1, 100 mmol L−1 NaCl) at 30 °C.
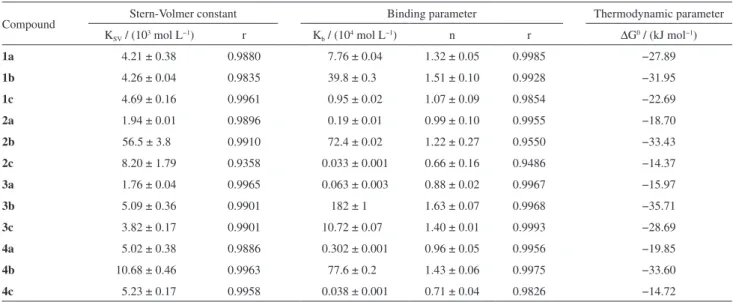
Table 1. Interaction parameters of calf thymus DNA (ctDNA) with β-carboline derivatives 1-4(a-c) at 30 ºC
Compound Stern-Volmer constant Binding parameter Thermodynamic parameter
KSV / (103 mol L−1) r Kb / (104 mol L−1) n r ∆G0 / (kJ mol−1)
1a 4.21 ± 0.38 0.9880 7.76 ± 0.04 1.32 ± 0.05 0.9985 −27.89
1b 4.26 ± 0.04 0.9835 39.8 ± 0.3 1.51 ± 0.10 0.9928 −31.95
1c 4.69 ± 0.16 0.9961 0.95 ± 0.02 1.07 ± 0.09 0.9854 −22.69
2a 1.94 ± 0.01 0.9896 0.19 ± 0.01 0.99 ± 0.10 0.9955 −18.70
2b 56.5 ± 3.8 0.9910 72.4 ± 0.02 1.22 ± 0.27 0.9550 −33.43
2c 8.20 ± 1.79 0.9358 0.033 ± 0.001 0.66 ± 0.16 0.9486 −14.37
3a 1.76 ± 0.04 0.9965 0.063 ± 0.003 0.88 ± 0.02 0.9967 −15.97
3b 5.09 ± 0.36 0.9901 182 ± 1 1.63 ± 0.07 0.9968 −35.71
3c 3.82 ± 0.17 0.9901 10.72 ± 0.07 1.40 ± 0.01 0.9993 −28.69
4a 5.02 ± 0.38 0.9886 0.302 ± 0.001 0.96 ± 0.05 0.9956 −19.85
4b 10.68 ± 0.46 0.9963 77.6 ± 0.2 1.43 ± 0.06 0.9975 −33.60
4c 5.23 ± 0.17 0.9958 0.038 ± 0.001 0.71 ± 0.04 0.9826 −14.72
to steric hindrance and the negative electron density of the chlorine substituent, which decreases the affinity to DNA by repulsion with phosphate negative charge localized in the DNA structure.24
Thus, it was observed that the values of the Kb accompanied
the following order: N,N-dimethylaminophenyl (b) >
phenyl (a) > o-chlorophenyl (c) within of same series
(R1 being fixed). The binding constants obtained for
β-carboline derivatives and ctDNA in the present
work corroborate some literature data for this class of compounds.40,41 The K
b values ≥ 105 indicate high
affinity between the evaluated compounds and ctDNA.3
The Scheme S2 presents a comparative literature reports containing similar compounds to those evaluated in this work and interactions parameters with different nucleic acids.
The analyses of Table 1 data showed also that, in general, the value of the stoichiometric ratios between
β-carbolines and ctDNA were close to unity, indicating the molar ratio of 1:1. The values related to the thermodynamic parameter to Gibbs free energy (∆G0) were all negative,
indicating that the interaction process between ctDNA and the β-carboline derivatives evaluated occurs spontaneously.
Evaluation of ctDNA-alkaloid binding mode
Assays to evaluate the binding mode with ctDNA have been conducted with compounds containing R1 = 1
(class containing a more active compound, 1b) and 3
(class containing compound with greater value of Kb, 3b)
according to Scheme 2. Thus, the binding mode between
the β-carboline alkaloids with ctDNA was proposed
according to three strategies: (i) evaluation of the effect
of KI quenching, (ii) competition with ethidium bromide,
and (iii) the profile of the DNA thermal denaturation.42,43
The iodide ion is capable of promoting the dynamic quenching of fluorescent molecules in solution. However, the molecule must be accessible for the interaction that occurs with the iodide ion. This way, it was employed as evaluation criteria the comparison of the constant value of Stern-Volmer in the absence and presence of ctDNA. KSV was calculated according to equation 1, where [Q]
corresponded to the concentration of the quencher, in this case KI.
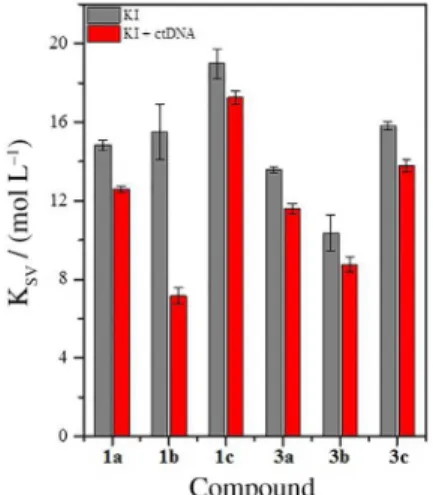
It is noticed from Figure 2 that the values of KSV for
β-carboline derivatives evaluated (1a-c and 3a-c) were
sistematically lower in presence of ctDNA. This behavior is an indication that the interaction mode has occurred preferably by intercalation, since the molecule would be protected for DNA bases, being not accessible to the iodide ion. Thus, KSV values are lower in the presence of ctDNA
because there was a smaller amount of compound free in
solution. If the KSV values in the presence of ctDNA have
been larger, it would be an indication that the iodide would have access to the compound, and thus, the most probable binding mode would not be by intercalation.16,42
To confirm that compounds evaluated interact by intercalation, a competition assay with ethidium bromide was performed. Ethidium bromide in free form presents low fluorescence emission, but when it intercalates with DNA occurs a considerable increase in fluorescence intensity, as shown in Figure S2a.
The presence of a molecule with the same binding mode with DNA in the system can lead to displacement of the intercalated EB, and, consequently, a decrease in fluorescence intensity is observed because part of the EB would be in free form (non-intercaled). The compounds that intercalate DNA are effectively able to replace the ethidium bromide by presenting a larger Kb value or by
mass effect. In the studies performed, it was employed an excess of up to 60 times related to the initial quantity of ethidium bromide, and it was observed that the emission intensity of the EB-DNA decreases as the concentration of compounds increased, yielding reductions from 15.9 to 61.3% of the signal, as shown in Table 3. It is noticed that the order of magnitude as the decrease of the signal is related to the ability to replace the EB of the DNA, obtaining in both classes of evaluated compounds the following order: b > a > c, following the same trend for the Kb values (Table 1). Thus, it can be concluded that the
binding mode of the compounds evaluated occurs similarly to ethidium bromide, confirming the data evaluation in the assay with KI and reinforcing the proposal that the preferred interaction mode of β-carbolinic derivatives with DNA is by intercalation.
Figure 2. Stern-Volmer constant (KSV) of β-carboline derivatives 1a-c
and 3a-c (5.0 µmol L−1) quenching by KI in the absence and presence
of ctDNA (50 µmol L−1). Condition: pH = 7.2 (Tris-HCl 50 mmol L−1,
The double helix of DNA is considered stable due to hydrogen bonding between the bases. The double helix may dissociate into single strands because weakening of the hydrogen bond forces with temperature increasing. The temperature at which a DNA sample is as 50% in single-stranded form and 50% in double stranded form is called denaturation temperature and is strongly related to stability of the double helix structure. Due to the interleaving process of small molecules within the double helix of DNA, there is an increase in Tm of DNA above
5 °C (∆Tm > 5).43,44 This positive variation in denaturation
temperature is attributed to increased stability of the DNA double helix by intercalation of small molecules between the chain bases. However, when the molecule does not interact by intercalation, it is not observed significant increase in Tm value.
In this study, the β-carboline derivatives binding mode with ctDNA was also assessed by thermal denaturation assays (Table 3). The Tm value was calculated in the
absence and presence of the compounds evaluated and the absorbance values were monitored at 260 nm, in a range of 40 to 100 °C. For the calculation of Tm,it was employed
the equation 3:
(3)
where fss corresponds to DNA fraction as a single strand, Af
and A0 represent the maximum absorbance values (single
stranded DNA) and minimum (DNA double strand) at 260 nm, respectively. The DNA denaturation temperature was defined when fss corresponds to 0.5. According to the
graphic representation of fssvs. temperature, (Figure S2b),
the Tm value could be calculated.
According to the results obtained, the Tm value
corresponded to 74.9 ± 1 °C in the absence of compounds, while in the presence of the evaluated compounds 1 and 3a-c, the values of ∆Tm range from 7.5 to 10.4 °C. These
results reinforce that the bindind mode of the β-carboline
alkaloids in a study with the ctDNA occurs mainly via the DNA intercalation, confirming the earlier trials.
Correlation analysis
The β-carboline derivatives 1-4(a-c) were tested for
antiproliferative activity against seven human cancer cell lines: breast (MCF7), ovarian resistant (NCI-ADR/RES), ovarian (OVCAR-03), lung (NCI-H460), colon (HT29), prostate (PC-3) and melanoma (UACC-62).16 From logK
b
values, it was evaluated the degree of linear correlation (determination coefficient, r2) with IC
50 values (µmol L−1),
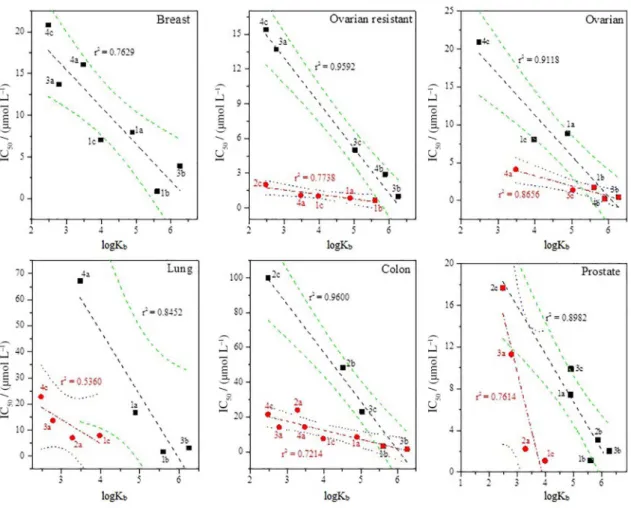
to see if these independent variables are associated and, by this means, if the action mechanism of the evaluated compounds can be associated to interaction with DNA. Figure 3 shows the determination coefficients obtained for all evaluated cell lines, except melanoma. For this strain, the correlation was very low (r2 = 0.0974), indicating that
the interaction with DNA should not be the primary action mechanism for this system.
In this study it was considered only those compounds that were contained in or close to the established statistical confidence interval, in this case 95%. Thus, for some strains, it was obtained two tracks of correlation to the most active compounds.
In accordance to Figure 3, only breast cell line presented one linear range (r2 = 0.7629), while for the other cell lines
systematically two correlations ranges were obtained, where r2 varied from 0.5360 (lung) to 0.9600 (colon). The
results showed an inverse tendency, and as larger as values of the interaction constant with the ctDNA, as lowest as the IC50 (µmol L−1) values.
Regarding compounds with higher Kb, it is noteworthy
the compounds with the N,N-dimethylaminophenyl group
at position 1 (r2). Compounds 3b and 1b were present in all
correlations (Figure 3), being the most active derivatives, followed by 4b and 2b. Therefore, it is probable that the
action mechanism of β-carboline alkaloids assessed is related to the interaction with DNA.
Due to the compounds 1b and 3b were present in
all correlations (Figure 3), it can be inferred that these
β-carboline derivatives show low selectivity to the evaluated human cancer cell lines. However, the compounds 4b and 2b were more selective, since showed activity only for
ovarian resistant (NCI-ADR/RES), ovarian (OVCAR-03) and prostate (PC-3) cell lines, respectively.
Molecular docking studies
Molecular docking is an extremely useful tool, which can be used to predict the preferred orientation of one
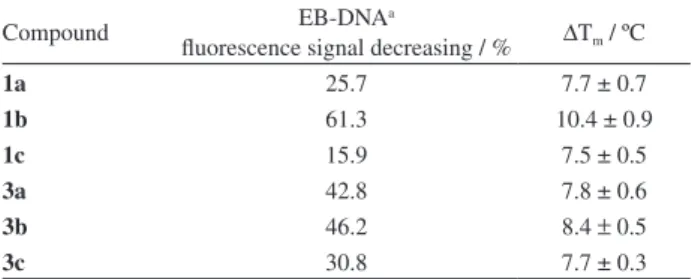
Table 3. Parameters of ethidium bromide (EB)-DNA equilibrium competition with β-carboline derivatives 1a-c and 3a-c, and melting point (Tm) study
Compound EB-DNAa
fluorescence signal decreasing / % ∆Tm / ºC
1a 25.7 7.7 ± 0.7
1b 61.3 10.4 ± 0.9
1c 15.9 7.5 ± 0.5
3a 42.8 7.8 ± 0.6
3b 46.2 8.4 ± 0.5
3c 30.8 7.7 ± 0.3
molecule when bound a macromolecule to form a stable complex. Currently, it plays a more and more important role in drugs discovery and in development.30 Studies of
molecular docking were performed only for the most active compounds and therefore with the greatests Kb values
(1b, 2b, 3b and 4b), to assess the coherency of the results
obtained experimentally using spectroscopic techniques. Initially, the structure of each alkaloid was drawn and subjected to energy optimization. These were imported to DNA for docking purpose. The most favorable conformations of the docked β-carboline derivatives were analyzed. The negative values of the binding energies, in the range of −8.6 (2b) to −9.4 kcal mol−1 (3b), indicated a
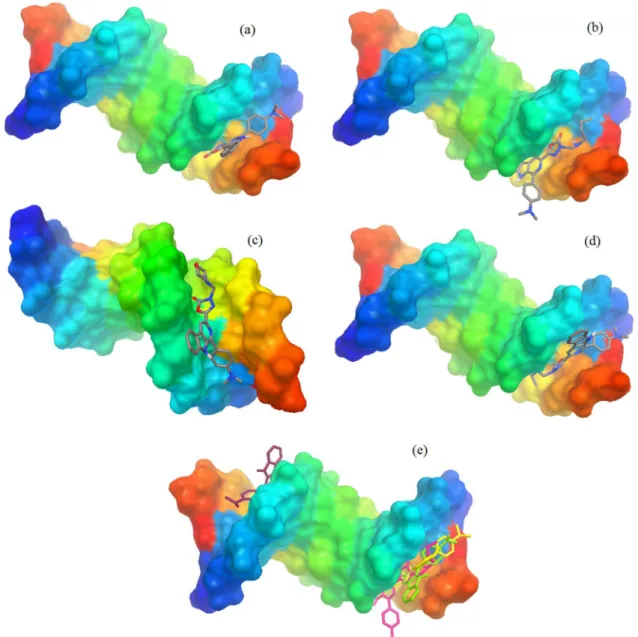
higher binding potential of the compounds with ctDNA, vianon-covalent stacking interactions, as well as they were found to be consistent with spectroscopic studies. For all the compounds docked, there are some conformational changes in the molecules after binding and a distinct preference for the minor groove intercalation mode was observed (Figure 4). Similar results were verified with others β-carboline alkaloid derivatives, where the minor groove intercalation mode was preferred relatively to the major groove intercalation and threading intercalation.45
Figure 4 indicates that the presence of the morpholylmethyl group in 3b influences the docking into the cavity of DNA.
Moreover, derivatives 1b, 2b and 4b formed hydrogen
bonds involving only 1,3,4-oxadiazol-3-one ring.
For the compound that exhibited best value of the binding energies (3b), the DNA residues C21, C23, G22
and C3, A6 and T7 played a major role in the binding site, resulting in a close contact with the surface of drug through hydrophobic interactions. In addition, β-carboline ring is insert in the ctDNA base pairs forming hydrogen bonds between pyridine and 1,3,4-oxadiazol-3-one rings with G4 and A5 residues, respectively (Figure S3). This way, studies performed by molecular docking were consistent with the spectroscopic results and, therefore, reinforce the proposal that the interaction of β-carboline alkaloids with DNA will be the biological mechanism of preferred action of these compounds.
Conclusions
In this work, the interaction of twelve β-carboline derivatives and ctDNA was evaluated by employing spectral studies by UV-Vis and molecular fluorescence.
Figure 3. Linear plot for IC50 (µmol L−1) vs. logKb at 95% of confidence interval. Kb: binding constant.
The evaluation of the binding mode, stoichiometry and the interaction strength of the formed complex showed that the compounds exhibited significant interaction with the DNA model used. The results obtained from the UV-Vis studies suggest formation of a nonfluorescent supramolecular complex, characterizing the static quenching mechanism.
The binding constants ranged from 3.30 × 10² to
1.82 × 10⁶ mol L−1. The β-carboline derivatives with the
N,N-dimethylaminophenyl group at position 1 presented
higher Kb values (3.98 × 10⁵-1.82 × 10⁶ mol L−1), probably
due to the presence of the N,N-dimethylamino substituent
linked to the aromatic ring. The binding constants values were dependent of the substituent nature at C-1, following the order: N,N-dimethylaminophenyl > phenyl >
o-chlorophenyl, within the same series. According to the KI
assay, competition with ethidium bromide and the thermal profile of DNA denaturation, it was possible to infer that the evaluated compounds interact with ctDNA preferably via intercalation. Having defined the Kb value for the twelve
evaluated alkaloids, a linear correlation with IC50 values
(µmol L−1) with 95% confidence level to seven cell lines
was stablished. In this evaluation, it was possible to observe linear trend for most of the evaluated alkaloids, yielding r2 values from 0.5360 (lung, NCI-H460) to 0.9600 (colon,
HT-29), except for melanoma, where the correlation was very low, being r2 = 0.0974.
The molecular docking studies suggest that the compound 3b presented lower binding energy value and Figure 4. Molecular docked structures of β-carboline derivatives complexes with DNA. Dodecamer duplex sequence (CGCGAATTCGCG)2 (PDB ID:
1BNA) was used in the docking studies. β-carboline derivatives were found to fit in the minor groove intercalation mode in the DNA. (a) 1b; (b) 2b; (c) 3b; (d) 4b; (e) cluster-1b, 2b, 3b, 4b.
Figure 4. Molecular docked structures of β-carboline derivatives complexes with DNA. Dodecamer duplex sequence (CGCGAATTCGCG)2 (PDB ID:
the interaction with residues C21, C23, G22 and C3, A6 and T7 of the DNA played an important role in the binding site. Furthermore, the results indicate that the presence of morpholylmethyl group in the 1,3,4-oxadiazol-3-one moiety influences in the anchoring of 3b into the DNA
cavity, while the derivatives 1b, 2b and 4b form hydrogen
bonds, involving only the 1,3,4-oxadiazol-3-one ring. Finally, from the set of results obtained from different techniques, it can be inferred that the prepoderant action mechanism of β-carboline derivatives evaluated is directly related to DNA interaction.
Supplementary Information
Supplementary data are available free of charge at http://jbcs.sbq.org.br as PDF file.
Acknowledgments
This work was supported by Fundação Araucária (Curitiba, PR, Brazil) and Fundação de Amparo à Pesquisa do Estado de Alagoas (FAPEAL, PPP 01-2011). We thank Fundação Araucária, Coordenação de Aperfeiçoamento de Pessoal de Nível Superior (CAPES) and Conselho Nacional de Desenvolvimento Cientifico e Tecnológico (CNPq) for fellowships (F. C. S., M. M. S., E. F. S. J. and M. H. S.).
References
1. Cao, R.; Peng, W.; Wang, Z.; Xu, A.; Curr. Med. Chem. 2007, 14, 479.
2. Herraiz, T.; Galisteo, J.; Food Chem. 2015, 172, 640.
3. Sarkar, S.; Bhadra, K.; J. Photochem. Photobiol., B 2014, 130, 272.
4. Khan, F. A.; Maalik, A.; Iqbal, Z.; Malik, I.; Eur. J. Pharmacol.
2013, 721, 391.
5. Patel, K.; Gadewar, M.; Tripathi, R.; Prasad, S.; Patel, D. K.;
Asian Pac. J. Trop. Biomed. 2012, 2, 660.
6. Guan, H.; Chen, H.; Peng, W.; Ma, Y.; Cao, R.; Liu, X.; Xu, A.;
Eur. J. Med. Chem. 2006, 41, 1167.
7. Deveau, A. M.; Labroli, M. A.; Dieckhaus, C. D.; Barthen, M. T.; Smith, K. S.; Macdonald, T. L.; Bioorg. Med. Chem. Lett. 2001, 11, 1251.
8. Xin, B.; Tang, W.; Wang, Y.; Lin, G.; Liu, H.; Jiao, Y.; Zhu, Y.; Yuan, H.; Chen, Y.; Lu, T.; Bioorg. Med. Chem. Lett. 2012, 22, 4783.
9. Sridevi, J. P.; Suryadevara, P.; Janupally, R.; Sridhar, J.; Soni, V.; Anantaraju, H. S.; Yogeeswari, P.; Sriram, D.; Eur. J. Pharm. Sci. 2015, 72, 81.
10. Webb, M. R.; Ebeler, S. E.; Anal. Biochem. 2003, 321, 22.
11. Barbosa, V. A.; Formagio, A. S. N.; Savariz, F. C.; Foglio, M. A.;
Spindola, H. M.; Carvalho, J. E.; Meyer, E.; Sarragiotto, M. H.;
Bioorg. Med. Chem. 2011, 19, 6400.
12. Tonin, L. T. D.; Panice, M. R.; Nakamura, C. V.; Rocha, K. J. P.; Santos, A. O.; Ueda-Nakamura, T.; Costa, W. F.; Sarragiotto, M. H.; Biomed. Pharmacother. 2010, 64, 386.
13. Formagio, A. S. N.; Tonin, L. T. D.; Foglio, M. A.; Madjarof, C.; Carvalho, J. E.; Costa, W. F.; Cardoso, F. P.; Sarragiotto, M. H.;
Bioorg. Med. Chem. 2008, 16, 9660.
14. Pedroso, R. B.; Tonin, L. T. D.; Ueda-Nakamura, T.; Dias-Filho, B. P.; Sarragiotto, M. H.; Nakamura, C. V.; Ann. Trop. Med. Parasitol. 2011, 105, 549.
15. Savariz, F. C.; Foglio, M. A.; Carvalho, J. E.; Ruiz, A. L. T. G.; Duarte, M. C. T.; Rosa, M. F.; Meyer, E.; Sarragiotto, M. H.;
Molecules 2012, 17, 6100.
16. Savariz, F. C.; Foglio, M. A.; Ruiz, A. L. T. G.; Costa, W. F.; Silva, M. M.; Santos, J. C. C.; Figueiredo, I. M.; Meyer, E.; Carvalho, J. E.; Sarragiotto, M. H.; Bioorg. Med. Chem. 2014,
22, 6867.
17. Formagio, A. S. N.; Santos, P. R.; Zanoli, K.; Ueda-Nakamura, T.; Tonin, L. T. D.; Nakamura, C. V.; Sarragiotto, M. H.; Eur. J. Med. Chem. 2009, 44, 4695.
18. Mckeever, C.; Kaiser, M.; Rozas, I.; J. Med. Chem. 2013, 56,
700.
19. Rodriguez, F.; Rozas, I.; Kaiser, M.; Brun, R.; Nguyen, B.; Wilson, W. D.; García, R. N.; Dardonville, C.; J. Med. Chem.
2008, 51, 909.
20. Dziegielewski, J.; Slusarski, B.; Konitz, A.; Skladanowski, A.; Konopa, J.; Biochem. Pharmacol. (Amsterdam, Neth.) 2002, 63, 1653.
21. Chen, Z.; Cao, R.; Shi, B.; Yi, W.; Yu, L.; Song, H.; Ren, Z.; Peng, W.; Bioorg. Med. Chem. Lett. 2010, 20, 3876.
22. Chen, Z.; Cao, R.; Yu, L.; Shi, B.; Sun, J.; Guo, L.; Ma, Q.; Yi, W.; Song, X.; Song, H.; Eur. J. Med. Chem. 2010, 45, 4740. 23. Cao, R.; Peng, W.; Chen, H.; Ma, Y.; Liu, X.; Hou, X.; Guan, H.;
Xu, A.; Biochem. Biophys. Res. Commun. 2005, 338, 1557. 24. Sirajuddin, M.; Ali, S.; Badshah, A.; J. Photochem. Photobiol., B
2013, 124, 1.
25. Sun, Y.; Peng, T.; Zhao, L.; Jiang, D.; Cui, Y.; J. Lumin. 2014, 156, 108.
26. Jullian, C.; Miranda, S.; Zapata-Torres, G.; Mendizábal, F.; Olea-Azar, C.; Bioorg. Med. Chem. 2007, 15, 3217.
27. Wen, X.; Tan, F.; Jing, Z.; Liu, Z.; J. Pharm. Biomed. Anal.
2004, 34, 517.
28. http://www.rcsb.org/pdb/home/home.do accessed in January 2016.
29. DeLano, W. L., PyMOL User’s Guide; DeLano Scientific LLC,
USA, 2002.
30. Shi, J.; Liu, T.; Jiang, M.; Chen, J.; Wang, Q.; J. Photochem. Photobiol., B 2015, 147, 47.
32. Arjmand, F.; Parveen, S.; Afzal, M.; Toupet, L.; Hadda, T. B.;
Eur. J. Med. Chem. 2012, 49, 141.
33. Trott, O.; Olson, A. J.; J. Comput. Chem. 2010, 31, 455. 34. Albani, J. R.; Principles and Applications of Fluorescence
Spectroscopy; Wiley-Blackwell: Hoboken, 2007.
35. Plsikova, J.; Janovec, L.; Koval, J.; Ungvarsky, J.; Mikes, J.; Jendzeloysky, R.; Fedorocko, P.; Imrich, J.; Kristian, P.; Kasparkova, J.; Brabec, V.; Kozurkova, M.; Eur. J. Med. Chem.
2012, 57, 283.
36. Wu, X.; Liu, J.; Wang, Q.; Xue, W.; Yao, X.; Zhang, Y.; Jin, J.;
Spectrochim. Acta, Part A 2011, 79, 1202.
37. Nafisi, S.; Saboury, A. A.; Keramat, N.; Neault, J.; Tajmir-Riachi, H.; J. Mol. Struct. 2007, 827, 35.
38. Ramaraj, R.; Ilanchelian, M.; J. Photochem. Photobiol., A 2004, 162, 129.
39. Choi, Y. S.; Cho, T.; Kim, J. M.; Han, S. W.; Kim, S. K; Biophys. Chem. 2006, 121, 142.
40. Nafisi, S.; Bonsaii, M.; Maali, P.; Khalilzadeh, M. A.; Manouchehri, F.; J. Photochem. Photobiol., B 2010, 100, 84.
41. Sarkar, S.; Pandya, P.; Bhadra, K.; PLoS ONE 2014, 9, 1. 42. Rehman, S. U.; Sarwar, T.; Isqhqi, H. M.; Husain, M. A.;
Hasan, Z.; Tabish, M.; Arch. Biochem. Biophys. 2015, 566, 7. 43. Sarwar, T.; Rehman, S. U.; Husain, M. A.; Ishqi, H. M.;
Tabish, M.; Int. J. Biol. Macromol. 2015, 73, 9.
44. Shen, H.; Shao, X.; Xu, H.; Li, J.; Pan, S.; Int. J. Electrochem. Sci. 2011, 6, 532.
45. Wu, J.; Zhao, M.; Qian, K.; Lee, K.; Morris-Natschke, S.; Peng, S.; Eur. J. Med. Chem. 2009, 44, 4153.