Article
J. Braz. Chem. Soc., Vol. 22, No. 6, 1089-1095, 2011. Printed in Brazil - ©2011 Sociedade Brasileira de Química
0103 - 5053 $6.00+0.00
A
*e-mail: [email protected]
Crystal Structure, Supramolecular Self-Assembly and Interaction with DNA of a
Mixed Ligand Manganese(II) Complex
Yun-Ming Sun,a Feng-Ying Dong,*,a,b Da-Qi Wangc and Yan-Tuan Lib
aCollege of Chemistry and Pharmacy, Qingdao Agricultural University, Qingdao, Shandong,
266109, People’s Republic of China
bMarine Drug & Food Institute, Ocean University of China, 5 Yushan Road, Qingdao, Shandong,
266003, People’s Republic of China
cCollege of Chemistry and Chemical Engineering, Liaocheng University, Liaocheng, Shandong,
252059, People’s Republic of China
Um complexo misto de manganês(II), [Mn(sal)(phen)2]ClO4 (1) (sal = salicilaldeído, phen =
1,10-fenantrolina), foi sintetizado e caracterizado por análise elementar e difração de raio-X de monocristais. A análise dos difratogramas revelou que o complexo 1 cristaliza no grupo espacial monoclínico P21/n. A unidade assimétrica do complexo é composta do cátion complexo
[Mn(sal)(phen)2]+ e do ânion perclorato não coordenado. O manganês(II) está num ambiente de
coordenação MnN4O2 de geometria octaédrica bem distorcida. Quatro tipos de empilhamento
π-π envolvendo ligantes fenantrolina e salicilaldeído estão envolvidos na auto-montagem supramolecular. Estas interações de empilhamento aromático cooperam com ligações de hidrogênio para a montagem de uma fascinante arquitetura supramolecular 3D com o complexo. Estudos de espectroscopia de absorção eletrônica e de titulação monitorando-se a luorescência de 1 com DNA de timo de bezerro sugerem a ligação do complexo por intercalação com uma constante de formação igual a 7,97×10³ L mol−1 e uma constante de supressão de Stern-Volmer de 1,34×10⁴ L mol−1.
A mixed ligand manganese(II) complex, [Mn(sal)(phen)2]ClO4 (1) (sal = salicylaldehyde, phen = 1,10-phenanthroline), has been synthesized and characterized by elemental analysis and single crystal X-ray diffractometry. The structural analysis revealed that complex 1 crystallizes in the monoclinic space group P21/n. The asymmetric unit of the complex is comprised of
[Mn(sal)(phen)2]+ complex cation and uncoordinated perchlorate anion. The manganese(II) is
located in a seriously distorted octahedral MnN4O2 coordination environment. Four types of
π-π stacking modes involving phenanthroline and salicylaldehyde ligands are involved in the
supramolecular self-assembly. These aromatic stacking interactions cooperate with hydrogen bonding to assemble the complex into a fascinating 3D supramolecular architecture. Electronic absorption spectroscopy and luorescence titration studies of the interaction between complex 1 and calf thymus DNA suggest an intercalative binding mode with a constant of 7.97×10³ L mol−1
and a Stern-Volmer quenching constant of 1.34×10⁴ L mol−1.
Keywords: manganese(II) complex, crystal structure, supramolecular self-assembly, DNA interaction, spectrum
Introduction
Much attention has been given to rational design, synthesis and characterization of new transition metal complexes in the past decades because some of them can interact with DNA acting as probes for nucleic acid structure
ligands, π-stacking in between two base pairs.14,15 So the binding site and the intensity of a metallointercalator can be tuned by the metal coordination center and chelate ligand.
Manganese is an essential element and plays a critical role in a number of physiologic processes as a constituent or activator of some enzymes.16 It is well established that manganese complexes are present in redox enzymes such as manganese superoxide dismutase, glycosyltransferase and in the metabolism of carbohydrates, amino acids and cholesterol.17,18 Some manganese complexes, e.g. [Mn(TMPyP)](OAc)5 (TMPyP = meso-tetrakis(4-N-methylpyridinumyl)
porphyrinato),19 manganese-salen derivatives,20,21 [Mn(L) (NO3)2(H2O)2] (L=2H-5-hydroxy-1,2,5-oxadiazo[3,4-f] 1,10-phenanthroline)22 and [MnL(NO
3)(H2O)3]NO3·CH3OH (L = 6,7-dicycanodipyrido[2,2-d:2′,3′-f]quinoxaline),23 also present intercalative DNA-binding capacity or signiicant DNA/antitumor activity. Therefore the synthesis and characterization of new manganese complexes are of great importance not only for developing novel chemotherapeutics and highly sensitive diagnostic agents but also for understanding the role and mechanism of manganese complexes in biological system. In this study a mixed ligand manganese(II) complex, [Mn(sal)(phen)2]ClO4 (1) (sal = salicylaldehyde, phen = 1,10-phenanthroline), is reported. The crystal structure, non-covalent interactions and the 3D supramolecular self-assembly are discussed. The spectral behavior of the complex interacting with calf thymus DNA (CT-DNA) is explored by electronic absorption and luorescence emission measurements.
Experimental
Materials and methods
Calf thymus DNA was purchased from the Sigma Company. All other chemicals and solvents were acquired from commercial sources and used as received, unless otherwise noted. Tris-HCl buffer solution (pH 7.66, Tris = tris(hydroxymethyl)aminomethane) was prepared using redistilled water.
The C, H and N microanalyses were performed on a Perkin-Elmer 240 elemental analyzer. The electronic spectrum was measured on a Cary 300 spectrophotometer. The luorescence spectra were measured with a FP-6200 luorescence spectrophotometer.
Preparation of [Mn(sal)(phen)2]ClO4 (1) complex
A stock solution (10 mL) of Mn(ClO4)2•6H2O (723.9 mg, 2 mmol) in ethanol was added into 10 mL of
a 1,10-phenanthroline monohydrate solution (396.4 mg, 2 mmol) in ethanol. Then an aqueous solution (20 mL) of salicylaldehyde (268.6 mg, 2.2 mmol) and NaOH (88.0 mg, 2.2 mmol) was added dropwise and the mixture was stirred for 3 h at room temperature. Then, the orange precipitate was collected, washed with ethanol and air-dried. A bright orange crystal of [Mn(sal)(phen)2]ClO4 suitable for X-ray determination was obtained in a home-made V-shaped tube illed with a 1:1 mixture of acetonitrile and ethanol. Yield, 78% (based on phenanthroline). Anal. Calc. for C31H21ClMnN4O6: C, 58.55; H, 3.33; N, 8.81. Found: C, 58.51; H, 3.30; N, 8.78.
Determination of X-ray crystal structure
The X-ray diffraction experiment for complex 1 was
carried out on a Bruker Smart-1000 CCD diffractometer with graphite monochromated MoKαα(λ = 0.71073 Å) radiation at room temperature. Data collection, cell reinement, data reduction and correction for absorption were performed using Bruker programs.24 The structure was solved by direct method and expanded using the Fourier transform package in Shelxl-97 program.25 The non-hydrogen atoms were reined anisotropically by full-matrix least-square calculations on F2. The C-bound H atoms were
placed in calculated positions, with C–H distance of 0.93 Å, and reined as riding, with Uiso (H) = 1.2Ueq (C). Detailed information about crystal data and structure determinations is summarized in Supplementary Information (Table S1).
Interaction of complex with DNA
All experiments involving CT-DNA were performed in Tris-HCl buffer solution. Stock solution of the CT-DNA was stored at 4 oC and used in no more than four days. The ratio of UV absorbance at 260 and 280 nm is about 1.9, which indicates that the DNA was suficiently independent of protein in the buffer.26 The CT-DNA concentration was determined spectrophotometrically using the molar absorptivity of 6600 L mol−1 cm−1 at 260 nm.27 Concentrated stock solution of complex 1 was prepared in
DMF and the solution was diluted with Tris-HCl buffer. Spectrophotometric titration was performed by adding increments of the CT-DNA to the complexsolution and incubating for 10 min before recording the signal. The fluorescence titration experiment was performed by keeping the concentration of complex 1 constant while
increasing the CT-DNA concentration. The luorescence spectra of complex 1 were recorded exciting at 254 nm and
bromide (EB) in the dark for at least 2 h. Increasing amounts of complex solution were added to the pretreated CT-DNA solution and their effect on emission intensity was measured. The ethidium bromide displacement spectra were recorded exciting at 522 nm and monitoring at 583 nm.
Results and Discussion
Description of the crystal structure
The asymmetric cell of complex 1 is comprised of
[Mn(sal)(phen)2]+ complex cation and uncoordinated perchlorate anion. The Oak Ridge thermal ellipsoid plot of complex cation is depicted in Figure 1. Complex 1
crystallizes in the monoclinic space group P21/n. In [Mn(sal)(phen)2]+ complex cation, Mn(II) is coordinated by two O atoms from one salicylaldehyde and four N atoms from two phenanthroline ligands. Four atoms, N1, N2, N4 and O2 are located at the equatorial plane with the mean deviation of 0.144 Å. The manganese center is only 0.062 Å displaced from the equatorial plane. The Mn–N/O bond lengths and N/O–Mn–N/O bond angles range from 2.057(4) to 2.346(5) Å, and from 71.69(17) to 160.36(17)° (Table S2), indicating that Mn(II) is located in a seriously distorted octahedral coordination environment.28-30 Perchlorate anion is not directly coordinated to the metal center but forms a series of hydrogen bonds in the supramolecular structure.
Non-covalent interactions and supramolecular self-assembly
Crystal structure analysis and calculation revealed abundant non-covalent interactions such as π-π stacking
interactions and hydrogen bonds in complex 1. The stacking
interactions as well as hydrogen bonds are essential for the structural stability and function of DNA and RNA and for self-assembly or recognition processes when extended structures are formed from building blocks with aromatic moieties.31-34 Our previous studies demonstrate that 1,10-phenanthroline is one of the most favorable bidentate ligands to display π-π stacking supramolecular interactions
in the crystal due to its large aromatic system.35 As dealt with before,36,37 two stacking phenanthroline molecules are divided into four pyridine (A, A′, C and C′) and two arene
(B and B′) segments in order to facilitate the description of
this extended π system. The corresponding stacking data
such as the interplanar separation (h), dihedral angle (α),
centroid-centroid distance (d), centroid displacement (r) and slip angle (θ) were calculated (Table S3). The analysis
of stacking data indicates four types of intermolecular π-π
stacking modes, i.e. (I) phenanthroline-phenanthroline
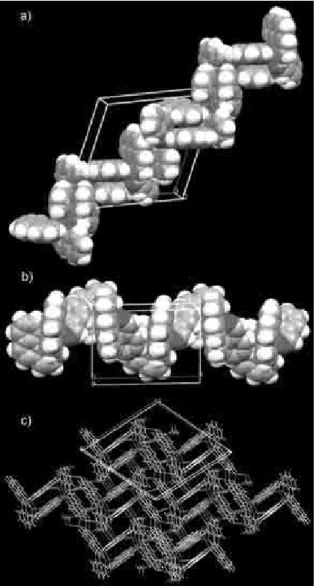
(phen-phen), (II) pyridine (py-py), (III) pyridine-arene (py-ar) offset face-to-face and (IV) T-shaped stacking were observed in complex 1 (Figure 2). As illustrated
in Figure 2a, two N4-bound phenanthroline (N4-phen) molecules (symmetry codes: 2–x, 2–y, –z) give an opposite orientation in stacking mode I. They are parallel to each other with the interplanar separation of 3.520 Å. The centroid-centroid distances of A–C′, C–A′, B–C′, B–B′,
C–B′ and C–A′ all fall in the 3.63-4.00 Å range, which
indicates the π-π interactions involve the extended π
system of whole phenanthroline molecule. For two stacking phenanthroline molecules, the centroid displacement is 1.23 Å and the slip angle is 19.32°, similar to those of a perfect face-to-face alignment. Such phenanthroline-phenanthroline stacking mode is rare in the reported complexes.38 Two N1-bound phenanthroline molecules (symmetry codes: 1.5–x, 0.5+y, 0.5–z) stack with each other to give stacking mode II (Figure 2b). The stacking parts are not completely parallel to each other but inclined with the dihedral angle of 11°. Other centroid-centroid distances among the six-membered rings are all longer than 4.0 Å except A′–C for 3.787 Å, suggesting π-π stacking
interactions mainly occur in two outer pyridine rings. This mode is comparable to pyridine-pyridine-type approach of stacked quinoline molecules.38 Owing to the large centroid displacement (1.44 Å) and slip angle (22.29 °), the stacking force in complex 1 is apparently weaker than that in the
{[Cu(phen)CN][Cu(phen)][Cu(CN)2]}n complex.35 The complex cations are organized into a ladder-like chain through the π-π stacking interactions I and II (Figure 3a).
Another two types of π-π stacking interactions (mode
III and IV) involving phenanthroline and salicylaldehyde
are observed besides the above-mentioned stacking interactions between phenanthroline ligands. As shown in Figure 2c, the stacking mode III involves one pyridine ring of N3-bound phenanthroline and one aromatic ring of salicylaldehyde. Although two π systems present the large
dihedral angle (17.6°), interplanar separation (3.721 Å)
and centroid-centroid distance (3.849 Å), some short C…C distances (C23…C5A, C23…C6A and C24…C6A)
bear out the severely offset π-stacked geometry with an
aromatic attraction rather than a π-π repulsion.39 The stacked geometry of mode IV is very distinct from that of the above three (Figure 2d). Two stacked aromatic systems, C7-bound arene ring of salicylaldehyde and N1A-bound phenanthroline (symmetry codes: 0.5+x, 1.5–y, 0.5+z), do not assume parallel or near parallel face-to-face arrangement but almost perpendicular with the dihedral angle of 95°. The distances of H7 atom-centroid (2.970 Å),
H6…C17A (2.852 Å) and H7…C13A (2.887 Å) are all
smaller than the observed value (3.02 Å), making it clear that mode IV is a typical edge-to-face, namely T-shaped arrangement.40 Such edge-to-face stacking systems are Figure 2. Stacking modes of π-π interactions in complex 1. (a) Mode I
(symmetry codes: 2–x, 2–y, –z). (b) Mode II (symmetry codes: 1.5–x, 0.5+y, 0.5–z). (c) Mode IIII (symmetry codes: 0.5+x, 1.5–y, –0.5+z). (d) Mode IV (symmetry codes: 0.5+x, 1.5–y, 0.5+z).
Figure 3. The supramolecular self-assembly architecture of complex 1.
mainly dominated by π-δ attraction and more stable than
offset face-to-face arrangement.39 As displayed in Figure 3b, the complex cations are assembled into a quasi-helical chain along the crystallographic c axis through π-π stacking
action III and IV.
In addition, four O atoms, two of them from salicylaldehyde and others from perchlorate, form six weak C–H…O hydrogen bonds with C–H bonds of phenanthroline
and salicylaldehyde (Table S4). This C8−H8…O2
is an intramolecular hydrogen bond and others are intermolecular. The O1 and O5 atoms produce two normal hydrogen bonds C10–H10…O1 (symmetry codes: 1.5–x,
–0.5+y, 0.5–z) and C1–H1…O5 (symmetry codes: 0.5–x,
0.5+y, 0.5–z). However both O2 and O3 act as H-acceptor to participate in forming double hydrogen bonds, respectively,
i.e., C8–H8…O2, C31–H31…O2 (symmetry codes: 1–x,
1–y, 1–z), C22–H22…O3 (symmetry codes: 1+x, 1+y, z)
and C29–H29…O3 (symmetry codes: 1–x, 1–y, –z).41 Because two roughly parallel donor dipoles repel each other, the double hydrogen bonds may inluence each other and reduce their strengths.42 These intermolecular hydrogen bonds cooperate with π-π stacking action to
assemble complex 1 into an interesting 3D supramolecular
structure (Figure 3c).
Spectrophotometric titration for DNA binding studies
Electronic absorption spectroscopy is an effective method to determine the binding mode and intensity of metal complex with DNA. The hypochromism is associated with the intercalative binding mode involving a strong stacking interaction between the aromatic chromophore of complex and the base pairs of DNA.43 The electronic absorption spectra of complex 1 in absence and presence of CT-DNA
are given in Figure 4. As the concentration of CT-DNA increased, the electronic spectra display a progressive decrease at 266 nm, which suggests that complex 1 interacts
with CT-DNA through an intercalative association in which the planar aromatic moiety slides in between base pairs by means of π-π stacking interactions.44 The result can be rationally explained as follows: some π* orbitals of the
aromatic ligand are coupled with π orbitals of the base pairs
when complex 1 intercalates into the base pairs of CT-DNA.
The coupled orbitals are partially illed by electrons, which gives rise to the decrease of the π-π* transition energy and
the transition probability, and shows hypochromism.9 The intrinsic binding constantKb can be obtained from the spectral titration data by equation 1 to determine quantitatively the DNA binding characteristics of complex 1:45
[DNA] / (ε
a − εf) = [DNA] / (εb − εf) + 1 / Kb (εb − εf) (1)
where [DNA] is the concentration of CT-DNA; ε
f, εa and
εb correspond to the extinction coeficient for free, added,
and fully bound to complex 1, respectively. The plot of
[DNA]/(εa−εf) versus [DNA] gives the Kb value as the ratio
of slope to intercept. From the plot shown in Figure 4, the intrinsic binding constant Kb for complex 1 is calculated as 7.97×10³ L mol−1 (r = 0.992 for ive points) which is smaller than that of [Co(phen)2(amtp)](ClO4)3 (3.23×10⁵ L mol−1),46 indicating that it is a moderate binder of CT-DNA.
Fluorescence titration experiments for DNA binding studies
The luorescence titration experiment has been used to characterize the interaction of complex with DNA following the changes in luorescence intensity of complex. As shown in Figure 5a, complex 1 is luorescent exhibiting the most
intense peak at 366 nm in Tris-HCl buffer at ambient temperature. The emission intensities gradually decreased with the addition of CT-DNA, indicating an interaction with complex 1. The quenching may be attributed to the
electron transfer from the base pairs of CT-DNA to the excited MLCT state of complex.47
In order to further investigate the interaction between complex 1 and CT-DNA, the ethidium bromide (EB)
luorescence displacement experiment has been carried out. It is known that EB can emit intense luorescence in presence of DNA due to the strong intercalation between the adjacent DNA base pairs. The luorescence of EB-DNA system can be quenched by addition of a second species that is able to displace the EB molecules. The quenching degree
Figure 4. Absorption spectra of complex 1 in Tris-HCl buffer at pH = 7.66,
in absence (A) and in presence of increasing amounts of [DNA] (B–F). [Complex] = 1.0×10⁻⁵ mol L−1, [DNA] = 1.0–10.0×10⁻⁵ mol L−1. Arrow shows the absorbance change trend upon increasing DNA concentration. Insert: Plot of [DNA]/(εa–εf) vs. [DNA] for complex 1. The best it line,
of the EB-DNA system luorescence is usually used to determine the binding strength.48,49 The luorescence spectra of EB-DNA system in absence and presence of complex 1
are given in Figure 5b. The luorescence intensity at 583 nm decreased as a function of the complex concentration, suggesting the displacement of some EB molecules from the base pairs. This behavior was analyzed using the Stern-Volmer equation (2):50
I0 / I = 1 + Ksv [Q] (2)
where I0 and I represent the luorescence intensities in absence and presence of quencher, respectively, [Q] is the concentration of quencher, Ksv is a linear Stern-Volmer quenching constant. In the quenching plot of I0 / I versus [complex], Ksv value is given by the slope. The Ksv Figure 5. (a) Emission spectra of complex 1 in absence (A) and in
presence of increasing amounts of [DNA] (B–M) with subtraction of the complex absorbance. λex = 254 nm, [Complex] = 1.0×10⁻⁵ mol L−1, [DNA] = 1.0–13.0×10⁻⁵ mol L−1. Arrow shows the intensity change upon increasing DNA concentration. (b) Fluorescence quenching curves of EB bound to DNA by complex 1. λex = 522 nm, [EB] = 1.0×10⁻⁶ mol L−1, [DNA] = 2.5×10⁻⁵ mol L−1, [Complex] = 0–14.0×10⁻⁶ mol L−1 (A–H). Arrow shows the intensity change upon increasing the complex concentration. Insert: Plot of I0/I vs. [complex] for fluorescence quenching curves of EB bound to DNA for complex 1. The best it line
yields Ksv = 1.34×10⁴ L mol−1.
value for complex 1 was calculated as 1.34×10⁴ L mol−1
(r = 0.995 for eight points). This is smaller than that of
complex [Co(phen)2(amtp)](ClO4)3 (7.75×10⁵ L mol−1),46 indicating complex 1 is more weakly bound toCT-DNA.
The result also matches with the spectrophotometric titration experiments.
Conclusions
A new mixed ligand manganese(II) complex [Mn(sal) (phen)2]ClO4 was synthesized and its crystal structure resolved by single crystal X-ray diffraction. Some C–H…O
hydrogen bonds and four types of π-π stacking interaction
modes involving phenanthroline and salicylaldehyde ligands were observed and discussed in detail. A fascinating 3D supramolecular structure is generated by these supramolecular non-covalent interactions. Spectroscopic studies suggest the manganese(II) complex interacts with CT-DNA by means of intercalation mechanism with moderate binding intensity. The results are valuable in understanding the binding modes of the metal complex with DNA as well as laying a foundation for rationally design of novel agents with different binding afinity for probing and targeting nucleic acids.
Supplementary Information
Crystallographic data (excluding structure factors) for the structures in this paper have been deposited in the Cambridge Crystallographic Data Centre as supplementary publication number CCDC 763705. Copies of the data can be obtained, free of charge, via www.ccdc.cam.ac.uk/conts/retrieving. html or from the Cambridge Crystallographic Data Centre, CCDC, 12 Union Road, Cambridge CB2 1EZ, UK; fax: +44 1223 336033. E-mail: [email protected].
More information is available free of charge at http://jbcs.sbq.org.br as a pdf ile.
Acknowledgments
All authors acknowledge the financial support of Qingdao Agricultural University (630916 and SYKT10-30) and Ocean University of China.
References
1. Sigman, D. S.; Graham, D. R.; D’Aurora, V.; Stern, A. M.;
J. Biol. Chem. 1979, 254, 12269.
2. Aldrich-Wright, J. R.; Vagg, R. S.; Williams, P. A.; Coord.
Chem. Rev. 1997, 166, 361.
4. Li, Y.; Wu, Y.; Zhao, J.; Yang, P.; J. Inorg. Biochem. 2007, 101,
283.
5. Hadjiliadis, N.; Sletten, E.; Metal Complex-DNA Interactions,
Wiley-Blackwell: Hoboken, New Jersey, USA, 2009. 6. Chelli, R.; Gervasio, F. L.; Procacci, P.; Schettino, V.; J.Am.
Chem. Soc. 2002, 124, 6133.
7. Keene, F. R.; Smith, J. A.; Collins, J. G.; Coord. Chem. Rev.
2009, 253, 2021.
8. Wang, B.-d.; Yang, Z.-Y.; Crewdson, P.; Wang, D.-q.; J. Inorg.
Biochem. 2007, 101, 1492.
9. Jiang, M.; Li, Y.-T.; Wu, Z.-Y.; Liu, Z.-Q.; Yan, C.-W.; J. Inorg. Biochem. 2009, 103, 833.
10. Erkkila, K. E.; Odom, D. T.; Barton, J. K.; Chem. Rev. 1999,
99, 2777.
11. Zhang, Q. L.; Liu, J. G.; Liu, J.; Xue, G.-Q.; Li, H.; Liu, J.-Z.; Zhou, H.; Qu, L.-H.; Ji, L.-N.; J. Inorg. Biochem. 2001, 85, 291.
12. Xu, H.; Zheng, K. C.; Chen, Y.; Li, Y. Z.; Lin, L. J.; Li, H.; Zhang, P. X.; Ji, L. N.; Dalton Trans. 2003, 2260.
13. Ensai, A. A.; Hajian, R.; Ebrahimi. S.; J. Braz. Chem. Soc.
2009, 20, 266.
14. Howe-Grant, M.; Lippard, S. J.; Biochemistry1979, 18, 5762.
15. Zeglis, B. M.; Pierre, V. C.; Barton, J. K.; Chem. Commun.
2007, 4565.
16. Şakıyan, İ.; Transition Met. Chem. 2007, 32, 131.
17. Nielsen, F. H. In Modern Nutrition in Health and Disease;
Shils, M.; Olson, J. A.; Shike, M.; Ross, A. C., eds.; Williams & Wilkins: Baltimore, 1999.
18. Leach, R. M.; Harris, E. D. In Handbook of Nutritionally
Essential Minerals; O’Dell, B. L.; Sunde, R. A., eds.; Marcel
Dekker, Inc: New York, 1997.
19. Bernadou, J.; Pratviel, G.; Bennis, F.; Girardet, M.; Meunier, B.;
Biochemistry1989, 28, 7268.
20. Gravert, D. J.; Grifin, J. H.; J. Org. Chem. 1993, 58, 820.
21. Peng, B.; Zhou, W.-H.; Yan, L.; Liu, H.-W.; Zhu, L.; Transition
Met. Chem. 2009, 34, 231.
22. Xu, Z.-D.; Liu, H.; Xiao, S.-L.; Yang, M.; Bu, X.-H.; J. Inorg. Biochem. 2002, 90, 79.
23. Xu, Z.-D.; Liu, H.; Min, W.; Xiao, S.-L.; Yang, M.; Bu, X.-H.;
J. Inorg. Biochem. 2002, 92, 149.
24. Bruker; SMART, SAINT, SADABS and SHELXTL; Bruker AXS
Inc.: Madison, Wisconsin, USA, 1999.
25. Sheldrick, G. M.; SHELXS-97 and SHELXL-97, Program for
Crystal Structure Analysis; University of Göttingen: Göttingen,
Germany, 1997.
26. Marmur, J.; J. Mol. Biol. 1961, 3, 208.
27. Reichmann, M. E.; Rice, S. A.; Thomas, C. A.; Doty, P.; J. Am.
Chem. Soc. 1954, 76, 3047.
28. Liu, C.-S.; Sañudo, E. C.; Yan, L.-F.; Chang, Z.; Wang, J.-J.; Hu, T.-L.; Transition Met. Chem.2009, 34, 51.
29. Zhu, Y.-M.; Li, W.-J.; Lv, L.-F.; Wang, P.; Wu, J.-Y.; Yang, J.-X.; Zhou, H.-P.; Tian, Y.-P.; Jiang, M.-H.; Tao, X.-T.; Transition
Met. Chem.2007, 32, 967.
30. Sain, S.; Maji, T. K.; Chaudhuri, N. R.; Transition Met. Chem.
2002, 27, 716.
31. Amabilino, D. B.; Stoddart, J. F.; Chem. Rev. 1995, 95, 2725.
32. Claessens, C. G.; Stoddart, J. F.; J. Phys. Org. Chem. 1997, 10,
254.
33. Roesky, H. W.; Andruh, M.; Coord. Chem. Rev. 2003, 236, 91.
34. Terrŕn, A.; Fiol, J. J.; García-Raso, A.; Barcelí-Oliver, M.; Moreno, V.; Coord. Chem. Rev. 2007, 25, 1973.
35. Dong, F.-Y.; Li, Y.-T.; Wu, Z.-Y.; Sun, Y.-M.; Sun, W.; Liu, Z.-Q.; Song, Y.-L.; J. Inorg. Organomet. Polym. 2008, 18, 398.
36. Dou, J. M.; Gao, X. K.; Dong, F. Y.; Li, D. C.; Wang, D. Q.;
Dalton Trans. 2004, 2918.
37. Sun, Y.-M.; Dong, F.-Y.; Wang, D.-Q.; Wang, Y.-L.; Li, Y.-T.; Dou, J.-M.; J. Inorg. Organomet. Polym. 2010, 20, 168.
38. Janiak, C. A.; J. Chem. Soc., Dalton Trans. 2000, 3885.
39. Hunter, C. A.; Sanders, J. K. M.; J. Am. Chem. Soc. 1990, 112,
5525.
40. Rowland, R. S.; Taylor, R.; J. Phys. Chem. 1996, 100, 7384.
41. Desiraju, G. R.; Acc. Chem. Res. 1996, 29, 441.
42. Saenger, W.; Nature1979, 279, 343.
43. Tabassum, S.; Parveen, S.; Arjmand, F.; Acta Biomaterialia
2005, 1, 677.
44. Long, E. C.; Barton, J. K.; Acc. Chem. Res. 1990, 23, 271.
45. Pyle, A. M.; Rehmann, J. P.; Meshoyrer, R.; Kumar, C. V.; Turro, N. J.; Barton, J. K.; J. Am. Chem. Soc. 1989, 111, 3051.
46. Peng, B.; Chao, H.; Sun, B.; Li, H.; Gao, F.; Ji, L.-N.; J. Inorg.
Biochem. 2007, 101, 404.
47. Mesmaeker, A. K.-D.; Orellana, G.; Barton, J. K.; Turro, N. J.;
Photochem. Photobiol. 1990, 52, 461.
48. Baguley, B. C.; LeBret, M.; Biochemistry1984, 23, 937.
49. Kumar, R. S.; Arunachalam, S.; Polyhedron2007, 26, 3255.
50. Lakowicz, J. R.; Webber, G.; Biochemistry1973, 12, 4161.
Supplementary Information
S
I
J. Braz. Chem. Soc., Vol. 22, No. 6, S1-S2, 2011. Printed in Brazil - ©2011 Sociedade Brasileira de Química 0103 - 5053 $6.00+0.00
*e-mail: [email protected]
Crystal Structure, Supramolecular Self-Assembly and Interaction with DNA of a
Mixed Ligand Manganese(II) Complex
Yun-Ming Sun,a Feng-Ying Dong,*,a,b Da-Qi Wangc and Yan-Tuan Lib
aCollege of Chemistry and Pharmacy, Qingdao Agricultural University, Qingdao, Shandong,
266109, People’s Republic of China
bMarine Drug & Food Institute, Ocean University of China, 5 Yushan Road, Qingdao, Shandong,
266003, People’s Republic of China
cCollege of Chemistry and Chemical Engineering, Liaocheng University, Liaocheng, Shandong,
252059, People’s Republic of China
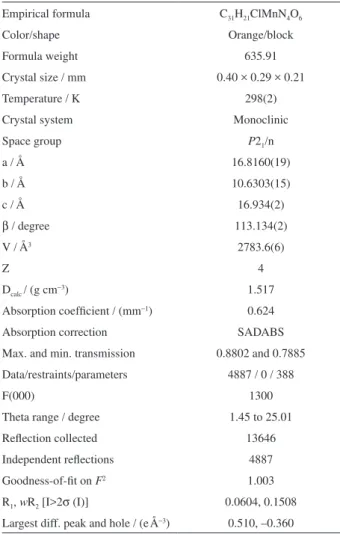
Table S1. Summary of crystallographic data for complex 1
Empirical formula C31H21ClMnN4O6
Color/shape Orange/block
Formula weight 635.91
Crystal size / mm 0.40 × 0.29 × 0.21
Temperature / K 298(2)
Crystal system Monoclinic
Space group P21/n
a / Å 16.8160(19)
b / Å 10.6303(15)
c / Å 16.934(2)
β / degree 113.134(2)
V / Å3 2783.6(6)
Z 4
Dcalc / (g cm−3) 1.517
Absorption coeficient / (mm−1) 0.624
Absorption correction SADABS
Max. and min. transmission 0.8802 and 0.7885
Data/restraints/parameters 4887 / 0 / 388
F(000) 1300
Theta range / degree 1.45 to 25.01
Relection collected 13646
Independent relections 4887
Goodness-of-it on F2 1.003
R1, wR2 [I>2σ (I)] 0.0604, 0.1508
Largest diff. peak and hole / (eÅ−3) 0.510, –0.360
Table S2. Selected bond lengths (Å) and angles (°) for complex 1
Mn(1)–O(2) 2.057(4) Mn(1)–N(4) 2.234(5)
Mn(1)–O(1) 2.158(4) Mn(1)–N(1) 2.264(4)
Mn(1)–N(3) 2.227(5) Mn(1)–N(2) 2.346(5)
O(2)–Mn(1)–O(1) 84.12(16) N(1)–Mn(1)–N(2) 71.69(17)
O(2)–Mn(1)–N(3) 91.89(16) O(1)–Mn(1)–N(1) 102.47(17)
O(1)–Mn(1)–N(3) 160.36(17) N(3)–Mn(1)–N(1) 96.62(16)
O(2)–Mn(1)–N(4) 113.54(16) N(4)–Mn(1)–N(1) 155.92(17)
O(1)–Mn(1)–N(4) 90.1(2) O(2)–Mn(1)–N(2) 159.07(16)
N(3)–Mn(1)–N(4) 73.81(19) O(1)–Mn(1)–N(2) 93.76(16)
O(2)–Mn(1)–N(1) 88.39(16) N(3)–Mn(1)–N(2) 96.62(16)
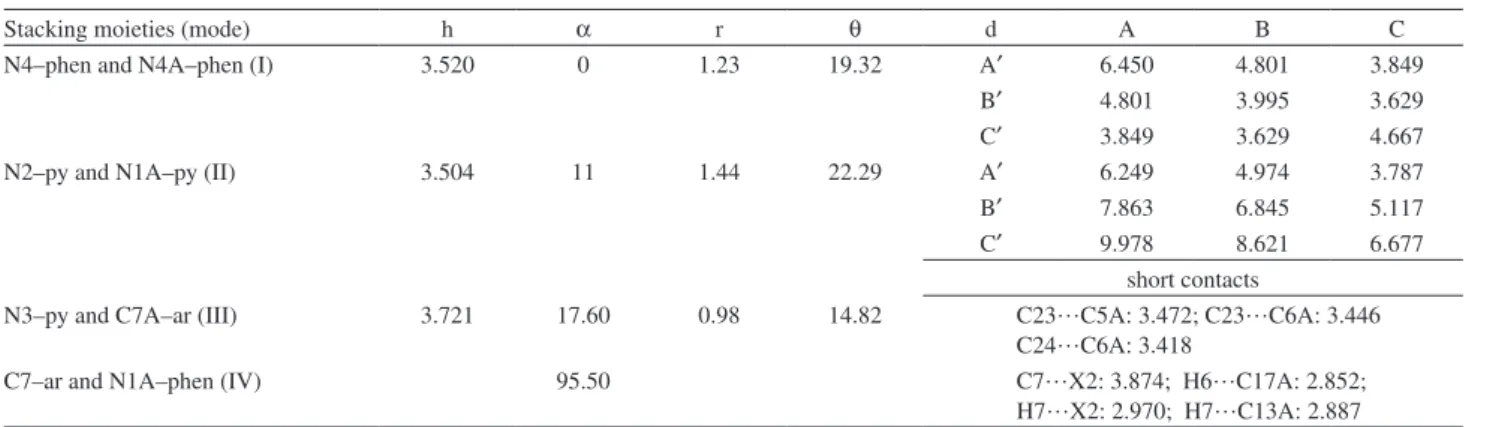
Table S3. Data of π-πstacking interactions in complex 1a,b,c,d
Stacking moieties (mode) h α r θ d A B C
N4–phen and N4A–phen (I) 3.520 0 1.23 19.32 A′ 6.450 4.801 3.849
B′ 4.801 3.995 3.629
C′ 3.849 3.629 4.667
N2–py and N1A–py (II) 3.504 11 1.44 22.29 A′ 6.249 4.974 3.787
B′ 7.863 6.845 5.117
C′ 9.978 8.621 6.677
short contacts
N3–py and C7A–ar (III) 3.721 17.60 0.98 14.82 C23…C5A: 3.472; C23…C6A: 3.446
C24…C6A: 3.418
C7–ar and N1A–phen (IV) 95.50 C7…X2: 3.874; H6…C17A: 2.852;
H7…X2: 2.970; H7…C13A: 2.887
aSymmetry codes: I 2–x, 2–y,–z; II 1.5–x, 0.5+y, 0.5–z; III 0.5+x, 1.5–y, –0.5+z; IV 0.5+x, 1.5–y, 0.5+z.
bN4–phen represents the N4–bound phenanthroline; N2–py represents the N2–bound pyridine moiety of phenanthroline; C7–ar represents the C7–bound arene. cd Centroid-centroid distance (Å); h Interplanar separation (Å); α dihedral angle (°); θ Slip angle (°); r Centroid displacement (Å). cosθ = h/d; r2 = d2 – h2. dA, B, C, A′, B′ and C′ represent the six-membered rings in two stacking phenanthroline ligands. X2 represents the centroid of phenanthroline ligand.
Table S4. A list of hydrogen bonds in complex 1 (Å, °)a
D–H…A D–H H…A D…A ∠DHA
C1–H1…O5#1 0.93 2.59 3.22 155
C8–H8…O2 0.93 2.55 3.12 120
C10–H10…O1#2 0.93 2.55 3.32 141
C31–H31…O2#3 0.93 2.53 3.19 128
C22–H22…O3#4 0.93 2.69 3.44 138
C29–H29…O3#5 0.93 2.66 3.38 135
aSymmetry codes: #1 0.5–x, 0.5+y, 0.5–z; #2 1.5–x, –0.5+y, 0.5–z;
![Figure 1. ORTEP structure of complex cation [Mn(sal)(phen) 2 ] + in complex 1 with 20% probability ellipsoids](https://thumb-eu.123doks.com/thumbv2/123dok_br/18995448.462053/3.892.489.818.110.385/figure-ortep-structure-complex-cation-complex-probability-ellipsoids.webp)
![Figure 4. Absorption spectra of complex 1 in Tris-HCl buffer at pH = 7.66, in absence (A) and in presence of increasing amounts of [DNA] (B–F)](https://thumb-eu.123doks.com/thumbv2/123dok_br/18995448.462053/5.892.478.821.108.369/figure-absorption-spectra-complex-absence-presence-increasing-amounts.webp)