Article
Printed in Brazil - ©2016 Sociedade Brasileira de Química0103 - 5053 $6.00+0.00*e-mail: [email protected]
Thermodynamic Study on the Acid-Base Properties of Antioxidant Compound
Ascorbic Acid in Different NaClO
4Aqueous Ethanol Solutions
Morteza Jabbari* and Sedigheh Khosravinia
School of Chemistry, Damghan University, 36716-41167 Damghan, Iran
The proton dissociation equilibria of ascorbic acid were investigated using a combination of spectrophotometric/potentiometric techniques at constant temperature 25.0 ± 0.1 °C. The study was carried out over a wide range of ionic strengths of 0.1-3.0 mol dm-3 NaClO
4 in ethanol-water
mixture (1:1). The Gran’s method was used for glass electrode calibration to obtain pH readings based on the concentration scale (pcH). Data process for calculation of the protonation constants
was done using the STAR (stability constants by absorbance reading) computer program. The dependence on ionic strength of the constants was analyzed by means of the SIT approach (specific ion interaction theory). In addition to the specific interaction parameters of the ionic species, the protonation constants at infinite dilution (zero ionic strength) were obtained. Finally, the thermodynamic functions ∆G0 (standard Gibbs free energy change) for the protonation processes
were also calculated at different ionic strengths.
Keywords:acid-base equilibria, ascorbic acid, ionic strength effect, SIT approach, NaClO4
non-aqueous solution
Introduction
Ascorbic acid is a well-known essential vitamin (vitamin C) of vital importance for maintenance of human health. It is not synthesized in organisms but is received with food as dissolved in water, and is active in a great
number of biochemical processes.1 Two of its major
interactions are in potentiating the immune system and aiding the synthesis of the protein collagen, which is a
fundamental substance that holds together the human body.2
It is available at high levels in citrus fruits, green and red peppers, strawberries, tomatoes, turnip and other leafy vegetables. This substance is very sensitive to moisture, light, heat, metal ions and is readily and irreversibly oxidized, especially in aqueous solutions, by reacting with air oxygen such that can be easily transformed into biologically inactive or harmful products. This behavior can limit its uses efficiently. The ability of ascorbic acid to donate electrons makes it a potent water-soluble antioxidant that readily scavenges physiologically relevant reactive species such as molecular oxygen, superoxide, hydroxyl radical, ozone and hypochlorous acid. Therefore, it can prevent chronic diseases due to oxidative stress, including
cancer, hypertension, cardiovascular disease and stroke.3-5
An accurate knowledge about the acid-base properties of bioactive and pharmacopoeia compounds is very important in many fields, since provide basic data to predict the extent of ionization of them as a function of pH and thus help in understanding the action mechanism of these substances in both chemical and biological processes. Moreover, these information are essential for the measurements of pH-dependent pharmacologic properties such as lipophilicity, permeability, protein binding and solubility which in turn directly affects pharmacokinetic characteristics like absorption, distribution, metabolism,
and excretion.6,7
Using a combination of pH-metric titration and multi-wavelength spectrophotometric method is an accurate and good-reproducibility technique for dissociation
constants (pKa values) determination of each compound
that possesses pH-dependent light absorption due to the presence of a chromophore in proximity to the ionization center(s). For instance, the protonated and deprotonated forms exhibit sufficient spectral dissimilarities. In this
technique, low analyte concentration is used (about 10-5 to
10-6 mol dm-3) and allows suitable absorbance measurement
for products sparingly soluble in water.8
few in the literature, in particular in non-aqueous media with high ionic strengths. In continuation of our previous
investigations,9-12 therefore, this work deals with study
of the protonation process of ascorbic acid by a UV/pH titration method in different aqueous ethanol solutions (1:1)
of NaClO4 (0.1-3.0 mol dm-3) as background electrolyte.
Then, the dependence of acid dissociation equilibria on ionic strength of medium were modeled by the specific ion interaction theory (SIT).
Experimental
Reagents and chemicals
Ascorbic acid (C6H8O6, Scheme 1) was purchased from
Sigma as analytical reagent grade material and was used without further purification. The sodium hydroxide and
hydrochloric acid solutions (Titrisol, 1.00 mol dm-3) were
prepared from Merck. Sodium perchlorate supplied from Merck and was kept at room temperature in vacuum at least 72 hours before use. The organic solvent, ethanol was of analytical grade, obtained from Merck. All dilute solutions were prepared by mixing doubly distilled water, the average
resistance of which did not exceed less than 18 MΩ cm.
Apparatus and procedure
The potential values of the potentiometric cell, Ecell,
were measured using a WTW inoLab (model 720) research pH meter, equipped with a combined glass-pH electrode (model N 6000 A). The electrode potential can be read
with a precision typically of the order of 0.1 mV. The
glass electrode was stored in water when not in use and soaked for 10 to 15 min in the ethanol-water mixture (1:1) prior to the potentiometric measurements. All titrations were carried out in an 80 mL thermostatted commercial double-walled glass vessel and the test solution was stirred magnetically for homogenizing it. During the course of
titrations, to exclude any atmospheric CO2 (g) and O2 (g)
trace from the system, a stream of purified N2 (g) was
passed through a sodium hydroxide solution and then bubbled slowly into the working solutions. Absorbance spectra of species in different steps of the titration were
recorded on a PerkinElmer (model LAMBDA 25) diode array UV-Vis spectrophotometer in conjunction with a LabTech LCB-R08 thermo-circulator, using quartz cells of path 10 mm.
All experiments related to measuring the pKa values
of ascorbic acid were done at constant temperature
25.0 ± 0.1 °C and ionic strengths of 0.1, 0.5, 1.0, 2.0
and 3.0 mol dm-3 NaClO
4. The protonation constants
were evaluated from the measurements of absorbance
versus Ecell by titration of a known volume of ascorbic acid
(4.83 × 10⁻⁵ mol dm-3) with 0.20 mol dm-3 NaOH solution
both with the same ionic strength and solvent composition. The working solutions were prepared freshly for each experiment, and the container was covered with foil to protect the solution from light.
Before multi-wavelength spectrophotometric titration, first, the glass electrode system calibration was carried out in ionic strengths examined according to the Gran’s
method.13 For this purpose, a measured amount of strong
acid solution (20 mL of 0.01 mol dm-3 HCl) was placed in
the double-wall glass vessel. The electrode was immersed in the solution into the titration vessel and then acidic solution was titrated potentiometrically with a strong base
(0.20 mol dm-3 NaOH) both at the same conditions of
temperature, ionic strength and solvent composition to be used in later experiments. Sufficient time (normally 2-3 min)
was allowed to reach a reasonably stable Ecell reading before
the next titrant addition and the recorded Ecell values were
then used to obtain calibration constants. Usually, 10 or 12 additions of sodium hydroxide solution were enough for these constants to be accurately determined. In the next step, a suitable volume (0.2 mL) of stock solution of
ascorbic acid (0.005 mol dm-3) was added to the pre-titrated
background solution. By continuing the titration, in each addition of titrant, after waiting for the potential reading to be stable, an absorbance spectrum was recorded with 1 nm
resolution at the wavelength range of λ = 200-320 nm.
Then, all relevant data were stored in computer and a new volume of titrant was added to restart the cycle. Each set of experiments (in different ionic strengths studied), including calibration of the glass electrode and the UV-Vis spectrometric titrations was at least twice repeated under carefully controlled experimental conditions. Typically,
the experimental values of Ecell as a function of the added
volume of alkaline titrant for the combined glass electrode calibration and potentiometric titration are listed in Table 1
in 1.0 mol dm-3 NaClO
4 ionic strength.
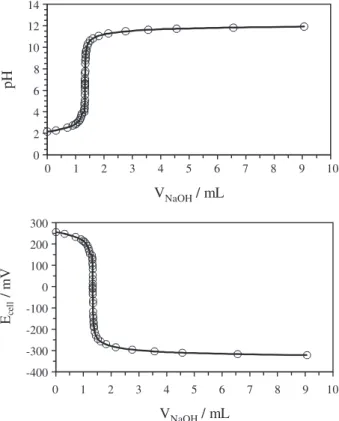
The typical potentiometric titration curves (a plot of
pH or Ecell against V) for ascorbic acid at ionic strength of
1.0 mol dm-3 NaClO
4 medium, 25.0 °C and 50% ethanol (v/v)
are shown in Figure 1. Ascorbic acid is a lactone with a
O
O
OH HO
H HO
OH
3 2
2,3-endiol group (Scheme 1). The enolic group imparts acidity to the molecule which is at positions 2 and 3. The first step was clearly observed in the potentiometric curve (Figure 1) which relating to the enol group at position 3
(the meta position to the carbonyl group). The second step
was not clearly seen as expected and it is related to the
enol group at position orto to carbonyl (position 2).3 In
addition, Figure 2 shows the electronic spectral changes of ascorbic acid in the pH range 2.0-12.0 at ionic strength
of 1.0 mol dm-3 NaClO
4. When an alkali solution was
added to the acidic aqueous solution of ascorbic acid, the absorption spectrum is shifted to upper wavelengths with an important modification. Such that the absorption band at 245 nm progressively decreases to lower values by increasing pH with a concomitant appearance of a new peak at 265 nm which gradually increased from pH ca. 2 to its highest intensity at alkaline pH. The notable changes in the absorption spectrum of ascorbic acid as a function of pH are attributed to the formation of various protonated species whose light absorbing characteristics differ from each other.
Table 1. The experimental values of cell potential, Ecell, as a function of the added volume of sodium hydroxide, VNaOH, for the combined glass electrode
calibration and protonation titration of ascorbic acid at 25.0 °C and 1.0 mol dm-3 aqueous ethanol mixture (1:1) of NaClO 4
Combined glass electrode calibration titrationa
Vb / mL Ec / mL Vb / mL Ec / mL Vb / mL Ec / mL Vb / mL Ec / mL
0.00 268.0 0.15 265.3 0.30 262.3 0.45 259.1
0.05 267.1 0.20 264.3 0.35 261.3 0.50 258.0
0.10 266.3 0.25 263.3 0.40 260.2
Protonation titrationd
0.000 257.2 1.3060 135.3 1.3259 −33.5 1.5039 −243.3
0.300 250.0 1.3100 129.2 1.3299 −62.8 1.6039 −254.8
0.700 234.4 1.3150 110.2 1.3329 −75.7 1.8039 −268.9
0.900 223.3 1.3180 99.0 1.3374 −115.7 2.1539 −282.1
0.980 216.3 1.3200 84.3 1.3409 −134.1 2.7539 −293.6
1.020 212.2 1.3213 56.0 1.3449 −146.1 3.5539 −302.1
1.080 203.9 1.3219 36.4 1.3499 −163.0 4.5539 −308.3
1.135 192.7 1.3222 15.1 1.3559 −169.6 6.5539 −314.7
1.175 180.8 1.3223 2.5 1.3639 −183.8 9.0539 −319.8
1.203 168.3 1.3225 −4.3 1.3739 −189.3
1.220 156.9 1.3229 −8.5 1.3989 −211.0
1.300 148.1 1.3239 −22.3 1.4389 −227.7
aInitial volume of titer: 20 mL, titer: HCl (0.01 mol dm-3), titrant: NaOH (0.20 mol dm-3); badded volume of sodium hydroxide; cexperimental values of
cell potential; dinitial volume of titer: 20.70 mL, titer: ascorbic acid (4.83 × 10⁻⁵ mol dm-3), titrant: NaOH (0.20 mol dm-3).
0 2 4 6 8 10 12 14
pH
VNaOH/ mL
VNaOH/ mL -400
-300 -200 -100 0 100 200 300
0 1 2 3 4 5 6 7 8 9
0 1 2 3 4 5 6 7 8 9
10 10
Ece
ll
/ mV
Figure1. Plots of potentiometric titration of 4.83 × 10⁻⁵ mol dm-3 ascorbic
acid with 0.20 mol dm-3 NaOH at ionic strength of 1.0 mol dm-3 NaClO 4
medium and 25.0 °C.
0 0 2. 0 4. 0 6. 0 8. 1 1 2. 1 4.
210 230 250 270 290 310
A
b
so
rb
an
ce
/
a.
u
.
Wavelength/ nm pH = 2
pH = 12
pH = 12 pH = 2
Figure 2. The absorbance spectrum changes of ascorbic acid in the pH ranges 2.0-12.0 at ionic strength of 1.0 mol dm-3 NaClO
4 medium and
The protonation constants of ascorbic acid were calculated by processing the UV-Vis spectrophotometric titrations data using the computer program STAR (stability constants by absorbance reading). The STAR program uses multi-linear regression for the refinement of equilibrium constants of systems with up to 5 components, which
form up to 25 species.14 It can work with up to 50 different
spectra, measured at 50 different wavelengths. In this program, the refinement of equilibrium constants is done using the Gauss-Newton non-linear least-squares algorithm, until a minimum value in the sum of squares residuals (SSR) between the calculated and the experimental data of the spectrophotometric titration spectra is obtained with equation 1:
2
1 1
( )
s w n n
i, j,exp i, j,cal i j
SSR A A
= =
=
∑∑
− (1)where ns and nw are the number of solutions and the
number of wavelengths, respectively. Ai,j,exp and Ai,j,cal are
the experimental and calculated absorbance values for
the wavelength j in the spectrum i. The values of Acal are
obtained in three steps: the program first solves the mass balances for each spectrum according to the guessed equilibrium constants and experimental conditions; then, a multiple linear regression procedure is applied in order to determine the molar absorbances of each unknown species, and finally the individual absorbance values are re-calculated from the guessed species concentration and the corresponding molar absorbances. The minimization process was repeated until the relative change of RSS
between two iterations is less than 0.01%.15
Results and Discussion
Calibration of glass electrode cell
Prior to each UV-Vis spectrophotometric titration, the potentiometric cell was calibrated to evaluate the pH of the solution based on the concentration scale from calibration constants obtained at each of ionic strengths tested. The calibration constants were computed from the
Nernst equation knowing the exact concentration of H+ in
each titration point.16 According to the Nernst equation,
the potential of a potentiometric cell equipped by a glass electrode can be written as equation 2:
Ecell = E°cell + k(log [H+] + log γH+) + ELJ (2)
where ELJ is the liquid junction potential, k (the Nernstian
slope) = 2.303RT / F in which R, T and F are the universal gas
constant, the absolute temperature and the Faraday constant,
respectively. γH+ is the activity coefficient of hydrogen ion.
Because the ionic strength of the solution is kept constant for each experiment, the activity coefficient of hydrogen ion is constant too. The non-ideality of solutions is then included
in Ea (the pseudo-Nernstian standard potential), and thus:
Ecell = Ea + klog [H+] (3)
where Ea being E°cell + klog γH+ + ELJ. The hydrogen ion
concentration can be easily calculated by:
[H+] = (C
HClV0 – CNaOHVad) / (V0 + Vad) (4)
where CHCl and CNaOH are the molar concentrations of
HCl and NaOH, V0 and Vad are the initial volume of
acidic solution (titer) and the added volume of sodium hydroxide solution (titrant) at each point, respectively.
The Ea values were calculated from the recorded Ecell and
known concentration of solvated proton in every titration point by linear regression analysis. For each experiment at constant ionic strength, the slopes obtained from least squares analysis were close to the theoretical Nernst value
(59.167 mV at 25.0 °C) with correlation coefficients greater
than 0.99. The calibration constants (Ea and k) obtained for
the combined glass electrode at working mixtures are given in Table 2. The calibration constants were used to correct the recorded values in millivolt (E) during titration into the
pH scale, pH = −log [H+], as follows:
pH = (Ea – Ecell) / k (5)
As shown in Table 2, the Ea values increase with
increasing the electrolyte concentration used. This is possibly due to the dependence of the activity coefficient of hydrogen ion on ionic strength based on the equation
Ea = E°cell + klog γH+ + ELJ, which parameters are already
described.
Calculation of protonation constants
The pKa values of ascorbic acid (in the molal
concentration scale) were calculated by the STAR
Table 2. The calibration constants obtained for the combined glass pH electrode in different ionic strengths of NaClO4 aqueous ethanol solution
(1:1) at 25.0 °C
Ia / (mol kg-1) 0.101 0.513 1.051 2.212 3.503
kb 59.78 58.99 59.07 59.42 59.92
Eac / mV 382.70 381.17 386.10 397.30 465.70 aI: ionic strength; bk: the Nernstian slope; cEa: pseudo-Nernstian standard
computer program in different aqueous ethanol solutions
(1:1) of NaClO4 (0.1-3.0 mol dm-3). The STAR gives a
series of statistical characteristics to test the reliability of the fitting process which are valuable when several chemical models are compared for a given system. These statistical parameters include the kurtosis, skewness tests. The kurtosis test is the measure of the peakedness of the error distribution near a model value. For an ideal normal distribution of residuals, kurtosis value should be three. The skewness test shows shape of the error distribution profile
and its values should be equal to zero.14 The experimental
protonation constants of ascorbic acid along with some of the important statistical parameters are listed in Table 3. The dependence of these constants on ionic strength show
a regular trend and the pKa values (Table 3) agree fairly
well with findings reported previously in the literature,3,17-19
after allowing for changes in experimental conditions as
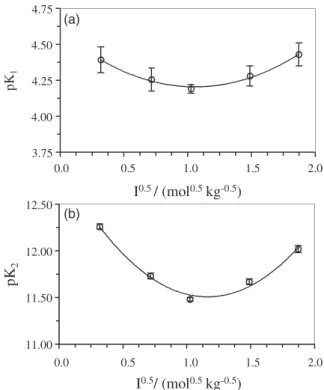
well as methods of calculation. The experimental pKa
values (Table 3), determined in NaClO4 aqueous ethanol
solutions (1:1) with different concentrations are shown as
a function of the square root of ionic strength (in mol kg-1)
in Figure 3. As it can be seen in this figure, the pKa values
of ascorbic acid are nearly always at their minimum at
an ionic strength range around 0.3-0.9 mol kg-1, which
is a characteristic of dependence on ionic strength of the protonation constant. According to the electrolyte solutions at low ionic strength, the dependence accounts for the Coulomb interaction between the ions that are screened by the ion atmosphere, while at higher concentrations the dependence accounts for the disturbances in ion-solvent
interactions.20,21 In other words, at low ionic strength
(< 0.1 mol kg-1) the Coulomb interactions are of primary
importance. However, as the ionic strength increases, the ionic atmosphere becomes more compressed and screens the ionic charges more effectively, so the intermolecular
interactions (dipole-dipole or even multipole-multipole) become more important. These forces at higher ionic strength possibly have a primary role between the ions.
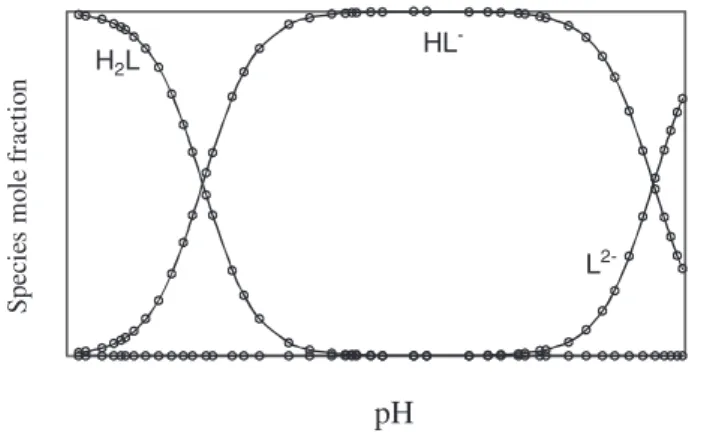
In Figure 4 the equilibrium distribution of various
species of ascorbic acid in ionic strength of 1.0 mol dm-3
NaClO4 is shown as a function of pH.
The thermodynamic functions ∆G0 (standard Gibbs free
energy change) associated with the protonation process of ascorbic acid studied have also been calculated in different
ionic strengths of NaClO4 according to the following
equation:
Table 3. The pKa values of ascorbic acid in different ionic strengths of NaClO4 aqueous ethanol solution (1:1) at 25.0 °C
Ia / (mol kg-1) Ia / (mol kg-1) pK
1b / (mol kg-1) pK2b / (mol kg-1) Kurtosis test Skewness test Reference
0.1 0.101 4.39 ± 0.09c 12.26 ± 0.03c 8.4 −0.67 present work
0.5 0.513 4.26 ± 0.08 11.73 ± 0.03 5.2 0.16 present work
1.0 1.051 4.19 ± 0.03 11.48 ± 0.02 7.1 0.6 present work
2.0 2.212 4.28 ± 0.07 11.67 ± 0.03 7.5 0.36 present work
3.0 3.503 4.43 ± 0.08 12.02 ± 0.04 6.8 0.79 present work
0.1 mol dm-3 in water 4.05 11.81 17
0.2 mol dm-3 in water 4.16 11.73 18
1.0 mol dm-3 in water 4.20 11.36 3
3.0 mol dm-3 in water 4.37 11.34 19
aI: ionic strength; bK
1 and K2 refer to the stepwise protonation equilibria of HA− and A2−, respectively (where A2− represents the fully deprotonated ascorbic
acid); cstandard deviation.
3.75 4.00 4.25 4.50 4.75
pK
1
I / (mol0.5 0.5kg-0.5)
0.0 0.5 1.0 1.5 2.0
11.00 11.50 12.00 12.50
0.0 0.5 1.0 1.5 2.0
pK
2
I / (mol0.5 0.5kg-0.5)
(a)
(b)
Figure 3. Plots of (a) pK1 and (b) pK2 (in molal scale) of ascorbic acid
∆G0 = 2.303RTpK
a (6)
where R represents the gas constant (8.31451 J K-1 mol-1),
T stands for absolute temperature (298.15 K), and pKa is
dissociation constant for the compound studied (Table 3).
The functions ∆G0 of ascorbic acid protonation reaction
in different ionic strengths (0.1-3.0 mol dm-3 NaClO
4) are listed in Table 4. Unfortunately, there is no value reported
in the literature for comparison. The positive values of ∆G0
for the proton dissociation processes of ascorbic acid denote that the processes are not spontaneous.
Modeling of ionic strength effect
The general stepwise reaction for protonation equilibria can be expressed by:
HnA(z-n)-⇌ Hn−1A(z-n+1)- + H+ (7)
where species HnA (n= 2) indicates the full protonated
form of ascorbic acid and the charge z is formally = 2. A
stepwisethermodynamic dissociation constants Kn for these
equilibria is given by:
+ (z-n+1)- +
(z-n+1)-n-1 n-1
(z-n)-
(z-n)-n n
(z-n+1)-H H A 0 H H A n-1
n (z-n)- n n H A H A
[H ][H A ] [H A]
K K
+
= γ γ = γ γ
γ γ (8)
where γi is activity coefficient of species i, and Kn0 refer
to the protonation constant, expressed as a concentration quotient, at infinite dilution in a particular medium. By taking negative logarithms on equation 8:
+
(z-n)-(z-n+1)- n
Hn-1A 0
n n H H A
pK =pK −logγγ −logγ +logγ (9)
The determination of pKn0 value requires that the activity
coefficient values are known. The activity coefficient of species can be expressed by the specific ion interaction theory (SIT). The SIT model was first outlined by Brönsted
and later elaborated by Guggenheim and Scatchard.9,22-26
Due to its simplicity, it can still be considered as one of the most popular prediction strategies in solution chemistry. In original SIT model, activity coefficient of ion i with charge
zi can be expressed by equation 10 in the solution of ionic
strength Im(in molal scale) at 25.0 °C:
2
log
1
m
i i ij j
j m
A I
z m
aB I
= − +
+
∑
γ ε (10)
where A is the Debye-Huckel limiting law slope
(0.509 kg0.5 mol-0.5), aB is an empirical constant involving
the mean distance of closest approach of ions from the
Debye-Huckel limiting law (1.5 kg0.5 mol-0.5). The ion
interaction coefficient εij, usually called SIT parameter,
interprets the specific short range non-electrostatic
interactions of ion ith with ion jth in its molal concentration
mj. The SIT model assumes that interaction coefficient
is zero for two electrically like sign ions or neutral species (this is the Brönsted principle of specific ionic interaction). Although SIT parameters are approximately considered to be constant for some ionic media in
0.500 ≤ Im≤ 3.500 mol kg-1, however literature indicate
that they are function of I at lower and higher ionic
strength.27 An expertise group in Italy modified the SIT
model and introduced dependence on ionic strength of ε
as following term:28
0
1
∞ ∞
−
= +
+I
ε ε
ε ε (11)
where ε0 and ε∞ parameters take into account the dependence
of SIT parameters on medium ionic strength and are the
values of ε for I→0 and I→∞, respectively.
By considering the modified SIT model for calculation
of activity coefficients of species in NaClO4 as supporting
electrolyte, equation 9 can be reformulated as follows:
Table 4. The standard Gibbs free energy changes of protonation of ascorbic acid at 25.0 °C and various ionic strengths of NaClO4 aqueous
ethanol solution (1:1)
Ia / (mol kg-1) ∆G0
1b / (kJ mol-1) ∆G02b / (kJ mol-1)
0.101 25.08 69.99
0.513 24.29 66.97
1.051 23.92 65.54
2.212 24.43 66.62
3.503 25.29 68.62
aIonic strength; bstandard Gibbs free energy, uncertainties in the ∆G0’sare
equal to the corresponding pKa values.
S
p
ec
ie
s
m
ol
e
fr
ac
tio
n
pH
H L2
HL
L
-
2-Figure 4. Distribution diagram of the different species of ascorbic acid as a function of pH at 25.0 °C and ionic strength 1.0 mol dm-3 NaClO
0 *
n n
p p
1
m
m m
A I
K K z I
aB I
= + − ∆
+
ε (12)
where
* 2 2
products reactants
(charges) (charges)
z =
∑
−∑
(13)(z-n+1)-
(z-n)-n-1 4 n
H A ,Na+ H ,ClO+ − H A ,Na+
∆ε =ε +ε −ε (14)
It should be noted that pKa and Im values are in molal
concentration scale; for n = 2 in (z-n)
n
H A −,Na+
ε , i.e., for neutral
full protonated ascorbic acid, ε was considered zero, also
all SIT interaction coefficients were defined ionic strength dependency by using equation 11.
Experimental pKa values listed in Table 3 were fitted into
equation 12 as a function of ionic strength by least-squares regression analysis. The results of the SIT calculations of our data are given in Table 5. The goodness of fit of SIT model was judged by the square correlation coefficient, associated with values of the error least-square sum on the
fitting of the experimental pKa and the calculated one (σfit).
Ion interaction coefficients of Na , Hn-1A( 1)
0
z n
+ −+−
ε and
( 1) n-1
Na ,H+ Az n−+ − ∞
ε
were calculated according to values of SIT parameters of
HClO4 ( 4
H ,ClO
0 0.062
ε + −
= and εH ,ClO4 0.167
+ −
∞ = ) reported in
literature.28 In addition, the values of ∆G
00 (standard Gibbs
free energy change at infinite dilution) for protonation of
ascorbic acid are calculated based on pKn0 obtained from
SIT model by equation 6 and are given in Table 5.
As shown in Table 5, the ε interaction coefficients of the
Na+ cation with deprotonated ascorbic acid species for first
protonation step are lower than those obtained in second step. Such trend for the interaction coefficients can be explained by taking into account this fact which the greater
ε possibly causes the stronger interaction of the species,
and hence a greater protonation constant in the supporting electrolyte. This result is also observed from concavity of the curves given in Figure 3.
Conclusions
The dissociation equilibria of biological compound ascorbic acid were investigated by a combination of UV/pH
titration methods in a wide range of ionic strength
supplied by sodium perchlorate (0.1-3.0 mol dm-3) at
temperature 25.0 ± 0.1 °C. Organic co-solvent (50% ethanol) together water has been used as a reaction medium
for this investigation. The pKa values were calculated by
multivariate curve fitting of spectral data implemented
in STAR program. The results show that the pKa values
of ascorbic acid are influenced by the ionic strength of medium. The SIT approach was applied successfully to
model the ionic strength dependence of pKa values. As a
matter of fact, the information about the proton dissociation
is important and widely useful. For instance, the first pKa
value of ascorbic acid is around 4.0, the anions derived from proton dissociation will dominate in natural system (occurrence > 99.5%). Therefore, ascorbic acid as a phenolic antioxidant (ArOH), may exert its antioxidant activity (free radical scavenging role) via H-atom donation mechanism in acidic solution while the same activity is done by means of electron donation mechanism in natural and alkaline media.
Acknowledgments
The authors gratefully acknowledge the Damghan University for facilitating the equipment and laboratories used.
References
1. Demianenko, E.; Ilchenko, M.; Grebenyuk, A.; Lobanov, V.; Tsendra, O.; J. Mol. Model.2014, 20, 2128.
2. Dimitrova, Y.; Spectrochim. Acta, Part A2006,63, 427. 3. Thakur, U. K.; Shah, D. J.; Sawant, R. M.; Ramakumar, K. L.;
J. Chem. Eng. Data 2010,55,308.
4. Jaiswal, P. V.; Ijeri, V. S.; Srivastava, A. K.; Colloids Surf., B
2005,46, 45.
5. Kurl, S.; Tuomainen, T. P.; Laukkanen, J. A.; Nyyssonen, L. T.; Sivenius, J.; Salonen, J. T.; Stroke2002, 33, 1568.
6. Chan, J.; Vogel, S. M.; Wen, J.; Alany, R. G.; J. Pharm. Biomed. Anal. 2009,50,86.
7. Sanli, S.; Altun, Y.; Guven, G.; J. Chem. Eng. Data 2014, 59, 4015.
Table 5. Results of SIT analysis on pKa values of ascorbic acid in different ionic strengths of NaClO4 aqueous ethanol mixture (1:1) at 25.0 °C
n pKn0
∆G0
0na/
(kJ mol-1) ∆ε0b ∆ε∞b
( 1) n-1
Na , H L 0
z n
+ −+−
ε c Na ,Hn-1L(z n1)
+ −+−
∞
ε
c
σfitd r2e
1 4.64 ± 0.02 26.47 −0.219 0.171 −0.281 0.004 0.0004 0.988
2 12.83 ± 0.03 73.24 −1.467 0.496 −1.811 0.332 0.003 0.991
aStandard Gibbs free energy; bthe difference of specific coefficients; cspecific interaction coefficient of ions; dvalues of the error least-square sum on the
8. Dogan, A.; Kilic, E.; Anal. Biochem. 2007,365, 7.
9. Gharib, F.; Jabbari, M.; Farajtabar, A.; J. Mol. Liq. 2009,144, 5.
10. Jabbari, M.; Gharib, F.; Acta Chim. Slov. 2010,57,325. 11. Jabbari, M.; Gharib, F.; J. Solution Chem. 2011,40, 561. 12. Jabbari, M.; J. Mol. Liq. 2015,208, 5.
13. Pehrsson, L.; Ingman, F.; Johansson, A.; Talanta 1976,23, 769. 14. Beltran, J. L.; Codony, R.; Prat, M. D.; Anal. Chim. Acta 1993,
276, 441.
15. Sanli, S.; Sanli, N.; Alsancak, G.; J. Braz. Chem. Soc. 2009, 20, 939.
16. Gans, P.; O’Sullivan, B.; Talanta 2000,51, 33.
17. Cox, B. G.; Jedra, W.; Palou, J.; J. Chem. Soc., Dalton Trans.
1988,733.
18. Kriss, E. E.; Kurbatova, G. T.; Zh. Neorg. Khim. 1976,21, 2368. 19. Wahlberg, O.; Acta Chem. Scand. 1971, 25, 1045.
20. Beck, M. T.; Nagypal, I.; Chemistry of Complex Equilibria; Ellis Horwood Limited: New York, 1990.
21. Berry, R. S.; Rice, S. A.; Ross, J.; Physical Chemistry; John Wiley & Sons: New York, 1980.
22. Bronsted, J. N.; J. Am. Chem. Soc. 1922,44,877. 23. Guggenheim, E. A.; Philos. Mag. 1935,19, 588. 24. Scatchard, G.; Chem. Rev. 1936,19,309.
25. Bretti, C.; de Stefano, C.; Foti, C.; Sammartano, S.; Vianelli, G.; J. Chem. Thermodyn. 2012,44, 154.
26. Jabbari, M.; Zhiani, R.; Farajtabar, A.; J. Chem. Sci.2015, 127, 1067.
27. Pitzer, K. S.; Activity Coefficients in Electrolyte Solutions, 2nd ed.; USA CRC Press Inc: Boca Raton, 1991.
28. Bretti, C.; Foti, C.; Porcino, N.; Sammartano, S.; J. Solution Chem. 2006,35, 1401.
Submitted: October 22, 2015