O
RIGINALA
RTICLE Revista Brasileira de FisioterapiaTotal hip arthroplasty in the elderly:
impact on functional performance
Artroplastia total de quadril em idosos: impacto na funcionalidade
Rita C. Guedes1, João M. D. Dias2, Rosângela C. Dias2, Viviane S. Borges3, Lygia P. Lustosa1, Nayza M. B. Rosa3
Abstract
Objectives: To compare gait and functional performance parameters in elderly subjects who had or had not total hip arthroplasty (THA).
Methods: Our sample comprised 23 elderly subjects (72±6.5 years of age) with a mean of 2.6±1.3 years following THA, named the
ar-throplasty group (AG) and 23 asymptomatic elderly subjects (70.1±5.9 years of age), named the control group (CG). Case and control subjects were paired by gender, age, body mass index and level of physical activity. The GAITRite® system was used to analyze
vari-ous gait parameters in four situations: usual speed (US), fast speed (FS), slow speed (SS) and dual task (DT); the Dynamic Gait Index (DGI) and Timed Up and Go test (TUG) methods were used to evaluate functional capacity. The statistical analyses were carried out using the Shapiro-Wilk test, Student’s-t-tests for independent samples, chi-square tests, ANOVA for repeated measurements and paired
Student’s-t-tests. Results: The AG had the worst results for gait speed (AG=1.18±0.13 and CG=1.39±0.09; p=0.012), symmetry index (SI) of step length (AG=3.60±1.01 and CG=1.12±0.59; p=0.000), SI of step time (AG=-2.65±0.92 and CG=0.99±0.74; p=0.000), SI of stance phase (AG=-2.55 and CG=-1.04±0.50; p=0.005), SI of single support phase (AG=-2.17±0.78 and CG=1.21±0.51; p=0.003),
DGI (AG=20.04±1.91 and CG=21.69±1.45; p=0.001) and TUG (AG=14.67±1.94 and CG=10.08±1.49; p=0.001). Conclusion: Elderly subjects with a history of THA had changes in gait parameters and lower performance in TUG test even 2.6±1,3 years after surgery, which suggests functional impairment.
Keywords: aged; osteoarthritis; hip; arthroplasty; gait.
Resumo
Objetivos: Comparar os parâmetros da marcha e o desempenho funcional de idosos com e sem artroplastia total de quadril (ATQ).
Métodos: Foram selecionados 23 idosos (72±6,5 anos) após média de 2,6±1,3 anos de ATQ e 23 idosos assintomáticos (70,1±5,9 anos), pareados por gênero, idade, índice de massa corpórea (IMC) e nível de atividade física. Utilizou-se o sistema GAITRite® em
quatro situações distintas: velocidades habitual (VH), rápida (VR), lenta (VL) e tarefa dupla (TD). A capacidade funcional foi avaliada pelo Dynamic Gait Index (DGI) e Timed Up and Go (TUG). Na análise estatística, utilizaram-se os testes Shapiro-Wilk, t-Student
para amostras independentes, Qui-quadrado, ANOVA com medidas repetidas e t-Student pareado. Resultados: O grupo artroplastia (GA) apresentou piores resultados estatisticamente significantes no que se refere à velocidade de marcha (VM) (GA=1,18±0,13 e GC=1,39±0,09; p=0,012), índice de simetria (IS) do comprimento do passo (GA=3,60±1,01 e GC=1,12±0,59; p=0,000), IS do tempo do passo (GA=-2,65±0,92 e GC=0,99±0,74; p=0,000), IS da duração da fase de apoio (GA=-2,55 e GC=-1,04±0,50; p=0,005), IS da duração da subfase de apoio único (GA=-2,17±0,78 e GC=1,21±0,51; p=0,003), DGI (GA=20,04±1,91 e GC=21,69±1,45; p=0,001)
e TUG (GA=14,67±1,94 e GC=10,08±1,49; p=0,001). Conclusão: Idosos com ATQ apresentaram alterações nos parâmetros da marcha, mesmo após 2,6±1,3 anos de cirurgia, e pior desempenho no teste TUG, indicando comprometimento funcional.
Palavras-chave: idoso; osteoartrite; quadril; artroplastia; marcha.
Received: 30/03/2010 – Revised: 10/08/2010 – Accepted: 03/09/2010
1 Centro Universitário de Belo Horizonte (UNI-BH), Belo Horizonte, MG, Brazil
2 Physical Therapy Department, Universidade Federal de Minas Gerais (UFMG), Belo Horizonte, MG, Brazil 3 Physical Therapist
Correspondence to: Rita de Cássia Guedes, Rua Vitório Magnavacca, 156/702, CEP 30455-730, Belo Horizonte, MG, Brasil, e-mail: [email protected]
Introduction
Total primary hip arthroplasty (THA) is a surgical proce-dure that is widely used for the treatment of hip osteoarthritis1.
here are no statistics available concerning the number of THAs currently being performed in Brazil, but it is estimated that in 2026, the number of THAs performed in Brazil annually will be about 572,000, at a total cost of 15 billion US dollars2.
he most common indication for THA is the presence of severe pain3 accompanied by functional limitation14. THA is one of the
most successful orthopedic surgeries, with satisfactory results such as pain relief and physical functional improvement, which allows the subject to return to his/her activities of daily living (ADLs)5.
Gait assessment is an important measure of postopera-tive outcomes after THA because gait is an important indi-cator of functional recovery5,6. An individual’s independence
is directly related to his/her ability to adjust gait according to his/her daily demands in varying environments such as walking at different velocities and on different surfaces, which are often associated with tasks that require intensive attention6.
Gait modiications are expressed in temporal and spatial measures, such as gait speed (GS) and step length, and on the duration of the balance and stance phases of the gait6,7.
How-ever, there is no consensus in the literature about the contin-ued improvement in gait after THA. Some studies show that gait worsens over time5,8, while others show improvement in
these parameters after arthroplasty6,9.
Kyriasis and Rigas8 compared the gait parameters of
sub-jects in four distinct groups walking at usual and fast speeds (US and FS): before THA, one year THA, 10 years post-THA and in subjects who had not undergone post-THA. he authors observed that the post-THA participants improved their gait parameters over time, but their gait always remained worse than that of subjects in the control group (CG). Bennett etal.5
performed three-dimensional gait analysis of older adults ten years after THA, comparing them with asymptomatic older adults. he variables analyzed were GS, cadence, step length and duration of the stance phase of gait, and they observed that the subjects showed signiicant impairment in these pa-rameters, suggesting that muscle atrophy and residual stif-ness could inluence gait, even several years after surgery.
In contrast, Van Den Akker-Scheek et al.6 evaluated the gait
of a group of subjects before, six weeks after and six months after THA and observed an improvement in GS, length and duration of the step after six months. Similarly, Rasch, Dalén and Berg9 analyzed the gait of 20 older subjects before, six
months after and two years after THA, and prior to surgery, they identiied a shorter phase of single support in the limb
with hip osteoarthritis compared to the contra lateral limb. Six months after surgery, subjects had resumed gait patterns that were close to normal.
In this context, due to the lack of consensus regarding the recovery of a normal gait pattern after THA, the goals of the present study were to compare temporal and spatial gait pa-rameters of older adults with and without THA in casual gait situations, with increases and decreases in velocity and with the gait associated with a cognitive task and also to compare the functional performance of elderly individuals who had and had not undergone THA.
Methods
Sample
After taking into account the sampling calculations based on gait parameters from previous studies that used the gait analyzing system GAITRite®10-12, we used a convenience sample
to recruit 46 community-dwelling elderly subjects of both gen-ders. he arthroplasty group (AG) comprised 23 subjects who had undergone THA with cemented prosthesis and posterolat-eral approach. he control group (CG) comprised 23 subjects with no history of THA.
Individuals were excluded from this trial if they met one of the following criteria: history of other orthopedic surgical procedures in the lower limbs (LLs) or vertebral spine; com-plaint of pain in the LLs not related to THA; physical therapy in the three months before data collection; diferences in LL length that were not corrected and were above 1,5 cm; severe balance impairment, neurological, cardiovascular, or musculoskeletal decompensate diseases that prevented the execution of the tests; and suggestive cognitive impairment, indicated by the Mini-Mental State Exam13. he older adults
in the CG met the same selection criteria, except they had not undergone THA. To make the two groups comparable, we paired subjects by gender, age, body mass index (BMI) and level of physical activity. his study was approved by the Ethics Committee of Research from the Universidade Federal de Minas Gerais (UFMG), Belo Horizonte, MG, Brazil, under the protocol nº ETIC 586/08, and all the participants signed a voluntary informed consent statement.
Instruments
Gait parameters were analyzed using the GAITRite®
(MAP/CIR INK, Haverton, PA, USA) system, which consists of an
electronic rubberized rug that registers plantar pressures, al-lowing the calculation of temporal and spatial gait data10. his
rug is 90 cm wide by 566 cm long and 0.6 cm thick, with 18.824 built-in pressure sensors. he system also has data analysis and documentation software for nine temporal and six spatial pa-rameters of gait. A large number of studies have documented the validity and reliability of its measures in comparison with other techniques, including studies with older adults10-12.
Functional performance was evaluated using the Dynamic Gait Index (DGI)14, which is composed of eight functional tasks
involving gait with diverse contexts of sensitivity, including walking on a lat surface, changes in GS, head movements, stepping over and around exercises, rotating on the body axis, climbing and descending stairs. he scores range from 0 to 24 points and higher scores indicate better functional perfor-mance. his instrument was developed by Shumway-Cook and Woolacott15 and was further adapted to a Brazilian population
by De Castro, Perracini and Ganança14. he DGI is capable of
identifying subjects with balance impairments, and ofers use-ful measures to identify gait changes16.
For functional assessment, we also used the Timed Up and Go (TUG) test, which is a measure of mobility with good levels of inter- and intra-rater reliability (CCI 0.99)17,18. Because this
test evaluates a series of maneuvers used in daily routines, it has good correlation with balance measures, GS and functional abilities. TUG allows for the assessment of sitting balance, the change from sitting to standing positions, and stability during the gait and on gait course19.
he Physical Activity Trends (PAT) questionnaire is used to classify a subject’s level of physical activity based on the type of activity, its frequency and duration. he subject’s activity level is categorized as “inactive”, “insuicient”, “moderate” and “vigorous”20. he PAT was illed out by the researcher.
Procedures
Subjects in the AG were recruited by telephone from a cohort of patients who had undergone THA in a hospital of the public health system, and the CG was selected in univer-sity extension projects for asymptomatic elderly and through spontaneous request for participation made after divulgation of the study purpose.
We used a questionnaire to collect personal and clinical data. he questionnaire was created for this research and aimed to characterize the participants and categorize their level of physical activity using the PAT20. After completing the
questionnaire, subjects were evaluated using the functional tests DGI and TUG, and the analysis of gait was performed us-ing the GAITRite® system. he assessment was performed in a
single day, with an interval of at least ive minutes between the measures to minimize possible efects of muscular fatigue. he
order of the performance of the tests was random, and all of the tests were done by the same evaluator.
As determined in a pilot study, the participants were oriented to walk on the GAITRite® in four distinct test
situ-ations6, completing six turns in each situation: 1) walking at
their usual speed (US); 2) walking as fast as possible with-out running (FS); 3) walking as slow as possible (SS) and 4) walking as usual while making mathematical calculations, a situation named dual task (DT)6,21,22. To avoid the inluence
of acceleration and deceleration, subjects initiated gait from a point located two meters before the rug and stopped at a point located two meters after the rug. Both points were marked with a cone.
Data reduction
Spatial and temporal gait parameters were obtained through speciic software using the GAITRite® system through
which we also determined the normalized speed by dividing the speed by the mean length of the LL23. Data relative to the
normalized speed, cadence, step duration, step length and the duration of stance and single support were registered for each subject. he mean of each of these parameters was used for the statistical analysis.
To process the gait data, the symmetry index (SI)24 was
calculated for the step length, step duration and duration of stance and single support phases of gait. he SI consists of a measure that compares any parameter between the operated limb (OPL) and the non-operated limb (NOL) through the fol-lowing equation, in which X is the mean of the parameter:
SI XOPL XNOL
XOPL XNOL x
0 5. ( ) 100%
Values of SI equal to zero indicate a perfect symmetry be-tween the limbs. Negative values indicate that OPL parameters are shorter than those from the NOL, and positive values in-dicate longer parameters for the OPL. For the group of older adults without THA (i.e., CG), OPL was referred to as the non-dominant LL and NOL was referred to as the non-dominant LL24.
Statistical analysis
he analysis of data normality was performed through the Shapiro-Wilk test. For the comparison between groups, Student’s-t-tests were used for independent samples in the case of continuous data, and the chi-square test was used for categorical data. For the comparisons between the LL of the subjects with THA, the paired Student’s-t-test was used, and for the comparisons between the four test situations of each
group, ANOVA was used for repeated measures with multiple comparisons done using Tukey’s test. he level of signiicance was set at α=0,05. Data were analyzed using SPSS, version 17.0, in a Windows environment.
Results
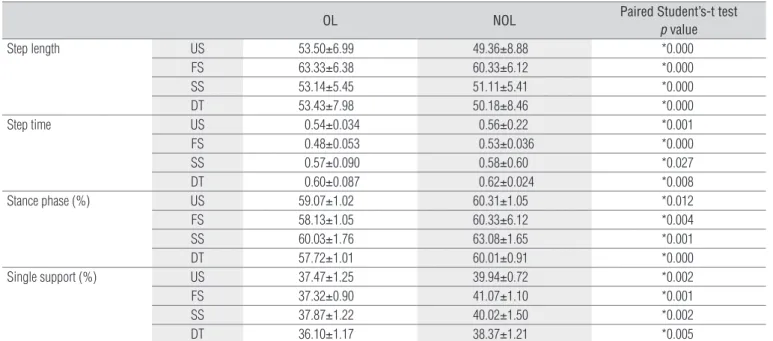
Participants included 46 older adults, of whom 23 had un-dergone THA (AG) and 23 had not (CG). In terms of clinical and demographic characteristics, there were no signiicant diferences between groups in terms of age, gender, BMI or level of physical activity (Tables 1 and 2). When comparing the OPL and the NOL from AG subjects, we observed a signiicant diference in the four distinct test situations, with longer step length, shorter step duration, shorter duration of the stance and single support phases in the OPL. he results are presented in Table 3.
In the comparison between AG and CG subjects, we ob-served a lower GS in AG subjects, in addition to a greater SI of the step length, step duration and duration of the stance phase and the single support phase. he AG subjects presented a longer mean time on TUG and lower mean scores on DGI (Table 4). We also observed statistically signiicant diferences between the diverse test situations within each group and be-tween both groups, except when comparing the situation SS with DT (Table 5).
Discussion
his study aimed to evaluate gait parameters in distinct test situations and the functional performance of a group com-prised of older adults with a mean of 2.6±1.27 years since THA and another group of older adults without a history of THA. he results show diferences between groups, with a worse performance for the AG subjects on both gait parameters and functional tests. When gait parameters were compared be-tween the LLs of the AG subjects, the diferences were statisti-cally signiicant.
Analyses of gait parameters after THA have been discussed in the literature, which includes a variety of studies done in dis-tinct postoperative periods. Some authors have assessed the gait of subjects post-arthroplasty after 11 days25, four weeks26,
six months27, one year9 and ten years8, observing
modiica-tion to GS8,25, step length9,26 and duration of the stance phase
of the gait8,27. he variations in the period post-THA in these
studies demonstrate a lack of agreement regarding the post-surgical period in which gait pattern modiications are most evident. Data from the present research indicated a mean time of 2.6±1.7 years after THA and suggest the permanence of gait alterations. his postoperative time interval allowed for an as-sessment without the inluence of cicatrization and also char-acterized a stage when subjects had already adapted to their new condition with the prosthesis. he older adults from the AG and CG reported absence of pain on the day of data collec-tion. However, the results suggest that, although the prosthetic joint was able to receive load, the participants did not perform their functions normally.
GS is one of the most often used parameters of gait as-sessment, due not only to its functional relevance but also to its easy evaluation5,6. he diverse methods described in
the literature to assess GS allow for gait evaluation in a form similar to typical environmental demands and daily tasks6. A
study from Sicard-Rosenbaum, Light and Behrman28
identi-ied mean values of US and FS similar to those found in the present study, both for the group with THA (US=1.1 m/s and FS=1.5 m/s) and for controls (US=1.30 m/s and FS=1.80 m/s). Although the population evaluated by the authors was younger (60.2±15.0 years), the length of the postoperative period was similar to that used herein (23.6±14.8 months). Similarly, our results are consistent with those of Perron et al.29, who concluded that the GS of older adults after a period
of two to four years after THA remained 15 to 25% below the values of the CG. In the present study, the observed values for the AG were lower than those for the CG, with reductions of 16% on US, 19% on FS, 14% on SS and 13% on DT. It is valuable to note that GS is related to independence on ADLs21, risk of
falls6 and fear of falling25. Such indings are consistent with the
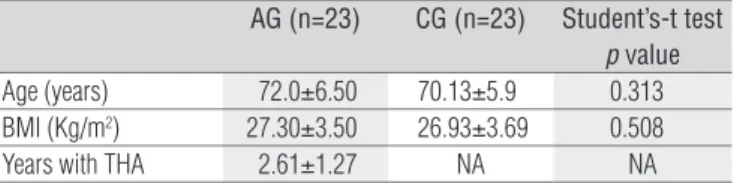
AG (n=23) CG (n=23) Student’s-t test
p value
Age (years) 72.0±6.50 70.13±5.9 0.313 BMI (Kg/m2) 27.30±3.50 26.93±3.69 0.508
Years with THA 2.61±1.27 NA NA
Table 1. Mean, standard deviation and comparative analysis of
subject’s clinic and demographic characteristics from arthroplasty group and control group.
AG=arthroplasty group; CG=control group; BMI=body mass index; THA=total hip arthro-plasty; NA=not apply.
AG (n=23) CG (n=23) Chi-Square
F % F % p value
Gender Male 11 47.8 11 47.8
Female 12 52.2 12 52.2 1
Level of physical activity
Inactive 15 65.3 14 56.5
Insufficient 7 30.4 7 30.5 0.565
Moderate 1 4.3 2 13.0
Vigorous 0 0.0 0 0.0
Table 2. Absolute and relative frequencies and comparative analysis
of subject’s clinic and demographic characteristics from arthroplasty group and control group.
AG=arthroplasty group; CG=control group.
OL NOL Paired Student’s-t test
p value
Step length US 53.50±6.99 49.36±8.88 *0.000
FS 63.33±6.38 60.33±6.12 *0.000
SS 53.14±5.45 51.11±5.41 *0.000
DT 53.43±7.98 50.18±8.46 *0.000
Step time US 0.54±0.034 0.56±0.22 *0.001
FS 0.48±0.053 0.53±0.036 *0.000
SS 0.57±0.090 0.58±0.60 *0.027
DT 0.60±0.087 0.62±0.024 *0.008
Stance phase (%) US 59.07±1.02 60.31±1.05 *0.012
FS 58.13±1.05 60.33±6.12 *0.004
SS 60.03±1.76 63.08±1.65 *0.001
DT 57.72±1.01 60.01±0.91 *0.000
Single support (%) US 37.47±1.25 39.94±0.72 *0.002
FS 37.32±0.90 41.07±1.10 *0.001
SS 37.87±1.22 40.02±1.50 *0.002
DT 36.10±1.17 38.37±1.21 *0.005
Table 3. Mean, standard deviation and comparative analysis of gait parameters between operated limb and non operated limb of arthroplasty group
in different situations.
OL=operated limb; NOL=non operated limb; AG=arthroplasty group; CG=control group; US=usual speed; FS=fast speed; SS=slow speed; DT=dual task. *Significant difference between operated limb and non operated limb.
Table 4. Mean, standard deviation and comparative analysis of gait paremeters between arthroplasty group and control group in different situations
and of Timed Up and Go test and Dynamic Gait Index test.
AG=arthroplasty group; CG=control group; TUG=Timed Up and Go test; DGI=Dynamic Gait Index test; US=usual speed; FS=fast speed; SS=slow speed; DT=dual task. *Significant difference between arthroplasty group and control group.
AG CG Student’s-t test
p value
Speed US 1.18±0.13 1.39±0.09 *0.012
FS 1.52±0.20 1.86±0.13 *0.015
SS 0.94±0.14 1.09±0.12 *0.013
DT 0.99±0.20 1.14±0.13 *0.003
Cadence US 107.83±7.58 105.12±7.28 0.223
FS 122.43±4.78 124.92±2.76 0.136
SS 93.75±5.24 94.29±5.09 0.726
DT 98.86±3.37 98.68±5.09 0.888
Symmetry index of step length
US 3.60±1.01 1.12±0.59 *0.000
FS 5.80±0.87 1.90±0.66 *0.000
SS 2.50±0.73 1.12±0.67 *0.000
DT 6.12±0.89 2.77±0.77 *0.000
Symmetry index of step time US -2.65±0.92 0.99±0.74 *0.000
FS -3.40±1.17 1.19±0.73 *0.000
SS -3.28±1.18 1.03±0.81 *0.000
DT -4.97±1.47 2.55±1.10 *0.000
Symmetry index of stance phase
US -2.55±0.79 -1.04±0.50 *0.005
FS -3.38±0.82 -2.05±0.51 *0.001
SS -1.57±0.51 -1.33±0.15 *0.002
DT -2.09±0.60 -0.76±0.45 *0.000
Symmetry index of single support
US -2.17±0.78 1.21±0.51 *0.003
FS -3.24±0.71 -2.08±0.77 *0.006
VL -2.53±0.70 1.16±0.59 *0.008
DT -5.44±1.02 2.45±1.15 *0.000
TUG 14.67±1.94 10.08±1.49 *0.001
DGI 20.04±1.91 21.69±1.45 *0.001
present study because the AG presented worse scores on the DGI, which is an instrument capable of assessing functional capacity of subjects in situations similar to those required for the execution of ADLs. In addition, it is known that the mini-mum velocity necessary to cross a street safely is 1.22 m/s30,
and the mean values found in the present study were 1.18 m/s for the AG and 1.39 m/s for the CG. In this case, it is possible to deduce that the population with THA studied here had dif-iculties with crossing streets safely and independently.
The differences found between the diverse testing situ-ations in both groups prove that the GS could be modified with verbal commands. The absence of difference between the situations SS and DT found in the present research sup-ports the assumption of Hauer, Marburguer and Oester22,
who affirmed that both postural control and cognitive tasks occur in the cortical level, allowing that an activity interferes with the other or causes reduction of the automatism22.
It is established that the primary determinants of GS are step length and cadence31. In the present study, although
ca-dence behaved linearly with velocity in the distinct test situa-tions and in both groups, there was no statistically signiicant diference when comparing cadence between AG and CG. In this case, it is possible to suppose that the diference in GS found between groups occurred due to diferences in step length and not cadence.
In contrast, when comparing step length between the LLs of the subjects with THA, we observed a longer length
Table 5. Mean, standard deviation and comparative analysis
between different situations in arthroplasty group and control group.
AG=arthroplasty group; CG=control group; US=usual speed; FS=fast speed; SS=slow speed; DT=dual task. * Significant difference between different situations of gait.
Arthroplasty Group (AG)
Repeated measures ANOVA
p value
US (1.18±0.13) x FS (1.52±0.20) *0.001 US (1.18±0.13) x SS (0.94±0.14) *0.005
US (1.18±0.13) x DT (0.99±0.20) *0.012
FS (1.52±0.20) x SS (0.94±0.14) *0.000 FS (1.52±0.20) x DT (0.99±0.20) *0.000
SS (0.94±0.14) x DT (0.99±0.20) 0.179
Control Group (CG)
US (1.39±0.09) x FS (1.86±0.13) *0.005
US (1.39±0.09) x SS (1.09±0.12) *0.010
US (1.39±0.09) x DT (1.14±0.13) *0.020
FS (1.86±0.13) x SS (1.09±0.12) *0.000 FS (1.86±0.13) x DT (1.14±0.13) *0.000
SS (1.09±0.12) x DT (1.14±0.13) 0.052
for the OPL. hese results are similar to those found by Bennett et al.5, who attributed this inding to the reduced
capacity of the operated hip to execute the extension move-ment, limiting the progression of the NOL and reducing the capacity to discharge the load on the OPL. For these authors, the reduced extension of the operated hip during terminal stance led to an increase in the movements of the pelvis, knee and ankle in the sagittal plane on the same side, with a consequent threat to joint stability and an increase in energy wasted during gait32. However, the range of motion (ROM) of
joints was not measured in the present study and should be studied in the future.
he step length was also shorter in the OPL when com-pared with the NOL, leading to a gait asymmetry, in the AG group. he step duration, measured in seconds, is deined as the interval between the initial contact of one foot and the initial contact of the other foot33.husthe reduction in step
duration may have afected the duration of stance and single support phases of gait. his relationship was observed in the results found here because the step, stance phase and single support phase durations were shorter in the OPL, and this dif-ference was statistically signiicant. he reductions in stance phase and single support phase durations indicated a reduced capacity of the AG to discharge load in the OPL, despite an mean time of 2.6 years post-surgery.
McCrory, White and Lifeso32 also observed a lower load
discharge on the OPL when compared with the ground reac-tion forces between subjects with and without a history of THA. hese authors discussed that the asymmetry could be explained by the antalgic gait adopted before surgery or by alterations of strength, ROM and proprioception of the hip, suggesting that persons with joint degenerative diseases could develop adaptive gait strategies that would become routine and thus reprogram movement patterns.
he fact that the AG presented lower GS and greater asymmetry in all the analyzed gait parameters and in all test situations including SS and DT allows us to conclude that the subjects with THA presented shorter stance duration, longer step length and a smaller load discharge under the OPL in situ-ations quite similar to those encountered daily.
Indeed, this asymmetry is associated with a worse func-tional status and a greater risk of falls21 and may cause
degen-erative alterations of the joints of the NOL34, impairment of the
integrity of the prosthesis ixation35 and a reduction in bone
mineral density in the OPL36.
he mean time taken to perform the TUG was 14.67 seconds in the AG and 10.08 seconds in the CG. Bohannon37 indicated
mean values of time reference for the TUG stratiied by age. For subjects in the 70-79 year-old age group, which corresponds to the mean age of the population in the present study, the author
1. Mobasheri R, Gidwani S, Rosson JW. The effect of total hip replacement on the employment status of patients under the age of 60 years. Ann R Coll Surg Engl. 2006;88(2):131-3.
2. Iorio R, Robb WJ, Healy WL, Berry DJ, Hozack WJ, Kyle RF, et al. Orthopaedic surgeon workforce and volume assessment for total hip and knee replacement in the United States: preparing for an epidemic. J Bone Joint Surg Am. 2008;90(7):1598-605.
3. Jennedy DM, Stratford PW, Hanna SE, Wessel J, Gollish J. Modeling early recovery of physical function following hip and knee arthroplasty. BMC Musculoskelet Disord. 2006;7:100.
4. Nantel J, Termoz N, Vendittoli PA, Lavigne M, Prince F. Gait patterns after total hip arthroplasty and surface replacement arthroplasty. Arch Phys Med Rehabil. 2009;90(3):463-9.
5. Bennett D, Humphreys L, O’brien S, Kelly C, Orr JF, Beverland DE. Gait kinematics of age-stratified hip replacement patients – A large scale, long-term follow-up study. Gait Posture. 2008;28(2):194-200.
6. van den Akker-Scheek I, Stevens M, Bulstra SK, Groothoff JW, van Horn JR, Zijlstra W. Recovery of gait after short-stay total hip arthroplasty. Arch Phys Med Rehabil. 2007;88(3):361-7.
7. Maffiuletti NA, Impellizzeri FM, Widler K, Bizzini M, Kain MSH. Spatiotemporal parameters of gait after total hip replacement: anterior versus posterior approach. Orthop Clin North Am. 2009;40(3):407-15.
8. Kyriasis V, Rigas C. Temporal gait analysis of the osteoarthritic patients operated with cementless hip replacement. Clin Biomech (Bristol, Avon). 2002;17(4):318-21.
9. Rasch A, Dalén N, Berg HE. Muscle strength, gait, and balance in 20 patients with hip osteoarthritis followed for 2 years after THA. Acta Orthop. 2010;81(2):183-8.
10. Youdas JW, Hollman JH, Aalbers MJ, Ahrenholz HN, Aten RA, Cremers JJ. Agreement between
determined an mean TUG time of 11.3 seconds. Considering these results, the AG’s mean TUG time was higher than this value, indicating a worse functional performance as well as a diference between groups of 4.95 seconds. In a population-based study, hrane, Joakimsen and hornquist38 demonstrated
that the diference of 2.4 seconds in TUG performance time is clinically relevant, which suggests that the AG analyzed in the present study showed clinical-functional diferences when compared with the CG, perhaps inluenced by gait alterations because none of the participants reported pain on the day of data collection.
Prior to this research, studies that used the DGI to evalu-ate older adults with THA were not available, but it is known that scores lower than 19 points are associated with changes in gait and risk of falls39. Whitney et al.40 concluded that DGI
is a good indicator of gait instability, which is associated with the risk of falls, in both old and young subjects, in ad-dition to being appropriate for evaluating functionality of healthy older adults. However, in this research, despite the differences in the results between AG and CG, both groups presented mean DGI scores up to 19 points, suggesting the need for more research related to a cutoff point for specific populations.
There are some limitations to the present study. Al-though the groups were well matched on gender, age, BMI and level of physical activity, cross-sectional studies do not allow inferences of causality, preventing the conclusion that
the differences between groups are caused by the THA. To reach such a conclusion, further longitudinal studies are needed in which the gait is analyzed before and after the surgical procedure. Some potentially confounding factors were minimized by the fact that all surgeries were performed by the same surgeon, with the same surgical approach and with an identical type of prosthesis. However, the fact that one-third of the AG subjects had osteoarthritis in another LL joint, even without complaints of pain on the day of data collection, may have interfered with the results, as we did not know the subject’s functional status before the surgery.
Conclusion
Elderly subjects who had undergone THA due to osteoar-thritis presented alterations in GS, step duration and length, duration of stance and single support phases, even 2.6 years post-surgery. he asymmetry was evident, with a lower load discharge on the OPL during the situations FS, SS and US as-sociated with a cognitive task. In addition, the elderly subjects with THA had a worse functional performance on the TUG test, indicating that they did not return to normal functional status. Such indings suggest the necessity of allocating more attention to the postoperative rehabilitation of post-THA pa-tients’ gait and functional training.
References
the GAITRite walkway system and a stopwatch-footfall count method for measurement of temporal and spatial gait parameters. Arch Phys Med Rehabil. 2006;87(12):1648-52.
11. Webster KE, Wittwer J, Feller JA. Validity of the GAITRite walkway system for the measurement of averaged and individual step parameters of gait. Gait Posture. 2005;22(4):317-21.
12. Menz HB, Latt MD, Tiedemann A, Mun San Kwan M, Lord SR. Reliability of the GAITRite® walkway system for the quantification of temporo-spatial parameters of gait in young and older people. Gait Posture. 2004;20(1):20-5.
13. Brucki SMD, Nitrini R, Caramelli P, Bertolucci PF, Okamoto IH. Sugestões para o uso do mini-exame do estado mental no Brasil. Arq Neuropsiquiatr. 2003;61(3B):777-81.
14. De Castro S, Perracini M, Ganança F. Dynamic Gait index – Brazilian Version. Rev Bras Otorrinolaringol. 2006;72(6):817-25.
15. Shumway-Cook A, Woolacott MH. Control of posture and balance.in: motor control theory and practical. Applications.maryland: Willians & Wilkins; 1995.
16. Marchetti GF, Withney SL, Blatt PJ, Morris LO, Vance JM. Temporal and spatial characteristics of gait during performance of the Dynamic Gait Index in people with and people without balance or vestibular disorders. Phys Ther. 2008;88(5):640-51.
17. Mathias S, Nayak US, Isaacs B. Balance in elderly patients: The “Get-up and Go” test. Arch Phys Med Rehabil. 1986;67(6):387-9.
18. Podsiadlo D, Richardson S. The timed “Up & Go”: A test of basic functional mobility for frail elderly persons. J Am Geriatr Soc. 1991;39(2):142-8.
19. Wall JC, Bell C, Campbell S, Davis J. The timed get-up-and-go test revisited: measurement of the component tasks. J Rehabil Res Dev. 2000;37(1):109-13.
20. Daughton DM, Fix AJ, Kass I, Bell CW, Patil KD. Maximum oxygen consumption and the ADAPT quality-of-life scale. Arch Phys Med Rehabil. 1982;63(12):620-2.
21. Bloem BR, Valkenburg VV, Slabbekoorn M, Willemsen MD. The multiple tasks test: development and normal strategies. Gait Posture. 2001;14(3):191-202.
22. Hauer K, Marburguer C, Oester P. Motor performance deteriorates with simultaneously performed cognitive tasks in geriatric patients. Arch Phys Med Rehabil. 2002;83(2):217-23.
23. Megan Zachar BS. GAITRite Manual. Version 3.9 MAP/CIR INC. Havertown, PA 19083. 09/06junho/2007.
24. Galea MP, Levinger RP, Lythgo N, Cimoli C, Weller R, Tully E, et al. A target home- and center-based exercise program for people after total hip replacement: a randomized clinical trial. Arch Phys Med Rehabil. 2008;89(8):1442-7.
25. Giaquinto S, Ciotola E, Margutti F. Gait in the early days after total knee and hip arthroplasty: a comparison. Disabil Rehabil. 2007;29(9):731-6.
26. Nankaku M, Tsuboyama T, Kakinoki R, Kawanabe K, Kanzaki H, Mito Y, et al. Gait analysis of patients in early stages after total hip arthroplasty: effect of lateral trunk displacement on walking efficiency. J Orthop Sci. 2007;12(6):550-4.
27. Madsen MS, Ritter MA, Morris HH, Meding JB, Berend ME, Faris PM, et al. The effect of total hip arthroplasty surgical approach on gait. J Orthop Res. 2004;22(1):44-50.
28. Sicard-Rosenbaum L, Light KE, Behrman AL. Gait, lower extremity strength, and self-assessed mobility after hip arthroplasty. J Gerontol A Biol Sci Med Sci. 2002;57(1):M47-51.
29. Perron M, Malouin F, Moffet H, McFadyen BJ. Three-dimensional gait analysis in women with a total hip arthroplasty, Clin Biomech (Avon, Bristol). 2000;15(7):504-15.
30. Wang AW, Gilbey HJ, Ackland TR. Perioperative exercise programs improve early return of
ambulatory function after total hip arthroplasty: A randomized, controlled trial. Am J Phys Med Rehabil. 2002;81(11):801-6.
31. Prince F, Corriveau H, Hébert R, Winter DA. Gait in the elderly. Gait Posture. 1997;5(2):128-35.
32. McCrory JL, White SC, Lifeso RM. Vertical ground reaction forces: objective measures of gait following hip arthroplasty. Gait Posture. 2001;14(2):104-9.
33. Perry J. Análise de marcha.1ª Ed. Barueri (SP): Manole; 2005.
34. Husby VS, Helgerud J, Bjørgen S, Husby OS, Benum P, Hoff J. Early postoperative maximal strength training improves work efficiency 6-12 months after osteoarthritis induced total hip arthroplasty in patients younger than 60 years. Am J Phys Med Rehabil. 2010;89(4):304-14.
35. Nallegowda M, Singh U, Bhan S, Wadhwa S, Handa G, Dwivedi SN. Balance and gait in total hip replacement: A pilot study. Am J Phys Med Rehabil. 2003;82(9):669-77.
36. Mont MA, Seyler TM, Ragland PS, Starr R, Erhart J, Bhave A. Gait analysis of patients with resurfacing hip arthroplasty compared with hip osteoarthritis and standard total hip arthroplasty. J Arthroplasty. 2007;22(1):100-8.
37. Bohannon RW. Reference values for the timed up and go test: a descriptive meta-analysis. J Geriatr Phys Ther. 2006;29(2):64-8.
38. Thrane G, Joakimsen RM, Thornquist E. The association between timed up and go test and history of falls: The Tromso study. BMC Geriatr. 2007;7:1.
39. Wrisley DM, Marchetti GF, Kuharsky DK, Whitney SL. Reliability, internal consistency, and validity of data obtained with the functional gait assessment. Phys Ther. 2004;4(10):906-18.
40. Whitney SL, Marchetti GF, Schade A, Wrisley DM. The sensitivity and specificity of the Timed “Up & Go” and the dynamic gait index for self-reported falls in persons with vestibular disorders. J Vestib Res. 2004;14(5):397-409.