O
RIGINALA
RTICLE Revista Brasileira de FisioterapiaClinical profile, quality of life and depressive
symptoms of women with urinary incontince
attending a university hospital
Perfil clínico, qualidade de vida e sintomas depressivos de mulheres com
incontinência urinária atendidas em hospital-escola
Mara R. Knorst1, Thais L. Resende1, José R. Goldim2
Abstract
Objectives: To describe the characteristics of urinary incontinence (UI) and to evaluate its impact on health-related quality of life (QOL) and depressive symptoms in women referred for physical therapy at a university hospital. Methods: A descriptive cross-sectional study with demographic data collection related to UI. All women were evaluated through examination and also through depression and QOL questionnaires. Results: Forty-eight women were evaluated (53.8±10.9 years), 47.9% with mixed UI (MUI), 39.6% with stress UI (SUI) and 12.5% with urge UI (UUI). In 50% of the cases the urinary loss lasted between 3.3 and 10 years. There was no significant difference in the pelvic floor muscle strength among the different types of UI (P>0.05). Depressive symptoms were detected in 37% of the women. Changes in the QOL were observed in all three groups of women with UI. According to the King’s Health Questionnaire (KHQ), women with MUI presented more compromised health perception and greater physical, social, daily activity and personal relationship limitations (P<0.05). The women with MUI presented a worse health perception (P<0.05) according to the WHOQOL-Bref. Conclusion:
Depressive symptoms were detected in more than a third of the women whose quality of life was adversely affected and the greatest impact was observed in the patients with MUI.
Keywords: urinary incontinence; women’s health; quality of life; depression.
Resumo
Objetivos: Descrever as características da incontinência urinária (IU) e avaliar seu impacto na qualidade de vida (QV) relacionada à saúde e aos sintomas depressivos de mulheres encaminhadas para atendimento fisioterapêutico em hospital universitário. Métodos:
Estudo descritivo transversal com coleta de dados demográficos e dos relacionados à IU. Todas as mulheres foram avaliadas por meio de exame físico e por escalas de depressão e QV. Resultados: Foram avaliadas 48 mulheres (53,8±10,9 anos); 47,9% com incontinência urinária mista (IUM), 39,6% com incontinência urinária de esforço (IUE) e 12,5% com incontinência urinária de urgência (IUU). Em 50% dos casos, a perda urinária durou entre 3,3 e 10 anos. Não houve diferença na força da musculatura perineal nos diferentes tipos de IU (P>0,05). Sintomas depressivos foram detectados em 37% das mulheres. Observou-se alteração da QV nos três grupos de mulheres portadoras de IU. No King’s Health Questionnaire (KHQ), portadoras de IUM apresentaram uma percepção de saúde mais comprometida, maiores limitações físicas, sociais, nas atividades diárias e nas relações pessoais (P<0,05). No WHOQOL-Bref, observou-se uma pior percepção da saúde no grupo com IUM (P<0,05). Conclusão: Foram detectados sintomas depressivos em mais de um terço das mulheres, cuja QV foi adversamente afetada, sendo o maior comprometimento observado nas mulheres com IUM.
Palavras-chave: incontinência urinária; saúde da mulher; qualidade de vida; depressão.
Received: 23/03/10– Revised: 09/09/10 – Accepted: 08/02/11
1 Faculty of Nursing, Nutrition and Physical Therapy, Pontifícia Universidade Católica do Rio Grande do Sul (PUCRS), Porto Alegre, RS, Brazil
2 Institute of Geriatrics and Gerontology, PUCRS
Correspondence to: Mara Regina Knorst, Faculdade de Enfermagem, Nutrição e Fisioterapia, Prédio 12, Avenida Ipiranga, 6681, CEP 90.619-900, Porto Alegre, RS, Brasil, e-mail: [email protected]
Introduction
he International Continence Society has recently modiied the deinition of urinary incontinence (UI) for “involuntary loss of urine that is a social or hygienic problem”, emphasizing, there-fore, the patient’s complaint1.
he UI may be classiied as stress urinary incontinence (SUI), urge urinary incontinence (UUI) and mixed urinary inconti-nence (MUI). SUI is characterized by loss due physical efort, through the intact urethra, without contraction of the detrusor muscle of the bladder. In UUI, the individuals feel a sudden and strong desire to urinate, however they are not able to control the mechanism of micturition. he MUI can be associated with both situations and also be a result of emotional aspects2.
Due to anatomical factors the prevalence of UI is higher in women than in men2, afects women from all ages3, ranges from
8 to 34% in the elderly, occurs in 30 to 60% of the institutional-ized elderly4 and may be a contributor for institutionalization3.
he main risk factors for UI are previous history of hysterectomy; pregnancy; vaginal delivery and gestational or postpartum UI5;
falling serum estrogen levels during the menopause; constipa-tion; obesity; medications and surgeries that are able to cause reduction of the pelvic muscle tone and/or able to generate nerve compromise6.
he urinary incontinence causes discomfort, loss of self-conidence and may lead to urinary tract infections, pressure ulcers and diseases of the perineal skin7. he medical, social,
psy-chological and economic implications of this condition lead to changes in lifestyle8,9 and adversely afect the quality of life (QOL)
in women. Feelings such as loneliness, sadness and depression are present in the incontinent women lives9.
Women that present mild and moderate incontinence levels usually do not seek care, and the frequency for seeking treatment increases during the postmenopausal period, when the degree of urinary loss increases8. he initial assessment of patient aims to
rule out speciic diseases that can lead to urinary incontinence, to evaluate the severity of the condition, to make the diagnosis by the UI classiication and to determinate the characteristics of the symptoms to determine an appropriate therapeutic ap-proach. A clinical evaluation of pelvic loor muscles may be use-ful for studying the efect of intervention1.
he knowledge of the clinical proile of women with UI users of the physical therapy service may aid health managers in the formulation of more adequate work strategies and practices to the health needs of these women. Few studies related to this re-search topic have been conducted in Brazil6, and no similar study
has been found in Rio Grande do Sul, Brazil. his study aimed to describe the characteristics of UI and to assess their impact on health-related QOL and depressive symptoms in women that have attended a physical therapy service in a university hospital.
Methods
A cross-sectional study was conducted at the Hospital São Lucas (HSL) of the Pontifícia Universidade Católica do Rio Grande do Sul (PUCRS), Porto Alegre, RS, Brazil from 2006 to 2008. he project was approved by the Ethics in Research Committee of the PUCRS (protocol 06/03194), and ethical principles were respected in accordance with the resolution 196/96 of CNS-MS. All the participants have read and signed the informed consent form.
Fifty consecutive women with medical diagnosis of UI who were referred from the Urogynecology clinic of HSL-PUCRS to the physical therapy department clinic were evaluated. Two women that had previous surgery aimed to correct urinary in-continence were excluded from the study.
he evaluations were carried out at the Department of Physi-cal herapy of HSL-PUCRS and were composed by anamnesis, functional assessment of the pelvic loor, two instruments for measuring QOL and one instrument to detect the presence of depression.
Data with regards to age, education, marital status, type of urinary incontinence, incontinence duration, circumstances of urinary loss, amount of urine lost, number of pregnancies, type of delivery, episiotomy, menopause, obesity, presence of genito-urinary prolapse and presence of constipation were collected during the anamnesis. he participants described the amount of urine loss in droplets, dashes or whole bladder.
Functional assessment of pelvic loor was performed through perineometry and bidigital palpation, both with the woman in lithotomy position. For the perineometry, a digital perineom-eter (Kroman trademark) which detects the increase pressure induced by the contraction of the levator ani muscle (LAM) through a transvaginal electrode was used. he perineometry was performed three times, and the highest value in the Sauers scale was used as reference. Subsequently, the obtained values were converted into cmH2O, taking into account that 28 Sauers
units are equal to a pound that, on the other hand, corresponds to 0.49 cmH2O.
he LAM strength was also assessed by the bidigital palpa-tion. he ability to contract this muscle was graded based on the Ortiz10 scale, ranging from 0 to 5, where zero is the absence of
muscle contraction and ive is a strong and sustained contrac-tion for more than ive seconds.
he impact of incontinence on QOL was measured using two questionnaires, being one general, the World Health Orga-nization Quality of Life –BREF questionnaire (WHOQOL-bref) and a speciic questionnaire for UI patients, the “King’s Health Questionnaire” (KHQ).
he KHQ consists of 21 questions divided into eight do-mains: general health perception, incontinence impact, activity
limitations of daily life, physical limitations, social limitations, personal relationships, emotions, sleep/energy. he KHQ is scored for each of its domains, therefore, there is no total score. he scores range from 0 to 100 and the higher the score, the worse is the QOL related to that domain11.
he WHOQOL-bref questionnaire is divided into four do-mains: physical health, psychological health, social relationships and environment. Data obtained using the WHOQOL-bref were evaluated for each speciic domain, being the higher the score (maximum = 100), the better the QOL related to that domain12.
To assess the presence of depressive symptoms the General Hospital Depression Scale (GHDS) which is composed of six items was used. A total score equal to or higher than three is suggestive of depression13. Additionally, a self-perception
ques-tion “Do you feel depressed?” was added and the answer is reported as a yes/no format.
he sample size calculation (45 women) was performed us-ing the PEPI statistical program based on the estimated efect observed in a previous study of physical therapy intervention in the UI, with a signiicance level of 95%, a estimated positive result of 74% and 10% of standard deviation. Data analysis was performed by the statistical package SPSS 11.0. he Kolmogo-rov-Smirnov test was used to assess the distribution of quan-titative variables. he comparison of the incontinence type was performed with the One-Way Analysis Variance (ANOVA) test, and for the remaining analysis the nonparametric test of Kruskal-Wallys was used. Comparisons with regards to the UI
types were performed by Pearson’s chi-square test. he pres-ence of depressive symptoms detected by the GHDS and by the self-perception of depression question was compared by the McNemar test, and the level of agreement between these vari-ables was investigated using the Kappa coeicient. he level of signiicance for all analysis was α≤0.05.
Results
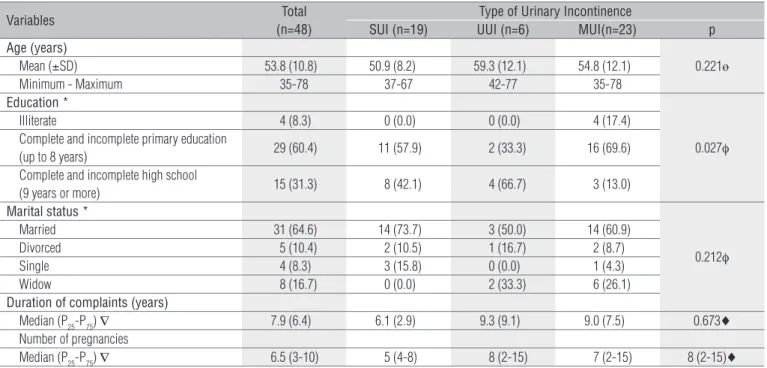
Forty-eight women with a mean age 53.8±10.8 years partici-pated in the present study. he majority of women was married (64.6%), had complete or incomplete elementary education (60.4%) and residing outside Porto Alegre, Brazil (58.3%). Data with regards to age, education level, marital status and duration of incontinence according to UI type are shown in Table 1.
With regards to the clinical diagnosis of the participants, 23 women (47.9%) were classiied as having MUI; 19 women (39.6%) had SUI and 6 women (12.5%) were classiied as hav-ing UUI. he mean duration of urinary incontinence complaint was 7.9±6.4 years, and 50% of women presented urinary loss that lasted between 3.3 and 10 years.
Half of the women had two to four pregnancies, and only two nulliparous were observed in our sample. Women with MUI had signiicantly more pregnancies than women with SUI and UUI (p=0.01), being the median in the MUI group of three pregnancies, while SUI and UUI groups showed a median of 2
Variables Total
(n=48)
Type of Urinary Incontinence
SUI (n=19) UUI (n=6) MUI(n=23) p Age (years)
0.221ө Mean (±SD) 53.8 (10.8) 50.9 (8.2) 59.3 (12.1) 54.8 (12.1)
Minimum - Maximum 35-78 37-67 42-77 35-78
Education *
0.027φ
Illiterate 4 (8.3) 0 (0.0) 0 (0.0) 4 (17.4)
Complete and incomplete primary education
(up to 8 years) 29 (60.4) 11 (57.9) 2 (33.3) 16 (69.6) Complete and incomplete high school
(9 years or more) 15 (31.3) 8 (42.1) 4 (66.7) 3 (13.0) Marital status *
0.212φ
Married 31 (64.6) 14 (73.7) 3 (50.0) 14 (60.9)
Divorced 5 (10.4) 2 (10.5) 1 (16.7) 2 (8.7)
Single 4 (8.3) 3 (15.8) 0 (0.0) 1 (4.3)
Widow 8 (16.7) 0 (0.0) 2 (33.3) 6 (26.1)
Duration of complaints (years)
Median (P25-P75) ∇ 7.9 (6.4) 6.1 (2.9) 9.3 (9.1) 9.0 (7.5) 0.673♦
Number of pregnancies
Median (P25-P75) ∇ 6.5 (3-10) 5 (4-8) 8 (2-15) 7 (2-15) 8 (2-15)♦
Table 1. Sample characteristics: data relative to the total sample and according to the type of incontinence.
SUI = stress urinary incontinence; UUI = urge urinary incontinence; MUI = mixed urinary incontinence; SD = standard deviation; * Values presented in the form of n (%), where the percentage was obtained based on the total number of cases in the sample or the total of each category of UI; ө = One Way Analysis of variance (ANOVA); φ = Chi-square test not validated due to the presence of more than 20% of cases with expected frequency below 5; ♦ = Kruskal-Wallys; ∇ = P25 concentrates 25% of the sample with values less than or equal to that set by P25; P75 = concentrates 75% of the sample with values less than or equal to that defined by P75.
Variables Total (n=48)
Type of Urinary Incontinence
SUI (n=19) UUI (n=6) MUI (n=23) P♦ General health perception
0.020
Median 50 25 37,5 50
(P25-P75) ∇ (25-50) (25-50) (18.7-62.5) (50-50) Impact of incontinence
0.086
Median 66.7 66.7 33.3 66.7
(P25-P75) ∇ (33.3-100) (33.3-66.7) (33.3-75) (33.3-100) Daily activities limitations
0.022
Median 33.3 33.3 33.3 50
(P25-P75) ∇ (33.3-66.7) (16.7-33.3) (0-83.3) (33.3-66.7) Physical limitations
0.011
Median 41.7 33.3 25.0 66.7
(P25-P75) ∇ (33.3-66.7) (16.7-50) (16.7-62.5) (33.3-83.3) Social limitations
0.013
Median 33.3 22.2 16.7 33.3
(P25-P75) ∇ (2.78-55.6) (0.0-33.3) (0.0-50) (33.3-66.7) Personal relationships
0.005
Median 33.3 0 0 33.3
(P25-P75) ∇ (0-50) (0-33.3) (0-25) (33.3-66.7) Emotions
0.058
Median 44.4 33.3 38.9 55.5
(P25-P75) ∇ (22.2-77.8) (11.1-44.4) (8.3-75) (33.3-88.8) Sleep and energy
0.275
Median 33.3 33.3 33.3 50
(P25-P75) ∇ (33.3-50) (16.7-50) (12.5-66.7) (33.3-50) Measures of gravity
0.058
Median 66.7 53.3 53.3 73.3
(P25-P75) ∇ (46.7-73.3) (46.7-66.7) (30-75) (60-86.7)
Table 2. Descriptive measures for the quality of life instrument specific for individuals with urinary incontinence, the “King’s Health Questionnaire;
data relative to the total sample and according to the type of incontinence.
SUI = stress urinary incontinence; UUI = urge urinary incontinence; MUI = mixed urinary incontinence;♦ = Kruskal-Wallys Test; ∇ = Percentile 25 (P25) and Percentile 75 (P75).
and 2.3 pregnancies, respectively. Regarding the type of delivery, 81.3% of the participants had a vaginal delivery, 68.4% reported having an episiotomy, and 31.3% underwent cesarean section. hirty-six women presented some type of prolapse, which was predominantly observed in women with SUI (84.2%). hirty-ive women (72.9%) were in the menopause; all UUI participants were in the menopause. Intestinal constipation was a symp-tom reported in 45.2% of the participants.
In all circumstances of loss of urine evaluated in this study, there were statistically signiicant diferences when comparing the three types of UI (P<0.05). Coughing, sneezing, laughing, jumping, experiencing orgasm and walking were the circum-stances that were associated to the urine loss in the SUI and MUI groups, while the urine loss in the presence of full bladder is more frequent in women with UUI.
From all women 87.5% reported urine loss in droplets and dashes. he amount of urine lost was compared between the diferent UI types; being urine loss in dashes predominating in all group types. However, 21.7% of women with MUI reported complete urinary loss.
he median of contraction strength of the pelvic loor mus-cles measured through the perineometer in all participants
was 0.64 cmH2O, being 50% of women presented muscle strength between 0.38 to 1 cmH2O. Comparison of muscle strength among the diferent incontinence type groups showed that women with MUI presented the highest median (0.71 cmH2O) and women with UUI presented the lowest me-dian (0.58 cmH2O). However, this diference was not statisti-cally signiicant (P>0.05).
he median of the bidigital palpation grade of the LAM was 4, being 50% of the participants had the contraction strength grades of this muscle between 3 and 5. he median estimates according to the incontinence type groups were very similar, with no between-group diferences (P> 0.05).
Depressive symptoms were detected in 39.6% of women by the GHDS and in 47.9% of the cases by the question “Do you feel depressed?”, with a signiicant correlation between the two measures (P<0.001). here was no signiicant diference between the results obtained by the two measures used to investigate depression (P>0.05), observing a moderate level of agreement between the measures (k=0.644, P<0.001).
Table 2 shows the results of the KHQ. here were signii-cant diferences among the three UI types groups in relation to general health perception and the highest and the worst scores
were observed in the MUI group (P=0.02). Similarly, activity limitations of daily life, physical limitations, social limitations and personal relationships domains were signiicantly more afected in this group of women (P<0.05).
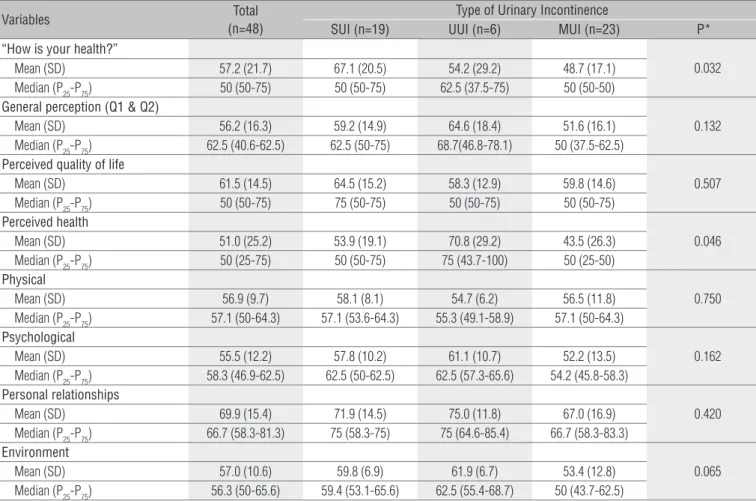
he results regarding the WHOQOL- bref are shown in Table 3. A signiicant diference in the initial question “How is your health?” was observed. Women with MUI had signii-cantly lower mean score in this question compared to the other UI groups types (P=0.032). Similarly, in question 2, which also address information related to the health perception, the low-est score was observed in the MUI group type (P=0.046). here were no diferences between groups in the remaining domains of the questionnaire.
Discussion
he results of this study showed that women attending physical therapy service at a university hospital in Porto Alegre, RS, Brazil were middle-aged, were or had been married and had a low education level. hese results are supported by Figueiredo et al.6 who found women aged between 40 and
59 years-old and with complete and incomplete elementary education. he similarity between the two studies also oc-curred with regard to the prevalence of the UI type. In both studies the prevalence of MUI type was higher compared to the other types, being 48% in the present study and 63% in the Figueiredo et al.6 study. On the other hand, a large
obser-vational study carried out in Norway, the Norwegian EPIN-CONT Study14, demonstrated that from the 27,936 women
aged grater than 20 years who participated in the study, 25% had UI. his study14 also showed that the prevalence of UI
increased with age and half of the women included in this study had SUI, 36% MUI and 11% UUI. Similarly, Isherwood and Rane15 found SUI as the most prevalent type of UI in
younger women, with a mean age of 41 years.
he prevalence of any UI type is likely to increase until middle-age, to decrease between 50 and 70 years-old and to increase with a more advanced age1,5. In the present study,
it was observed that the highest mean of age occurred in women with UUI and the lowest mean of age in women with SUI (59.3 versus 50.9 years). An inverse relation between SUI and age has been described previously in another study (r=-0.380, p<0.001)16.
Table 3. Descriptive measures for the generic instrument to assess quality of life, the WHOQOL-bref; data relative to the total sample and according
to the type of incontinence.
SUI=stress urinary incontinence; UUI=urge urinary incontinence; MUI=mixed urinary incontinence; *=Analysis of Variance (One Way); SD=standard deviation.
Variables Total
(n=48)
Type of Urinary Incontinence
SUI (n=19) UUI (n=6) MUI (n=23) P* “How is your health?”
0.032 Mean (SD) 57.2 (21.7) 67.1 (20.5) 54.2 (29.2) 48.7 (17.1)
Median (P25-P75) 50 (50-75) 50 (50-75) 62.5 (37.5-75) 50 (50-50) General perception (Q1 & Q2)
0.132 Mean (SD) 56.2 (16.3) 59.2 (14.9) 64.6 (18.4) 51.6 (16.1)
Median (P25-P75) 62.5 (40.6-62.5) 62.5 (50-75) 68.7(46.8-78.1) 50 (37.5-62.5) Perceived quality of life
0.507 Mean (SD) 61.5 (14.5) 64.5 (15.2) 58.3 (12.9) 59.8 (14.6)
Median (P25-P75) 50 (50-75) 75 (50-75) 50 (50-75) 50 (50-75) Perceived health
0.046 Mean (SD) 51.0 (25.2) 53.9 (19.1) 70.8 (29.2) 43.5 (26.3)
Median (P25-P75) 50 (25-75) 50 (50-75) 75 (43.7-100) 50 (25-50) Physical
0.750 Mean (SD) 56.9 (9.7) 58.1 (8.1) 54.7 (6.2) 56.5 (11.8)
Median (P25-P75) 57.1 (50-64.3) 57.1 (53.6-64.3) 55.3 (49.1-58.9) 57.1 (50-64.3) Psychological
0.162 Mean (SD) 55.5 (12.2) 57.8 (10.2) 61.1 (10.7) 52.2 (13.5)
Median (P25-P75) 58.3 (46.9-62.5) 62.5 (50-62.5) 62.5 (57.3-65.6) 54.2 (45.8-58.3) Personal relationships
0.420 Mean (SD) 69.9 (15.4) 71.9 (14.5) 75.0 (11.8) 67.0 (16.9)
Median (P25-P75) 66.7 (58.3-81.3) 75 (58.3-75) 75 (64.6-85.4) 66.7 (58.3-83.3) Environment
0.065 Mean (SD) 57.0 (10.6) 59.8 (6.9) 61.9 (6.7) 53.4 (12.8)
Median (P25-P75) 56.3 (50-65.6) 59.4 (53.1-65.6) 62.5 (55.4-68.7) 50 (43.7-62.5)
he study performed by Lewis17 demonstrated that 75%
of 827 women with UI took about three years to seek care. his same diiculty in seeking care was observed among women of the present study, in which 50% of the sample had incontinence lasting for between 3 and 10 years. A lower level of care-seeking was previously described8 in women with a
mild to moderate levels of incontinence, with the frequency of health care seeking increasing during the postmeno-pausal period, when the level of urinary loss increases8. his
situation was conirmed by the present study, since 72.9% of women match this situation.
Regarding the number of pregnancies, 50% of participants had between two and four pregnancies, whereas Figueiredo et al.6 showed that 42% had one to three pregnancies. In
this study, we found that women diagnosed with MUI had a greater number of pregnancies, being this type of UI sig-niicantly associated with vaginal delivery, while the SUI type was associated with cesarean section. In a study performed by Guarise et al.18, there was no increased risk of urinary
incontinence among women who had one or more pregnan-cies, as well as among women who had one or more deliver-ies when compared with those who had no pregnancdeliver-ies or childbirth.
he UI has been associated with neuromuscular damage of the pelvic loor that occur during the vaginal delivery, es-pecially in primiparous women, however, there are still con-troversies about whether UI is due to pregnancy or due to the type of delivery19. It was observed in this study that 81.3%
of the participants had vaginal delivery, being this percent-age higher than the indings of 76% observed in the study performed by Figueiredo et al.6 with a similar sample.
According to Neumann20, women who had never had
vaginal delivery, women who are young and those who have not had prolapse may have UI. hese indings were conirmed in this study, since that from all participants, nine had never had vaginal delivery, two never had been pregnant and 25% have not had any type of prolapse.
In this study, the circumstances of urinary loss that pre-dominated in women with SUI and MUI were coughing and sneezing, followed by laughing. For women with MUI, the urine loss also occurs in others circumstances such as jump-ing, walking and experiencing an orgasm. he situation of being unable to stop leakage before reaching the toilet was described as the most common circumstance in women with UUI. Other authors2,6 refer to urinary loss during eforts and
urgency as the predominant signs and symptoms in women with UI.
he manufacturer of the perineometer used in this study established 28 Sauers (1pound-0.49 cmH2O) as the minimum value to be obtained in the examination of a
healthy musculature. It was observed a mean of 42.1 Sauers (0.73 cmH2O) to the strength of the perineal muscles, even in women with SUI and MUI, in which muscle weakness is considered as determinant for urinary leakage. However, it is necessary to consider that the presence of prolapse may inter-fere in the measurements performed by the perineometry.
In the bidigital evaluation to detect the level of strength of the pelvic loor muscles, we found that 50% of women pre-sented a strength grade ranging from 3 to 5. he Royal College of Obstetricians and Gynaecologists (RCOG) recognizes that there still is a lack of scientiic evidence for the clinical use of the digital assessment of pelvic loor muscles. However, the RCOG’s technical report states that the presence or absence of contraction of the pelvic loor muscles may orientate the treatment decisions1. he bidigital test is a low cost test that
can be used in primary care, that can help to improve the physical therapy assessment and interventions. A major is-sue is that this test must be performed by the same examiner at the beginning and end of treatment1, as we have performed
in our study.
Depressive symptoms were investigated in the present study through the application of DHGS and the investigation of the self-perception of depression in women. Our results showed a signiicant association between depression meas-ured through the DHGS and the self- perception question, suggesting that the simple question “Do you feel depressed?” may be useful in screening for depressive symptoms in women with urinary incontinence and it justiies its use in the routine care of this population. his data is particularly relevant in face of the indings that depression is signiicantly more frequent in women with urinary incontinence3,21.
De-pression is also associated with increased mortality, comor-bidities, use of health services and decreased quality of life22.
In this study, almost 40% of participants showed results suggestive of depression, higher than that observed in a study performed by Ko et al.3 in which approximately 28%
of the population with UI had felt depressed or lost interest in activities that before they usually carried out, compared with 15.4% of the continent group. his diference between the prevalence by Ko et al.3 and our study is probably due to
diferences between the samples recruited, both in terms of composition, as well as the sample size.
Besides the depression, in 15% to 30% of the cases, UI afects the social, occupational, physical and sexual life of the women of all ages. he psychosocial impact can be more devastating than the consequences on health, with multi and comprehensive efects that inluence daily activities, social interaction and self-perception of health status23.
Urinary symptoms of KHQ that women reported more often as “a lot” to afect them were urinary urgency and SUI
(41.6%), urinary frequency (35.4%) and the urge incontinence (31.2%). Rett et al.9 demonstrated that the urinary frequency
(65.4%), nocturia and urinary urgency (57.7%) were the symptoms that most afected women.
In order to assess QOL, we used a UI-speciic question-naire, the KHQ and a general one, the WHOQOL-bref. In both questionnaires, there was a negative impact of UI on QOL of women, with median scores in the KHQ ranging from 33.3 to 66.7 and the WHOQOL-bref from 51.0 to 69.9, conirming the results of other studies, which showed median scores rang-ing between 33.0 and 100.0 and between 40 and 5824.
Comparing the results of the two QOL questionnaires suggests that, on one hand, both instruments measure the QOL outcomes in women with involuntary urine loss, on the other hand, the KHQ is more sensitive to detect diferences between the various UI types. In the KHQ, the highest and the lowest scores in all items evaluated were observed in women with MUI. In ive out of nine items, the diference between women with SUI and UUI was statistically signiicant (general health perception, daily activitiy limitations, physical limita-tions, social limitations and personal relationships), showing the greatest negative impact this type of UI in quality of life. In the WHOQOL-Bref, women with MUI also had the worst scores in six out of eight domains investigated, although the between-group diference was statistically signiicant in only two domains (situation and health perception).
One aspect that needs to be further studied is the rela-tionship between the volume of urinary loss and QOL. In
the present study, the urinary loss was classiied as droplets, dashes or whole bladder. Few studies have used a similar description of the intensity of urinary loss, and, in most of them the urinary loss is described as small, moderate or se-vere. Our results showed that women with MUI presented a more signiicant urinary loss. Furthermore, these women presented a lower level of QOL. hese results suggest that besides the UI type, the amount of urinary loss may inlu-ence the QOL of incontinent women. Further investigations are needed to clarify this issue.
his study has limitations that should be discussed. Firstly, an objective method to quantify the urinary loss was not used, but instead a description given by the participants as droplets, dashes or whole bladder was used. A second limitation was the small number of women with UUI, not-withstanding the most compromised group, MUI, is also the most prevalent in the study
In conclusion, the results show that the most common UI type in this sample was the MUI; depressive symptoms may follow the disease; and it causes a negative impact on the QOL of women, being these efects more pronounced in women with MUI. However, these results relect the reality of a speciic population who attends a university hospital and do not necessarily relect the reality of women with UI in general. hese results may contribute to the approach of evaluation and treatment of UI in other services.
References
1. Adams E, Bardsley A, Crumlin L, Currie I, Evans L, Haslam J. Urinary incontinence the management of urinary incontinence in women. Published by the RCOG Press at the Royal College of Obstetricians and Gynaecologists, 27 Sussex Place, Regent’s Park, London NW1 4RG. October 2006. Acesso em 28/10/2008. Available in: http://www.nice.org.uk/nicemedia/ pdf/CG40fullguideline.pdf.
2. Abrams P, Cardoso L, Fall M, Griffiths D, Rosier P, Ulmsten U, et al. The standardisation of terminology of lower urinary tract function: report from the standardisation sub-committee of International Continence Society. Urology. 2003;61(1):37-49.
3. Ko Y, Lin SJ, Salmon JW, Bron MS. The impact of urinary incontinence on quality of life of the elderly. Am J Manag Care. 2005;11(4 Suppl):S103-11.
4. Wagg A, Potter J, Peel P, Irwin P, Lowe D, Pearson M. National audit of continence care for older people: management of urinary incontinence. Age Ageing. 2008;37(1):39-44.
5. Papanicolaou S, Hunskaar S, Lose G, Sykes D. Assessment of bothersomeness and impact on quality of life of urinary incontinence in women in France, Germany, Spain and the UK. BJU Int. 2005;96(6):831-8.
6. Figueiredo EM, Lara JO, Cruz MC, Quintão DMG, Monteiro MVC. Perfil sociodemográfico e clínico de usuárias de serviço de fisioterapia uroginecológica da rede pública. Rev Bras Fisioter. 2008;12(2):136-42.
7. Dumoulin C, Hay-Smith J. Pelvic floor muscle training versus no treatment for urinary incontinence in women. A Cochrane systematic review. Eur J Phys Rehabil Med. 2008;44(1):47-63.
8. Higa R, Lopes MHBM. Porque profissionais de enfermagem com incontinência urinária não buscam tratamento. Rev Bras Enferm. 2007;60(5):503-6.
9. Rett MT, Simões JA, Herrmann V, Gurgel MSC, Morais SS. Qualidade de vida em mulheres após tratamento da incontinência urinária de esforço com fisioterapia. Rev Bras Ginecol Obstet. 2007;29(3):134-40.
10. Ortiz O. Valoración dinâmica de la disfunción perineal da classificación. Boletim de La Sociedad Latino Americana de Uroginecologia y Cirurgia Vaginal. 1994;1(2):7-9.
11. Tamanini JTN, D’Ancona CAL, Botega NJ, Rodrigues Netto Jr N. Validação do “Kings Health Questionaire” para o português em mulheres com incontinência urinária. Rev Saúde Pública. 2003;37(2):203-11.
12. Fleck MPA, Chachamovich E, Trentini CM. Projeto WHOQOL-OLD: método e resultados de grupos focais no Brasil. Rev Saúde Pública. 2003;37(6):793-9.
13. Machado SCEP, Goldim JR, Fleck MPA, Eizirik CL. Performance of a new depression scale in a Brazilian general hospital. Acta Psychiatrica Scandinavica. 2004;110(241 Supl):13.
14. Hannestad YS, Rortveit G, Sandvik H, Hunskaar S; Norwegian EPINCONT study. Epidemiology of Incontinence in the County of Nord-Trøndelag. A community-based epidemiological survey of female urinary incontinence: the Norwegian EPINCONT study. Epidemiology of Incontinence in the County of Nord- Trøndelag. J Clin Epidemiol. 2000;53(11):1150-7.
15. Isherwood PJ, Rane A. Comparative assessment of pelvic floor strength using a perineometer and digital examination. BJOG. 2000;107(8):1007-11.
16. Coppola L, Caserta F, Grassia A, Mastrolorenzo L, Altrui L, Tondi G, et al. Urinary incontinence in the elderly: relation to cognitive and motor function. Arch Gerontol Geriatr. 2002;35(1):27-34.
17. Lewis D. Incontinence survey report. In: Getliffe K, Dolman M. Promoting continence: a clinical and research resource. London: Bailliere Tindall; 1997.
18. Guarisi T, Pinto Neto AM, Osis MJ, Pedro AO, Paiva LHC, Faúndes A. Incontinência urinária entre mulheres climatéricas brasileiras: inquérito domiciliar. Rev Saúde Pública. 2001; 35(5):428-35.
19. Menta S, Schirmer J. Relação entre a pressão muscular perineal no puerpério e o tipo de parto. Rev Bras Ginecol Obstet. 2006;28(9):523-9.
20. Neumann PB, Grimmer KA, Grant RE, Gill VA. Physioterapy for female stress urinary incontinence: a multicentre observational study. Aust N Z J Obstet Gynaecol. 2005;45(3):226-32.
21. Meade-D’Alisera P, Merriweather T, Wentland M, Fatal M, Ghafar M. Depressive symptoms in women with urinary incontinence: a prospective study. Urol Nurs. 2001;21(6):397-9.
22. Dugan E, Cohen SJ, Bland DR, Preisser JS, Davis CC, Suggs PK, et al. The association of depressive symptoms and urinary incontinence among older adults. J Am Geriatr Soc. 2000;48(4):413-6.
23. Lopes MHBM, Higa R. Restrições causadas pela incontinência urinária à vida da mulher. Rev Esc Enferm USP. 2006;40(1):34-41.
24. Huang AJ, Brown JS, Kanaya AM, Creasman JM, Ragins AI, Van Den Eeden SK, et al. Quality-of-life impact and treatment of urinary incontinence in ethnically diverse older women. Arch Intern Med. 2006;166(18):2000-6.