O
RIGINALA
RTICLE Revista Brasileira de FisioterapiaPredictive values at risk of falling in
physically active and no active elderly
with Berg Balance Scale
Valores preditivos para o risco de queda em idosos praticantes e não
praticantes de atividade física por meio do uso da Escala de Equilíbrio de Berg
Gilmar M. Santos1, Ana C. S. Souza2, Janeisa F. Virtuoso3, Graziela M. S. Tavares4, Giovana Z. Mazo5
Abstract
Background: The consequences of falls are a major cause of autonomy and independence loss among the elderly. In this context, the Berg Balance Scale (BBS) has been widely used to detect the risk of falls in elderly. Objective: To evaluate the predictive value of the BBS for fall risk in physically active and inactive elderly subjects. Methods: The sample included 188 older adults with a mean age of 66 (±9) years. Of these, 91 participated in a regular physical activity program and 96 did not. We analyzed the cut-off scores of 45, 47, 49, 51 and 53 in both groups regarding the sensitivity (S), specificity (Sp), positive predictive value (PPV) and negative predictive value (NPV) of the test, including the positive likelihood ratio (PLR) and negative likelihood ratio (RVN) for diagnosing the risk of falls.
Results: The mean BBS score was 54.7 in physically active subjects and 50.8 in inactive subjects, which was statistically significant (ρ=0.001). The best cut-off was a score of 49 for physically inactive subjects, with a sensitivity of 91% and a specificity of 92%. On the other hand, the BBS had low sensitivity (from 0 to 15%) and high specificity (between 83% and 100%) for physically active subjects at the cut-off points analyzed. Conclusion: The scale did not achieve sufficient sensitivity to individual differences among physically active older people with higher levels of functional balance ability.
Keywords: Aged; postural balance; falls; physical activity; sensitivity; specificity.
Resumo
Contextualização: Umas das principais causas da perda da autonomia e independência do idoso são as consequências geradas pelas quedas. Nesse contexto, a Escala de Equilíbrio de Berg (EEB) vem sendo amplamente utilizada para detectar o risco de queda em idosos. Objetivo: Analisar os valores preditivos para o risco de queda em idosos praticantes e não-praticantes de atividade física por meio do uso da EEB. Métodos: Participaram 188 idosos, com média de idade de 66 (±9) anos. Desses, 91 participavam de projetos de atividades físicas, e 96 não praticavam atividade física regularmente. Foram analisados os pontos de corte 45, 47, 49, 51 e 53 em ambos os grupos, quanto à sensibilidade (S), especificidade (E), valor preditivo positivo (VPP) e negativo (VPN) do teste, razão
de verossimilhança positiva (RVP) e negativa (RVN) para diagnóstico do risco de queda. Resultados: Evidenciou-se que a média do
escore da EEB nos praticantes de atividade física foi de 54,7 pontos; enquanto que, entre os não-praticantes, foi de 50,8, obtendo-se diferença significativa entre os grupos (ρ=0,001). Nos sujeitos não-praticantes de atividade física, o melhor ponto de corte foi em 49 pontos, apresentando S de 91% e E de 92%, enquanto a EEB apresentou baixa S, variando entre 0% e 15%, e alta E, variando entre
83% e 100% nos sujeitos praticantes de atividade física regular nos pontos de corte analisados. Conclusão: A escala não alcançou
S suficiente para diferenças individuais entre idosos com altos níveis de capacidade de equilíbrio dentre aqueles que praticam atividades físicas regularmente.
Palavras-chave: idoso; equilíbrio postural; quedas; atividade física; sensibilidade; especificidade.
Received: 21/01/2010 – Revised: 04/07/2010 – Accepted: 16/12/2010
1 Physical Therapy Department, Universidade do Estado de Santa Catarina (UDESC), Florianopolis, SC, Brazil 2 Instituto de Ensino Superior da Grande Florianopolis (IES), São José, SC, Brazil
3 Physical Therapist
4 Physical Therapy Department, Universidade Federal do Pampa (UNIPAMPA), Uruguaiana, RS, Brazil 5 Department of Physical Education, UDESC
Correspondence to: Gilmar Moraes Santos, Rua Professor Bayer Filho, 125, Coqueiros, CEP 88080-300, Florianópolis, SC, Brasil, e-mail: [email protected]
Introduction
According to the Brazilian Institute of Geography and Sta-tistics (IBGE), in 2000 there were nearly 15 million Brazilians over 60 years old, or 8.6% of the population1. It is estimated that
in the next 20 years, Brazil will have the sixth largest popula-tion of elderly people, with more than 30 million inhabitants over 60 years old, or almost 13% of the population1.
he consequences of falls are one of the main causes of autonomy and independence loss in this population2,3.
Epide-miological studies have demonstrated that falls occur at least once a year in 32% of those aged 65 to 74 years, 35% of those between 75 and 84 and 51% of those over 85 years4. In Brazil, it
is estimated that 20 to 30% of elderly people fall at least once a year2,3. Of these, 15 to 50% will be hospitalized or die in the
following year4. According to the Brazilian National Health
Sys-tem/Ministry of Health database (DATASUS), between 1996 and 2005 approximately 24,645 elderly people died due to falls, which ranked as the third leading cause of mortality and the leading cause of hospital admission5.
Due to such considerations, there is a constant concern among health professionals to prevent and mitigate the conse-quences of falls in geriatric health. hus, pursuant to the need for efective assessment of the elderly population, several in-strument models have been developed for the early detection of those with the greatest risk of falls.
Functional clinical tests are among such models and have the advantage of being easy to apply, low cost and having re-sults with more apparent therapeutic implications. he most widely used of these tests are the Berg Balance Scale (BBS), the Clinical Test of Sensory Integration and Balance (CTSIB), the Test of Functional Reach, the Tinetti Balance Scale and the Timed Up and Go Test (TUGT). Each of these tests assesses dif-ferent factors related to balance, and each has its advantages and disadvantages6-9. However, it is of vital clinical importance
to know the most suitable instrument for identifying the risk of falls in each speciic population type.
he BBS has been widely used in research related to the bal-ance of elderly people. However, some studies10,11 have reported
that this instrument is unreliable for detecting the risk of falls among the elderly. Other studies6,12,13, on the other hand,
recom-mend it or consider it the gold standard14-16. his study, therefore,
aimed to analyze the predictive values of the BBS for fall risk among both physically active and inactive elderly people.
Methods
his study was approved by the Ethics Committee on Hu-man Research of the Universidade do Estado de Santa Catarina
(UDESC), Florianopolis, SC, Brazil, under protocol nº 057/07 and was performed in accordance with Resolution 196/96 of the National Health Council for Human Research. All partici-pants signed an informed consent statement.
his descriptive cross-sectional study selected individuals of both genders over 60 years old who either practiced some form of regular physical activity or not and who had no history of lower-limb or spinal surgery in the previous 12 months, no musculo-skeletal or neurological disorders of the vestibular or cerebellar systems that might interfere with or prevent the assessment of balance, did not use any type of device to help support their body weight (cane, crutch or walker) and who had no cognitive impair-ment according to the Mini Mental State Examination (MMSE)17.
he sample consisted of 188 elderly people, 91 enrolled in physical activity projects organized by the UDESC Geriatrics Research Group (GETI) and 96 sedentary elderly people who frequented local community groups in the Florianopolis region.
he subjects were initially asked about their age, physical activity level, associated diseases and any falls they had suf-fered in the previous 12 months. he veriication of falls via self-reporting may lead to bias, especially when the recall pe-riod is too long. However, other studies6,13,17-19 that adopted the
parameters were taken as a basis.
After this step, the assessment of functional mobility and balance with the BBS was carried out.
he BBS assesses the dynamic and static balance of indi-viduals and their risk of falls, considering the environmental inluence on function. It assesses balance performance via 14 tasks, including the individual’s ability to sit, stand, reach, turn 360˚, look over his shoulders, stand on one foot, and place one foot on a stair or stool while standing unsupported. It has a maximum score of 56 points and a minimum of 0; each task has ive possible scores ranging from 0 to 4 points. he BBS was translated into Portuguese and culturally adapted for use in Brazil. he Brazilian version of the BBS showed high intra- and interater reliability (ICC 0.99 and 0.98, respectively), proving its usefulness in assessing the balance of elderly Brazilians20.
he materials used were: one chair with arm support whose seat was 42 cm high and whose back support was 62 cm high; another chair with neither arm nor back support that was 42 cm high; one 15-cm high step; one 150 cm measuring tape; one stopwatch and one 5 x 11 cm box. During assessment, sub-jects were instructed to wear their normal shoes.
he study included six evaluators: three physical therapists and three physical therapy students in the sixth semester of their course. All evaluators were previously trained and had prior expe-rience in balance analysis with the BBS in other studies.
A descriptive data analysis was conducted using frequency tables for categorical variables and measures of position and dispersion for continuous variables.
he Mann-Whitney U-test was used for comparison between groups, since data was not normally distributed. he chi-square test was used to compare frequencies of qualitative variables between groups. A signiicance level of 5% (ρ=0.05) was used for all tests.
In order to clarify how the BBS’s diagnostic accuracy was evalu-ated, Table 1 was created. In it, the words “current condition” and “non-current condition” identify individuals with and without self-reported falls. he terms “positive” and “negative” test result are related to the cutof point at which all subjects with a BSS score less than or equal to the cutof point were considered positive (i.e., at risk of falling) and those who had a BBS score higher than the cut-of point were considered negative (i.e., without risk cut-of falling). he letters “a”, “b”, “c” and “d” were used to reference the cells in Table 2.
he BBS cutof points were analyzed in both groups re-garding sensitivity (S), speciicity (SP), positive (PPV) and negative predictive value (NPV) of the test and positive (PLR) and negative likelihood ratio (NLR) of diagnosing the risk of falling10,13,21-23. he cutof points used to detect fall risk in both
groups were: 45, 47, 49, 51 and 53, and were based on studies by Berg et al.6, Shumway-Cook et al.12, Riddle and Stratford13 and
Alzayer, Beninato and Portney21. he abbreviation, formula and
purpose of each measure of quality are shown in Table 2.
Results
A sample of 188 elderly people with a mean age of 66 (±9) years, body mass of 71.1 (±14) kg, height of 1.56 (±0.08) m and
Body Mass Index of 28.9 (±5.1) kg/m2 participated in this study
(Table 3). he types of physical activity practiced by the group of active elderly people were water aerobics (62.6%), swimming (29.7%) and others such as gymnastics and walking (24.2%). A total of 16.5% of the elderly people practiced more than one type. All classes were held twice a week for 50 minutes. he exercise was of moderate intensity, i.e., practitioners had to exert physical efort to carry it out and faster breathing was involved.
Among physically active subjects, 23 (25.2%) self-reported a fall in the previous year, while in the inactive group, 37 did so (38.5%), which was a statistically signiicant diference (ρ=0.02). he BBS scores in the active group ranged from 48 to 56 points (mean = 54.7). Among inactive subjects, scores varied from 30 to 56 points (mean = 50.8). he intergroup diference was signiicant (ρ=0.001) (Table 4).
he S and SP of the cutof point 49 were 91% and 92%, respec-tively, in the inactive group. However, in the active group, the S was low (5%) for detecting the probability of a fall (Table 5).
With a score of less than or equal to 49 points, the ma-jority (86.5%) of inactive subjects showed a history of falls
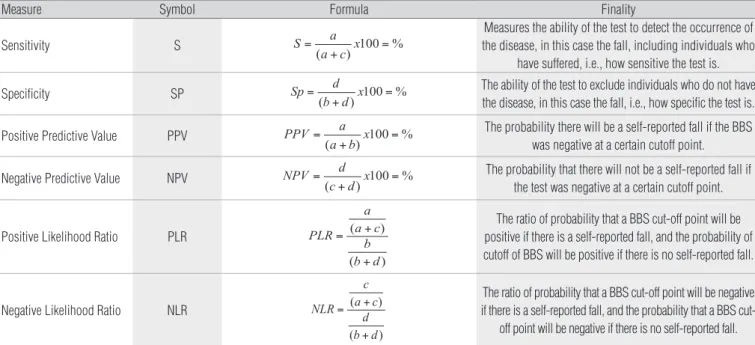
Table 2. Abbreviations, formulas and purpose of the quality measures: sensitivity, specificity, positive and negative predictive value, and positive and negative likelihood ratio.
a = history of falling and positive test results, b = no history of falling and positive test results, c = history of falling and negative test results, d= no history of falling out and negative test results.
Measure Symbol Formula Finality
Sensitivity S S a
a c x
=
+ =
( ) 100 %
Measures the ability of the test to detect the occurrence of the disease, in this case the fall, including individuals who
have suffered, i.e., how sensitive the test is.
Specificity SP Sp d
b d x
=
+ =
( ) 100 %
The ability of the test to exclude individuals who do not have the disease, in this case the fall, i.e., how specific the test is.
Positive Predictive Value PPV PPV a a b x
=
+ =
( ) 100 %
The probability there will be a self-reported fall if the BBS was negative at a certain cutoff point.
Negative Predictive Value NPV NPV d c d x
=
+ =
( ) 100 %
The probability that there will not be a self-reported fall if the test was negative at a certain cutoff point.
Positive Likelihood Ratio PLR PLR a a c
b b d
= +
+
( )
( )
The ratio of probability that a BBS cut-off point will be positive if there is a self-reported fall, and the probability of cutoff of BBS will be positive if there is no self-reported fall.
Negative Likelihood Ratio NLR NLR c a c
d b d
= +
+
( )
( )
The ratio of probability that a BBS cut-off point will be negative if there is a self-reported fall, and the probability that a BBS
cut-off point will be negative if there is no self-reported fall. Table 1. Composition of the validity indices adopted in the study.
Test Result Historical of Fall
Current condition Non-current condition
Positive True Positive (a) False Positive (b)
Negative False Negative (c) True Negative (d)
(positive test) and were classified as at risk of falling (PPV). However, only 13.5% of these individuals were wrongly clas-sified as at risk of falling, which is considered to be a low error rate (Table 5).
Generally speaking, it can be said that, regardless of the studied cutof point, the BBS had low S values for physically ac-tive elderly subjects (0% to 15%). hus, it appears that the test does not satisfactorily predict the risk of falling among active subjects. Among those with higher scores (48 to 56 points), a ceiling efect (when a test score reaches its upper limit) was found, demonstrating that the BBS is not a good clinical tool for identifying fall risk among physically active elderly people.
Discussion
he current literature features several tests for evaluating the balance, functional mobility and risk of falls in elderly peo-ple6-9. However, the sensitivity and speciicity of particular tests
for detecting changes in balance and predisposition to falling are not clear for each population type.
Among the most widely used of these tests is the BBS, whose best cutof point in this study was 49 for inactive elderly people. his point represented the best match between BBS score and self-reported history of falls, with a high S (91%) for detecting those at risk of falling and a high SP (92%) for identifying those not at risk.
However, for the physically active group, the BBS had a low S (5-15%) for identifying those at risk of falling and a high SP (94-100%) for detecting those who had not sufered falls. hus, the BBS is not the best clinical tool for identifying the risk of falls in this population.
Similar to our results, an attempt to develop a predictive model of fall risk among community elderly with and without a history of falls by Shumway-Cook et al.12 also resulted in 49
points as the best cutof point. he authors found that 77% of elderly people had a previous history of falls (S), and 86% did not (SP), concluding that this scale was sensitive enough to detect the risk of falls in the studied sample.
Table 4. Score of the Berg Balance Scale between the elderly groups practitioners and non-practitioners of physical activities in relation to history of falling.
x=mean; SD=standard deviation.
Score Practitioners Non-Practitioners
With a History of falling Without a history of falling With a History of falling Without a history of falling
30-40 0 0 4 0
41-45 0 0 6 0
46 0 0 5 0
47 0 0 6 0
48 1 1 3 2
49 0 0 8 3
50 0 1 1 4
51 1 2 0 10
52-53 1 8 1 10
56 17 59 1 32
x (SD) 54.7 (±1.74) 50.8 (±4.98)
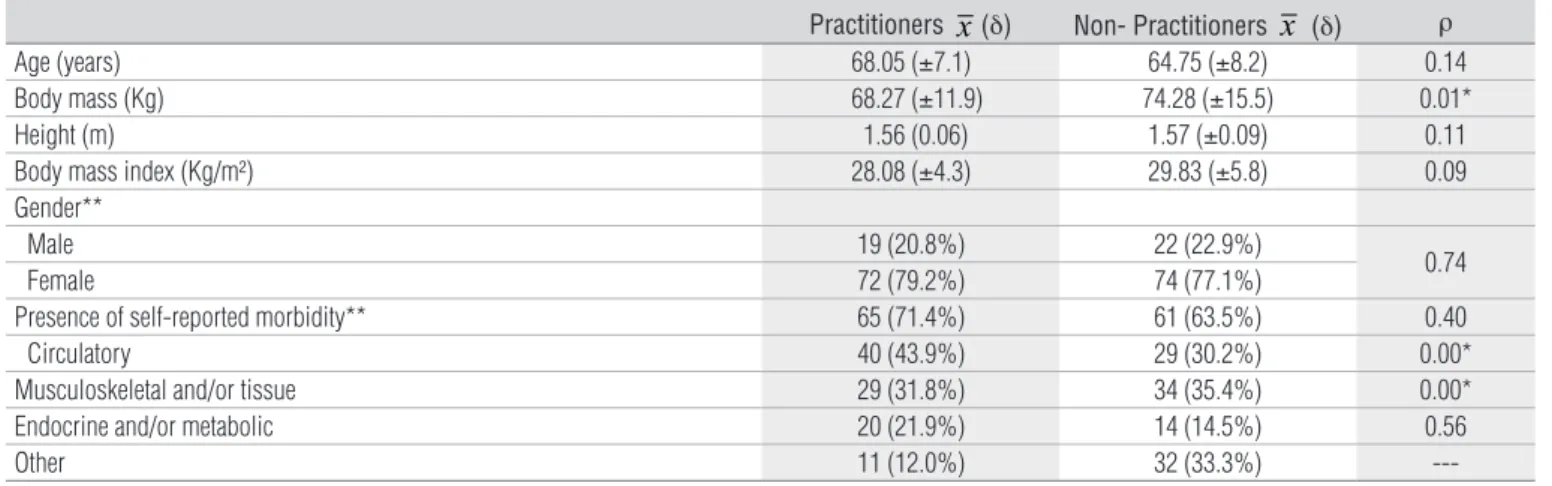
Tabela 3. Characterization of physically active and inactive elderly subjects.
* ρ<0.05; **frequencies and percentages.
Practitioners x(δ) Non- Practitioners x (δ) ρ
Age (years) 68.05 (±7.1) 64.75 (±8.2) 0.14
Body mass (Kg) 68.27 (±11.9) 74.28 (±15.5) 0.01*
Height (m) 1.56 (0.06) 1.57 (±0.09) 0.11
Body mass index (Kg/m²) 28.08 (±4.3) 29.83 (±5.8) 0.09
Gender**
Male 19 (20.8%) 22 (22.9%)
0.74
Female 72 (79.2%) 74 (77.1%)
Presence of self-reported morbidity** 65 (71.4%) 61 (63.5%) 0.40
Circulatory 40 (43.9%) 29 (30.2%) 0.00*
Musculoskeletal and/or tissue 29 (31.8%) 34 (35.4%) 0.00*
Endocrine and/or metabolic 20 (21.9%) 14 (14.5%) 0.56
Other 11 (12.0%) 32 (33.3%)
Muir et al.10, who analyzed the S and SP of the BBS for
pre-dicting falls in independent elderly people with no neurological deicits over one year, commented that the S of diferent cutof points analyzed ranged from 25 to 42% and the SP was between 86% and 87%. hese same authors reported that the high cut-of value required to optimize the S in each category cut-of falls in elderly people indicates that the impairment of balance by itself does not deine the increased risk of falls and that falls are common among elderly people with scores above 45 points.
Riddle and Stratford13 reported that the best BBS cutof was 50
points, resulting in 85% and 73% for S and SP, respectively. At a 55-point cutof, they found a high S of 97%, but a very low SP of 26%. In the original study by Berg et al.6, the cutoff point of
45 was used to calculate the probability of a relative risk of falls as a demonstration of predictive validity. Corroborat-ing this, Holbein-Jenny et al.24 also demonstrated that the
best cutoff was 45. However, both the present and previ-ous studies11-13 have declined to recommend this value as a
cutoff point for BBS.
here is considerable disagreement in the literature con-cerning the BBS cutof point. his can be explained by difer-ences in study samples, e.g., elderly nursing home residents who use assistive devices for walking and have neurological deicits show remarkable diferences with those without such deicits and who reside in their own home. However, all studies agreed that the lower the performance by elderly individuals on the BBS, the higher the likelihood of falls. With this in mind, it is of great importance that the cutof point for this test be adapted to each type of population, since neurological, orthopedic and visual factors, lifestyle and physical activity level, etc., directly inluence BBS performance.
In this study, the sedentary group showed a high NPV, indi-cating that 94.9% of elderly people with scores above 49 points were classiied as having no fall risk. hus, 4.1% of the subjects who scored over 49 points on the BBS were false negatives and classiied as being at risk of falling, which is a very low error rate. he PPV of this sample showed that 86.5% of the individu-als with a score below 49 points self-reported a fall and were
classiied as being at high risk of fall; however, 13.5% of those who did not self-report a fall were false positives, which was an acceptable error rate for this type of instrument.
Moreover, the PLR was 10.2, i.e., an elderly person with a score below 49 has about ten times more chance of falling than someone with a higher score. he NLR was 0.09, indicating that someone with score above 49 points is 0.09 times more likely to fall. hese data conirm that the best cutof point for the sample of inactive elderly people was 49 points.
However, the BBS showed a PPV ranging between 0 and 50% for physically active elderly individuals, which is con-sidered too low to classify those who self-report a fall at the analyzed cutof points. Consequently, the PLR was very low, ranging between 0.88 and 1.04, which conirms that the BBS was not able to predict falls in this population. In this context, Muir et al.10 reported that a PLR of approximately 1 indicates
that the instrument is not sensitive enough to predict falls, and thus did not recommended its application.
Riddle and Stratford13 consider 50 the best cutof point with
a PPV of 57%, an NPV of 92%, a PLR of 3.1 and an NLR of 0.2. At this cutof point, individuals with scores ≤50 points were three times more likely to sufer falls than those who scored over 50 points, which represents a 0.2 times higher chance of falling. hese authors concluded that despite the heterogeneity of the sample in their study, the BBS was considered sensitive.
Muir et al.10 reported that a cutof point of 54 had an S
be-tween 61 and 62% and an SP bebe-tween 51 and 53% for elderly individuals with no history of falls and for those whose falls had resulted in injury, respectively. A cutof point of 53 resulted in an S of 69%, an SP of 57% and a very low PLR (approximately 1) in elderly people with multiple falls. hus, the authors sug-gested that the use of the BBS to identify those at high risk of falling should be discouraged because it was not able to iden-tify most of the elderly people who had sufered falls. he pre-dictive validity of this scale in elderly people with a history of multiple falls is higher than for those without falls or those who have had a single fall, and the likelihood ratio demonstrated an increased risk of falls throughout the entire score range.
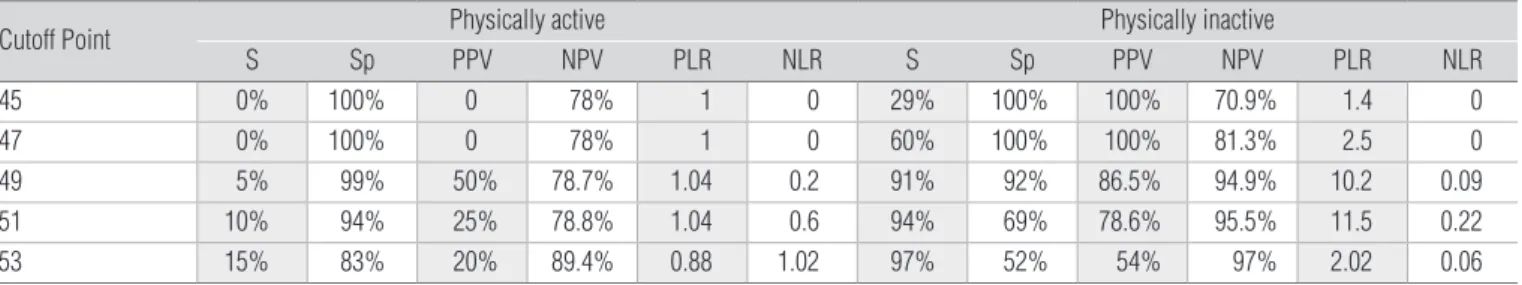
Table 5. Sensitivity, specificity, positive predictive value, negative predictive value, positive likelihood ratio and negative likelihood ratio for BBS cutoff points among physically active and inactive elderly subjects.
S=sensitivity; Sp=specificity; PPV=positive predictive value; NPV=negative predictive value; PLR=positive likelihood ratio; NLR=negative likelihood ratio.
Cutoff Point Physically active Physically inactive
S Sp PPV NPV PLR NLR S Sp PPV NPV PLR NLR
45 0% 100% 0 78% 1 0 29% 100% 100% 70.9% 1.4 0
47 0% 100% 0 78% 1 0 60% 100% 100% 81.3% 2.5 0
49 5% 99% 50% 78.7% 1.04 0.2 91% 92% 86.5% 94.9% 10.2 0.09
51 10% 94% 25% 78.8% 1.04 0.6 94% 69% 78.6% 95.5% 11.5 0.22
53 15% 83% 20% 89.4% 0.88 1.02 97% 52% 54% 97% 2.02 0.06
Bogle, Thorbahn and Newton11 reported that the level
of physical activity seems not to influence performance on the BBS, which disagrees with the results of the present study. However, these authors explain their result as being due to the methodology used to classify the level of physi-cal activity, since the scoring systems involved may not have been sufficiently sensitive to variations in individual activ-ity patterns. Moreover, these same authors reported that the performance of daily activities contributes 43% to BBS performance scores. Perracini and Ramos3, Yap et al.25 and
Rosa et al.26 all demonstrated a strong association between
functional status and the occurrence of falls, suggesting that the loss of functional capacity seems to have a role in the multifactorial interaction that leads to falls, which calls for further investigation.
According to the literature, physical activity is the primary means of promoting geriatric health and it has been proposed as an efective intervention for preventing falls27,28. Its beneits have
been widely studied29-31, and include improved functional
capac-ity, balance, strength, coordination and speed of movement, which thereby contributes to greater security and fall preven-tion. However, it has been observed that even with regular physi-cal activity, there is still a signiicant proportion of elderly people who fall (25.2%), which suggests that the intensity of physical exercise may be important for reducing this prevalence.
Furthermore, the higher number of musculoskeletal disor-ders among the inactive elderly may justify the low BBS val-ues, although these indings reiterate the importance both of physical activity and the need to develop better balance for fall prevention. Likewise, physical activity can lead to signiicant
diferences in body mass, which are not necessarily apparent in body mass index results.
Brauer, Burns and Galley32, who assessed the balance of
100 healthy elderly women with a mean age of 73.0±5.0 years, reported that the BBS results indicated a ceiling efect for both the group with a history of falls and the group without one. his means that the BBS could not detect a risk of falling in this population. he same phenomenon was observed by Newton33,
who evaluated 251 community-dwelling older adults with a mean age of 74.0±7.0 years and who suggested that modiica-tions should be made to the BBS when it is applied to active elderly people33,34.
Based on the results of both this study and the above-cited studies, a cutof of 49 points for inactive older adults showed an excellent S, SP, PPV and NPV, PLR and NLR, indicating that this scale is sensitive to individual diferences in the sample, thus war-ranting its implementation. However, the BBS was not sensitive for active elderly people, resulting in a poor S, SP, PPV and NPV, PLR and NLR due to the ceiling efect observed in the sample. he BBS, therefore, is insensitive to individual diferences among active elderly individuals with very high levels of balance ability, and should not be recommended for this population.
he use of other instruments, such as the Timed Up and Go, Speed Gait and Dynamic Gait Index may be more useful for identifying the risk of falls in physically active elderly people.
Despite the cross-sectional design, we believe that the indings of this study can signiicantly contribute to the clinical practice of professionals who deal with the elderly population. A suggestion for future studies would be longitudinal follow-up that could ac-curately identify the occurrence of falls among elderly people.
References
1. IBGE (Instituto Brasileiro de Geografia e Estatística). Perfil dos Idosos Responsáveis pelos Domicílios. 2002. Disponível em: http://www.ibge.gov.br/home/presidencia/ noticias/25072002pidoso.shtm
2. Silvestre JA, Costa Neto MM. Abordagem do idoso em programas de saúde da família. Cad Saúde Pública. 2003;19(3):839-47.
3. Perracini MR, Ramos LR. Fatores associados a quedas em uma coorte de idosos residentes na comunidade. Rev Saúde Pública. 2002;36(6):709-16.
4. Baraff LJ, Della Penna R, Williams N, Sanders A. Practice guideline for the ED Management of falls in community – dwelling elderly persons. Ann Emerg Med. 1997;30(4):480-9.
5. Alves Jr ED. Analecto Treinamento PREV-Quedas. Rio de Janeiro: SESI-RJ; 2009.
6. Berg KO, Maki BE, Williams JI, Holliday PJ, Wood-Dauphinee SL. Clinical and laboratory measures of postural balance in an elderly population. Arch Phys Med Rehabil. 1992;73(11):1073-80.
7. Chiu AY, Au-Yeung SS, Lo SK. A comparison of four functional tests in discriminating fallers from non-fallers in older people. Disabil Rehabil. 2003;25(1):45-50.
8. Cho CY, Kamen G. Detecting balance deficits in frequent fallers using clinical and quantitative evaluation tools. J Am Geriatr Soc. 1998;46(4):426-30.
9. Nakamura DM, Holm MB, Wilson A. Measures of balance and fear of falling in the elderly: a review. Phys Occup Ther Geriatr. 1999;15(4):17-32.
10. Muir SW, Berg K, Chesworth B, Speechley M. Use of the Berg Balance Scale for predicting multiple falls in community-dwelling elderly people: a prospective study. Phys Ther. 2008;88(4):449-59.
11. Bogle Thorbahn LD, Newton RA. Use of the Berg Balance Test to predict falls in elderly persons. Phys Ther. 1996;76(6):576-83.
12. Shumway-Cook A, Baldwin M, Polissar NL, Gruber W. Predicting the Probability for Falls in Community-Dwelling Older Adults. Phys Ther.1997;77(8):812-9.
13. Riddle DL, Stratford PW. Interpreting validity indexes for diagnostic tests: an illustration using the Berg balance test. Phys Ther. 1999;79(10):939-48
14. Southard V, Dave M, Davis MG, Blanco J, Hofferber A. The Multipe Task test as a predictor of falls in older adults. Gait Posture. 2005;22(4):351-5.
15. Whitney SL, Poole JL, Cass SP. A review of balance instruments for older adults. Am J Occup Ther. 1998;52(8):666-71.
16. Tyson SF, DeSouza LH. Reliability and validity of functional balance tests post stroke. Clin Rehabil. 2004;18(8):916-23.
17. Lourenço RA, Veras RP. Mini-Exame do Estado Mental: características psicométricas em idosos ambulatoriais. Rev Saúde Pública. 2006;40(4):712-9.
18. Bishop MD, Patterson TS, Romero S, Light KE. Improved fall-related efficacy in older adults related to changes in dynamic gait ability. Phys Ther. 2010;90(11):1598-606.
19. Wennie Huang WN, Perera S, VanSwearingen J, Studenski S. Performance measures predict onset of activity of daily living difficulty in community-dwelling older adults. J Am Geriatr Soc. 2010;58(5):844-52.
20. Miyamoto ST, Lombardi Jr I, Berg KO, Ramos LR, Natour J. Brazilian version of the Berg balance scale. Braz J Med Biol Res. 2004;37(9):1411-21.
21. Alzayer L, Beninato M, Portney LG. The accuracy of individual Berg Balance Scale items compared with the total Berg score for classifying people with chronic stroke according to fall history. J Neurol Phys Ther. 2009;33(3):136-43.
22. Beninato M, Portney LG, Sullivan PE. Using the International Classification of Functioning, Disability and Health as a framework to examine the association between falls and clinical assessment tools in people with stroke. Phys Ther. 2009;89(8):816-25.
23. Dibble LE, Lange M. Pedicting falls in individuals with Parkinson disease: a reconsideration of clinical balance measures. J Neurol Phys Ther. 2006;30(2):60-7.
24. Holbein-Jenny M, Billek-Sawhney B, Beckman E, Smith T. Balance in personal care home residents: A comparasion of the Berg Balance Scale, the Multi-Directional Reach Test, and the Activities-Specific Balance Confidence Scale. J Geriatr Phys Ther. 2005;28(2):48-53.
25. Yap LK, Au SY, Ang YH, Ee CH. Nursing Home Falls: A Local Perspective. Ann Acad Med Singapore. 2003,32(6):795-800.
26. Rosa TEC, Benício MHD, Latorre MRDO, Ramos LR. Fatores determinantes da capacidade funcional entre idosos. Rev Saúde Pública. 2003;37(1):40-8.
27. Ramos BMB. Influências de um programa de atividade física no controle do equilíbrio de idosos [monografia]. São Paulo: USP; 2003.
28. Ribeiro TV. Estudo do equilíbrio estático e dinâmico em indivíduos idosos. [dissertação]. Porto: Faculdade de Desporto da Universidade do Posto; 2009.
29. Matsudo SMM. Envelhecimento e atividade física. Londrina: Midiograf; 2001.
30. Spirduso WW. Dimensões físicas do envelhecimento. Barueri, SP: Manole; 2005.
31. Gallahue DL, Ozmun JC. Compreendendo o desenvolvimento motor: bebês, crianças, adolescentes e adultos. 3ª ed. São Paulo: Phorte; 2005.
32. Brauer SG, Burns YR, Galley P. A prospective study of laboratory and clinical measures of postural stability to predict community-dwelling fallers. J Gerontol A Biol Sci Med Sci. 2000;55(8):M469-76.
33. Newton RA. Balance screening of an Inner city older adult population. Arch Phys Med Rehabil. 1997;78(6):587-91.
34. Langley FA, Mackintosh SFH. Functional balance assessment of older community dwelling adults: a systematic review of the literature. IJAHSP. 2007;5(4):1-11.