O
RIGINALA
RTICLE ©Revista Brasileira de FisioterapiaMaximal respiratory pressure in healthy 20 to
89 year-old sedentary individuals of central
São Paulo State
Pressões respiratórias máximas em indivíduos saudáveis sedentários de 20 a 89
anos da região central do Estado de São Paulo
Rodrigo P. Simões1, Ana P. L. Deus1, Marco A. Auad2, Jadiane Dionísio1, Marisa Mazzonetto3, Audrey Borghi-Silva1
Abstract
Objectives: To evaluate respiratory muscle strength (RMS) in a sample composed exclusively of healthy sedentary individuals and to compare with predicted values, to investigate the relationship between maximal inspiratory pressure (MIP) and maximal expiratory pressure (MEP) and age, weight and height, and propose predictive equations of MIP and MEP for this population. Methods: Subjects were 140 healthy and sedentary individuals: 70 males (55±20 years) and 70 females (54±21 years), separated into groups according to age. The RMS was obtained with an aneroid vacuum manometer (±300 cmH2O). Results: There was a significant reduction in RMS with
increasing age (ANOVA one-way, p<0.05). Moreover, the RMS values decreased significantly from age 40 compared to the predicted values (Student t test, p<0.05). There were also significant correlations of RMS with age, weight and height (Pearson correlation, p<0.05). The predictive equations using linear regression for maximal respiratory pressures according to sex showed that age in males and females and weight in females influenced the prediction of the MIP and MEP values. Conclusions: Our results showed that age and anthropometric characteristics influence RMS values. In addition, the RMS values were lower compared to the predicted values from age 40 because the sample was composed exclusively of sedentary individuals. In this context, we propose equations to predict the MIP and MEP values exclusively for healthy, sedentary individuals from 20 to 89 years of age.
Article registered in the Australian New Zealand Clinical Trials Registry (ANZCTR) under the number ACTRN12608000511336.
Key words: respiratory system; respiratory muscles; muscle strength.
Resumo
Objetivos: Avaliar a força muscular respiratória (FMR) em uma amostra composta apenas por indivíduos sedentários saudáveis e comparar com os valores preditos; correlacionar os valores de pressão inspiratória máxima (PImáx) e expiratória máxima (PEmáx) com a idade, peso e altura, e propor equações preditivas de PImáx e PEmáx para essa população. Métodos: Foram selecionados 140 indivíduos saudáveis e sedentários, sendo 70 homens (55±20 anos) e 70 mulheres (54±21 anos) que foram separados em grupos de acordo com a idade. A FMR foi obtida por meio de um manovacuômetro aneroide (±300 cmH2O). Resultados: Foi verificada redução
significativa da FMR com o avançar da idade (ANOVA one-way, p<0,05). Além disso, os valores de FMR foram significativamente menores em relação aos valores preditos a partir dos 40 anos (Teste t de Student, p<0,05). Também foram observadas correlações significativas da FMR com a idade, peso e altura (correlação de Pearson, p<0,05). Quando realizadas as equações preditivas por meio de regressão linear para as pressões respiratórias máximas em cada gênero, verificou-se que a idade em ambos os sexos e o peso para as mulheres exerceram influência na predição dos valores de PImáx e PEmáx. Conclusões: Os resultados mostraram que a idade e as características antropométricas exercem influência nos valores de FMR. Os valores de FMR foram menores em relação aos valores preditos devido ao fato de a amostra ser composta exclusivamente por sujeitos sedentários. Neste contexto, propõem-se equações para predizer os valores de PImáx e PEmáx exclusivamente para indivíduos saudáveis sedentários de 20 a 89 anos. Artigo registrado na Australian New Zealand Clinical Trials Registry (ANZCTR) sob o número ACTRN12608000511336.
Palavras-chave: sistema respiratório; músculos respiratórios; força muscular.
Received: 29/10/2008 – Revised: 16/03/2009 – Accepted: 19/05/2009
1 Department of Physical Therapy, Universidade Federal de São Carlos (UFSCar), São Carlos (SP), Brazil 2 Department of Biotechnology, UFSCar
3 Department of Physical Therapy, Universidade Camilo Castelo Branco (UNICASTELO), Descalvado (SP), Brazil
Correspondence to: Rodrigo Polaquini Simões, Laboratório de Fisioterapia Cardiopulmonar, Departamento de Fisioterapia, UFSCar, Rodovia Washington Luiz, km 235, Monjolinho, CEP 13565-905, São Carlos (SP), Brazil, e-mail: [email protected]
61
Introduction
Respiratory muscle strength (RMS) is related to itness, post-surgical morbidity and mortality1 and individual
ventila-tory capacity2. Dysfunction in this musculature can lead to
hyperventilation, reduction in exercise tolerance and even respiratory insuiciency3. he evaluation of RMS is of great
clinical importance4 and can be measured by static and
dy-namic maneuvers. Static maneuvers infer RMS through the measurement of sub- and supra-atmospheric pressure gener-ated by the inspiratory and expiratory muscles respectively, i.e. maximal inspiratory pressure (MIP) and maximal expiratory pressure (MEP). hese pressures evaluated through the mouth relect the pressure that is being generated by the action of respiratory muscles1,5,6. his technique has been widely used
and its objectives are to identify possible weakness, fatigue and respiratory muscle failure7, as well as to quantify the
ef-fects of respiratory training8,9. he evaluation of respiratory
muscle strength through maximal respiratory pressure (MRP) has been used since the 1960s and 70s because of its important diagnostic and prognostic role in neuromuscular10, lung11 and
cardiovascular12 disease. It is a quick, simple, practical, low-cost
and non-invasive method13-15 for the evaluation of both healthy
individuals and individuals with certain chronic diseases2.
Interestingly, studies have found a link between RMS and the level of physical activity evaluated by the Baecke, Burema and Frijters16 questionnaire, an instrument validated in
Bra-zil17 which has questions about sports activities, occupation
and leisure habits. Neder et al.1 evaluated peripheral muscle
strength through the peak torque of knee extensors, and RMS of 100 healthy subjects. he authors found a positive correlation between both measures (RMS and peripheral muscle strength) and the level of physical activity, regardless of the subjects’ sex and age. Furthermore, no study was conducted using a sample composed only of sedentary individuals. Studying this popula-tion, it would be possible to propose predicted MIP and MEP
values that can be more comparable to many disorders and diseases. Considering the fact that the RMS values are directly linked to the level of physical activity, the purposes of this study were to evaluate the values obtained for maximal respiratory muscle strength in a sample composed only of healthy, seden-tary individuals and compare them with predicted values, to investigate the relationship between the MIP and MEP values and age, weight and height, and propose predictive equations for MIP and MEP in health, sedentary Brazilian individuals.
Methods
Subjects
Subjects were invited by previously distributed pamphlets and were submitted to screening. One hundred and forty indi-viduals were selected from six cities in central São Paulo state and were evaluated at three universities in this region. he sub-jects studied were students, staf and individuals participating in other university programs. None of the subjects had knowl-edge of the measurements taken or the proposed objectives of the study.Subjects were between 20 and 89 years old, and they were separated into two groups: male (M) (N=70) and female (F) (N=70). Each group was divided into seven subgroups of 10 individuals according to age, subgroup 1 (S1): 20 to 29 years, S2: 30 to 39 years, S3: 40 to 49 years, S4: 50 to 59 years, S5: 60 to 69 years, S6: 70 to 79 years, and S7: 80 to 89 years of age (more details about subject characteristics in Results - Table 1).
Ethics aspects
All of the procedures were described in detail in the consent form signed by the subjects prior to the study. he subjects were also informed of the objectives of the study, which was in accor-dance with resolution 196/96 of the National Health Council,
Subgroups /
age (years) N PAP
Males (N=70) Females (N=70)
Age (years)
Height (m)
Weight (Kg)
BMI (Kg/m2)
Age (years)
Height (m)
Weight (Kg)
BMI (Kg/m2)
20-29 (S1) 10 7.9±0.8 25±2 1.73±0.02 74±7 24±2 24±2 1.64±0.04* 62±8* 23±2
30-39 (S2) 10 7.1±0.5 35±2 1.71±0.10 79±13 27±3 35±4 1.64±0.05* 62±7* 23±3*
40-49 (S3) 10 6.7±0.7 45±2 1.70±0.09 70±4 24±1 45±3 1.65±0.06 68±4* 25±2
50-59 (S4) 10 6.9±0.6 56±2 1.66±0.05 68±3 25±1 55±3 1.62±0.03 65±4* 25±1
60-69 (S5) 10 6.2±0.6 65±3 1.65±0.03 63±3 23±2 65±2 1.61±0.04 66±3 26±1*
70-79 (S6) 10 6.1±0.3 75±3 1.61±0.06 65±3 25±2 75±2 1.58±0.03 62±3 25±2
80-89 (S7) 10 6.1±0.2 84±2 1.59±0.03 62±3 25±2 86±3 1.59±0.02 63±4 25±1
Table 1. Anthropometric characteristics of subjects according to sex and age subgroups.
62
and with the Declaration of Helsinki developed by the World Medical Association. Additionally, this study was approved by the Human Research Ethics Committee of Universidade Camilo Castelo Branco under protocol number 566-761/04.
Criteria for inclusion
Subjects in this study were clinically healthy, sedentary in-dividuals with a BMI between 18.5 and 24.9 Kg/m2 and between
25.0 and 29.9 Kg/m2 in accordance with the World Health
Orga-nization classiications18 for healthy and overweight
individu-als, respectively. Aside from this, subjects had normal values of lung function, no habit of smoking, no cardiovascular or respiratory disease, no skeletal muscle and neuromuscular dis-eases, no cognitive deicits and no diiculty in understanding the maneuver procedures. hey did not present sleep dyspnea, cyanosis or thoracic structural alterations and had not had an infection in the previous six months.
Clinical evaluation
Individuals were considered healthy based on previous clinical and physical exams and an anamnesis that included identiication data, past illnesses and surgeries. A comprehensive medical history was also taken. he evaluations were performed by a physician at each university. A visual examination was then administered to identify possible alterations in the thoracic and abdominal regions such as cutaneous folds and accentuated structural deviations in the spine that might alter respiratory dynamics.
Additional exams also performed were: a resting 12-lead standard electrocardiogram (Electrocardiograph – FUNBEC, São Paulo, SP, Brazil); oxygen peripheral saturation (Takaoka Oxifast, São Paulo, SP, Brazil); heart rate measurement (cardiac monitor - Ecaix TC 500, São Paulo, SP, Brazil) and respiratory rate; arterial pressure (sphygmomanometer – BD, São Paulo, SP, Brazil) and spirometry. he spirometry tests were performed using the Vitalograph 2120 portable spirometer (Vitalograph Ltda, Buckingham, England). he subjects completed at least three acceptable maximal forced and slow expiratory maneu-vers. Technical procedures, acceptability and reproducibility criteria were those recommended by the American horacic Society and by the Brazilian Respiratory Society19-21.
Physical activity pattern
To evaluate the physical activity of the subjects, questions about sports activities, occupation and leisure habits were detailed and quantiied by the Baecke, Burema and Frijters16
questionnaire for epidemiological studies. he questionnaire included four questions about sport activities, eight about
occupational activities and four about leisure habits. his questionnaire was validated in Brazil by Florindo and Latorre17
in 2003. According to the sum of the questionnaire scores, in-dividuals could be classiied as sedentary, active or trained. In accordance with the criteria for inclusion in the sample, only sedentary individuals were selected, i.e. with scores up to 8 (47 subjects scored 6, 51 scored 7 and 42 scored 8).
Anthropometry
Body height was determined using a stadiometer. Total body mass was measured using a calibrated scale (Welmy, São Paulo, SP, Brazil). Both measurements were performed while the subjects were standing barefoot and wearing light clothing.
he collection and evaluation of personal data, anthropo-metric measurements and respiratory muscle strength were carried out at the research facilities of each of the three uni-versities. he procedures were always performed at the same time of day (in the morning). he temperature (between 22 and 24°C) and the humidity (between 40 and 60%) at each evalua-tion site were maintained using a thermo-hygrometer (Minipa – MT 242, Planalto Paulista, SP, Brazil).
Respiratory muscle strength
In accordance with the protocol described by Neder et al.1 for
obtaining MIP and MEP, an aneroid vacuum manometer (GER-AR, São Paulo, SP, Brazil) with an operational interval of ±300 cmH2O was used. A rubber tube mouthpiece with internal diameter of 32 mm was coupled with a plastic piece that had a leak with a diameter of approximately 2 mm7 that allowed a small amount
of air to escape to avoid any elevation of pressure within the oral cavity by contraction of the facial muscles22. his plastic piece was
coupled with a 30-cm trachea of 30 mm in diameter attached to the vacuum manometer, accordingmanufacturer speciications.
First, the subjects were instructed to remain in a seated position. A demonstration of how the maneuvers should be carried out was given and then performed by the subject, after the placement of a nose clip. he subjects were instructed to keep their lips sealed tightly around the mouthpiece so no air could escape. Additionally, the calibration of the equipment was tested weekly, assuring reliability of the data collected.
he MIP values were obtained by inspiration from residual volume (RV)23, which was repeated at least three times with a
one-minute interval between repetitions. he MEP was then obtained by expiration from total lung capacity (TLC), using the same methodology applied in the inspiration23. During the MIP
63
approximately one second and the highest value was computed from a minimum of three repetitions for each maneuver(at dif-ferences of 10% or less between values for each repetition)1.
he vacuum manometry measurements for all individuals were carried out by a single evaluator, with standardized ver-bal instructions, and were always performed at the same time of day (in the morning).he evaluations were performed by the same examiners (three physical therapists). he irst was responsible for personal data collection and application of the physical activity questionnaire, the second responsible for an-thropometric assessments, and the third for any procedure re-lated to respiratory pressure measurements (demonstration of maneuvers, application of techniques and verbal commands).
To calculate the predicted RMS values, we considered the equations of Neder et al.1, Black and Hyatt22 and Vincken, Ghezzo
and Cosio24. For each value of the predictive equations, we
con-sidered the lower and upper thresholds of normality, adding or subtracting from the predicted value the product between 1.645 and the standard error of the estimate (1.645xSEE)25.
Statistical analysis
he sample size was calculated by using the software Graph-Pad StatMate, version 1.01. To attain statistical signiicance (p<0.05 at a power of 95% with a conidence interval of 5%), a sample size of nine subjects was required for each subgroup in each group to obtain a 0.2 diference in MIP and MEP in males and females (total sample of 126 individuals). However, the total sample was 140.
he Kolmogorov-Smirnov test was applied to verify the distribution of the data, and after normal distribution was conirmed, it was then matched with paired samples. To com-pare the obtained values with the predicted values for MRP, the Student t test for independent samples was used. Analysis of
variance (ANOVA) was used to determine diferences among groups. If a signiicant F-ratio was obtained, then the post-hoc comparisons were made using the Tukey-Kramer test.
An analysis of the correlation of MRP to the age, weight, and height of the subjects was done using the Pearson correlation. Multiple linear regression was used to obtain predictive values for MRP in relation to age, weight, and height. he probability of a type I error was established at 0.05 for all tests. he data was analyzed using the software Statistica for Windows (Stat-Soft Inc., 2000) and Statistical Package for the Social SciencesTM
(SPSS – IBM, version 10.0.1, 1999).
Results
After inviting the subjects by pamphlets, 203 subjects arrived for the initial screening, however, 19 were excluded for having a
BMI above 30 kg/m2, 15 for being former smokers, 13 for scoring
9 on the Baecke, Burema and Frijters16 questionnaire which is
considered physically active, 9 due to inluenza or chronic ob-structive pulmonary disease (COPD) diagnosis and 7 subjects for diiculty performing respiratory maneuvers (MIP and/or MEP). herefore our sample was composed of 140 subjects.
he racial proile of the studied population was heteroge-neous: 62% of the subjects were considered as “white” (33% male and 29% female), 17% as “brown” (10% male and 7% female), 13% as “black” (4% male and 9% female), and 8% as “yellow” (3% male and 5% female). Each subject reported the central region of State of São Paulo as their place of birth. Table 1 shows the characteristics of the subjects studied in relation to age, weight, height and body mass index (BMI) in mean and standard deviations.
With regard to the spirometry evaluation, the variables were expressed as % of predicted value (mean±SD). he vari-ables were: forced vital capacity (FVC: males=98±9% and females=97±10%), forced expiratory volume in 1 s (FEV1: males=92±8% and females=93±7%) and FVC/ FEV1 ratio: males=0.78±0.07 and females=0.79±0.04). hese data for nor-mal lung function and respiratory symptoms were required for inclusion in the study sample.
Table 1 shows the anthropometric characteristics for male and females with comparisons between genders according to age group. Females in S1, S2, S3 and S4 presented signiicantly lower weight. hey presented signiicantly lower height only in S1 and S2. he BMI for females was signiicantly lower only in S2 and S5.
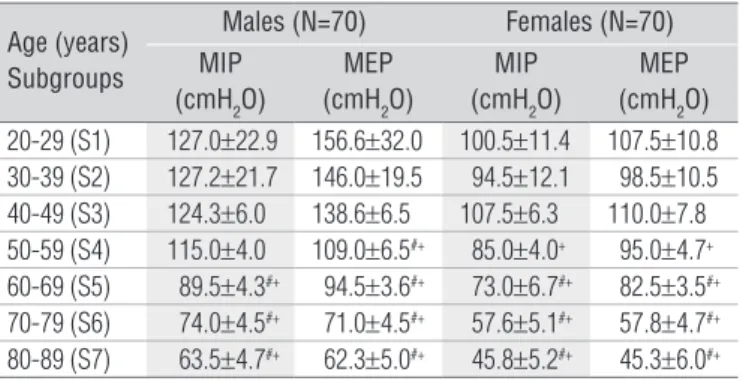
he respiratory pressure values obtained are presented in mean and standard deviation, separated by age group and sex in Table 2. When intragroup comparisons were made, signiicant reductions in MIP were veriied in males at every two decades in subgroups S3 and S5, S4 and S6, and S5 and S7.
Age (years) Subgroups
Males (N=70) Females (N=70)
MIP (cmH2O)
MEP (cmH2O)
MIP (cmH2O)
MEP (cmH2O)
20-29 (S1) 127.0±22.9 156.6±32.0 100.5±11.4 107.5±10.8 30-39 (S2) 127.2±21.7 146.0±19.5 94.5±12.1 98.5±10.5 40-49 (S3) 124.3±6.0 138.6±6.5 107.5±6.3 110.0±7.8 50-59 (S4) 115.0±4.0 109.0±6.5#+ 85.0±4.0+ 95.0±4.7+ 60-69 (S5) 89.5±4.3#+ 94.5±3.6#+ 73.0±6.7#+ 82.5±3.5#+ 70-79 (S6) 74.0±4.5#+ 71.0±4.5#+ 57.6±5.1#+ 57.8±4.7#+ 80-89 (S7) 63.5±4.7#+ 62.3±5.0#+ 45.8±5.2#+ 45.3±6.0#+ Table 2. Values of maximal respiratory pressure obtained for each subgroup.
Data expressed in mean and standard deviation. N=number of subjects; MIP=maximal inspiratory pressure; MEP=maximal expiratory pressure; S1=20-29 years; S2=30-39 years; S3=40-49 years; S4=50-59 years; S5=60-69 years; S6=70-79 years; S7=80-89 ye-ars; #significant difference between subgroups every two decades (p<0.05); + Significant
64
However, at every three decades for males, there was a reduc-tion from S2 to S5, S3 to S6 and from S4 to S7. When MEP val-ues were compared every two decades, signiicant reductions were veriied between S2 and S4, S3 and S5, S4 and S6, and S5 and S7 and, every three decades, between S1 and S4, S2 and S5, S3 and S6, and S4 and S7. For both MIP and MEP in females, the comparative analysis for every two subgroups resulted in sig-niicant reductions between S3 and S5, S4 and S6, and S5 and S7, while for each three decades these reductions were found between S1 and S4, S2 and S5, S3 and S6, and S4 and S7.
A signiicant negative correlation was veriied between age and MIP (p<0.0001; r=-0.84) as well as MEP (p<0.0001; r=-0.91) in males. A negative correlation was also observed for MIP (p<0.0001; r=-0.86) and MEP (p<0.001; r=-0.86) in fe-males. When weight and maximal respiratory pressures were compared, a positive correlation was veriied for males:MIP (p=0.0001; r=0.58) and MEP (p<0.0001; r=0.60), and females: MIP (p=0.02; r=0.30) and MEP (p=0.04; r=0.20). A positive corre-lation was also found between MIP and MEP values for height in males (MIP: p<0.0001; r=0.55 and MEP: p<0.0001; r=0.61) and in females (MIP: p<0.0001; r=0.49 e MEP: p=0.002; r=0.38).
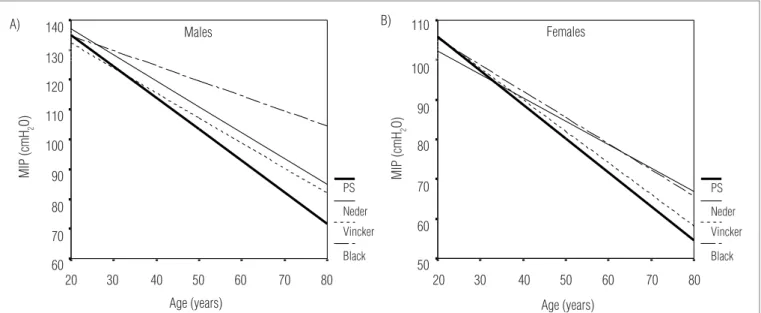
When compared with the predicted MIP values, the ob-tained values were signiicantly lower from age 40 for both men and women (Figure 1, A and B). To draw the predicted lines (Figure 1) and to compare with the values of the pres-ent study, we considered the upper and lower thresholds of normality for each value.Table 3 presents the multiple linear regression data to predict the MIP and MEP values in males and females as a function of age, height and weight. In fe-males, age and weight were predictors of MIP and MEP. In males, however, only age had an independent predictive role for MIP and MEP.
Discussion
he main indings of this study showed that RMS decreases with age and that MIP and MEP values presented signiicant cor-relation with age, weight and height for both sexes. Moreover, we noted that the MIP values were signiicantly lower compared to the predicted values from age 40. When age, height and weight were considered together in linear regression analysis, we found
Variable Sex Age (years) Height (m) Weight (kg) Constant R2 SEE
MIP (cmH2O) M -0.76±0.08 - - 125.13±58.38 0.72 14.97
F -0.85±0.05 - -0.30±0.05 80.7±41.95 0.84 41.95
MEP (cmH2O) M -0.83±0.05 - - 87.69±41.95 0.84 15.00
F -0.89±0.06 - -0.18±0.06 125.12±54.09 0.77 11.90
Table 3. Linear prediction equations for maximal inspiratory pressure (MIP) and expiratory pressure (MEP) in males (M) and females (F) aged 20 to 89.
Values represent coefficient estimates followed by the respective standard error of the estimate. R2=coefficient of determination; SEE=standard error of the estimate. All regressions
were statistically significant (p<0.05); MIP (M)=-0.76 (age) + 125; SEE=14.97; MIP (F)=-0.85 (age) + 80.7 + (-0.3) weight; SEE=41.95; MEP (M)=-0.83 (age) + 87.69; SEE=15.00; MEP (F)=-0.89 (age) + 125.1 + (-0.18) weight; SEE=11.90.
Figure 1. Tendency line of observed and predicted values of maximal inspiratory pressure (MIP) reported in the present study (PS) and in the previous studies. Note that PS presented significantly lower values in comparison with predicted values from age 40 in both males and females (p<0.05). To draw the predicted lines and to compare with the PS values, the upper and lower thresholds of normality for each value were considered.
Males Females
MIP (cmH
2
O)
A) B)
MIP (cmH
2
O)
60 70 80 90 100 110 120 130 140
60
50 70 80 90 100 110
20 30 40 50 60 70 80 20 30 40 50 60 70 80
PS Neder Vincker Black
PS Neder Vincker Black
65
that the age and weight of females inluenced the prediction of MRP values. As for men, only age inluenced the MRP values.
We believe that the reductions in MRP, found for every two and three decades in both males and females, may be due to the aging process, a fact which is made more evident by the negative correlation veriied between age and RMS. he nega-tive correlations found between age and MRP for both sexes were high and corroborate the results found by Neder et al.1
and Vincken, Ghezzo and Cosio24, but diverge from those of
Bruschi et al.26 and McElvaney et al.27. Various hypotheses have
tried to explain this negative correlation. Enright et al.28
sug-gest that it occurs due to the loss of muscle mass, especially in the diaphragm and accessory respiratory muscles. In contrast, other authors1 believe there is an increase in abdominal
com-pliance with age that dissipates the pressure generated during forced expiration to lower the MEP. In addition, this is the irst study that compared only sedentary individuals, while other studies mixed sedentary and physically active subjects.
Berry et al.29 reported that there is a decrease in RMS with
age and, consequently, a loss of ventilation. Pride30 describes
that the physical properties of the lungs and rib cage inevita-bly change with age, leading to alterations in the quantity and composition of connective lung tissue components such as elastin, collagen and proteoglycans. Furthermore, the chest wall becomes more rigid due to the calciication of the ribs and vertebrae joints, reducing its expansion and, as a result, its strength30-32. hese alterations in the physical properties of the
lung relect changes in volume and capacity, such as vital ca-pacity, residual volume and functional residual capacity which together increase lung volume and consequently cause muscle shortening and diminish inspiratory muscle strength33.
Weight is another factor that can inluence lung pressure variables, as we found a signiicant positive correlation in both sexes, although they appeared to be of a moderate magnitude for males and low magnitude for females. his inding is sup-ported by, Shoenberg, Beck and Bouhuys34, who state that
weight afects pressure variables due to the increase in volume and size of respiratory muscles that occurs with the increase in body weight, which consequently improves the strength of the muscles and ventilatory function. Leech et al.35, Harik-Khan,
Wise and Fozard2 and Carpenter et al.36 have also found a
cor-relation between MRP and weight. However Vincken, Ghezzo and Cosio24 state that there is no relationship between these
variables, in disagreement with our results. Possible explana-tions can be based on the fact that the weight did not neces-sarily relect the lean body mass. In contrast, when the variable weight was considered in multiple regression analysis, it was a positive predictor for both MIP and MEP only in females (Ta-ble 3). In view of the relationship between strength and muscle mass, this inding is unexplained. However, in our study it was
not possible to come to further conclusions on these aspects without a more detailed evaluation of body composition, since strength is directly linked to lean mass, and knowing that in men the lean mass is greater, the correlation was better. In multiple regression analysis, the factors that have a negative inluence are: age and weight. his can be explained due to increasing of body weight in women that is related to a possible increase in fat mass but not to an increase of free fat mass. However, as we did not evaluate body composition, these indings are specula-tive in this study.
Height showed a positive correlation of moderate magni-tude for males and lower magnimagni-tude for females, in both MIP and MEP. his is likely to relect an associationbetween stature and respiratory muscle strength. Also, lungfunction studies have found that lung volumes are directly relatedto height37.
herefore, as respiratory muscle strength can also evaluate lung function, respiratory muscle performance may also explain the relationship between lung function and height.
Several studies1,5 involving the Brazilian population have
been conducted, but to the best of our knowledge, there is no published source about predictive values of RMS exclusively for healthy, sedentary individuals. In this sense, we propose to evaluate and predict normal values for this population, since there are studies that report the relationship between physi-cal activity level and RMS. In this context, we observed that after age 40 the reduction in RMS was greater in our popu-lation when compared with others (Figure 1). hese results can be explained due to the signiicant reduction in muscle strength that occurs with age, which can be further enhanced by physical inactivity.
Power and Criswell38 reported that increased strength and
muscular endurance capacity is linked to the level of physical activity. Studies1,28 showed that physical inactivity promotes
loss of peripheral and respiratory muscle mass. Neder et al.1
reported a positive and signiicant association between pe-ripheral muscle strength (measured by the knee extensors) and respiratory muscle strength (measured by the MIP and MEP). hey observed that individuals with lower peripheral muscle strength showed efective reduction in respiratory muscle strength. here also appears to be a relationship between up-per limb muscle strength and RMS as reported by Enright et al.28 in a study with older adults, in which the authors found a
positive correlation between RMS and handgrip values. Parreira et al.39, with a sample from Minas Gerais (Brazil),
compared the obtained values with the values predicted by Neder et al.1, and the authors veriied that the proposed
66
References
1. Neder JA, Andreoni S, Lerario MC, Nery LE. Reference values for lung function tests. II. Maximal respiratory pressures and voluntary ventilation. Braz J Med Biol Res. 1999;32(6):719-27.
2. Harik-Khan RI, Wise RA, Fozard JL. Determinants of maximal inspiratory pressure. The baltimore longitudinal study of aging. Am J Respir Crit Care Med. 1998;158(5 Pt 1):1459-64.
3. Janssens JP, Pache JC, Nicod LP. Physiological changes in respiratory function associated with ageing. Eur Respir J. 1999;13(1):197-205.
4. Man WD, Kyroussis D, Fleming TA, Chetta A, Harraf F, Mustfa N, et al. Cough gastric pressure and maximal expiratory mouth pressure in humans. Am J Respir Crit Care Med. 2003;168(6):714-7.
5. Camelo Jr JS, Terra Filho JT, Manço JC. Pressões respiratórias máximas em adultos normais. J Pneumol. 1985;11(4):181-4.
6. Green M, Road J, Sieck GC, Smilowski T. Tests of respiratory muscle strength. Am J Respir Crit Care Med. 2002;166:528-42.
7. Chetta A, Harris ML, Lyall RA, Raffety GF, Polkey MI, Olivieri D, et al. Whistle mouth pressure as test of expiratory muscle strength. Eur Respir J. 2001;17(4):688-95.
8. Huang CH, Martin AD, Davenport PW. Effects of inspiratory strength training on the detection of inspiratory loads. Appl Psychophysiol Biofeedback. 2009;34(1):17-26.
9. Nicks CR, Morgan DW, Fuller DK, Caputo JL. The influence of respiratory muscle training upon intermittent exercise performance. Int J Sports Med. 2009;30(1):16-21.
10. Foglio K, Cline E, Facchetti D, Vitacca M, Marangoni S, Bonomelli M, et al. Respiratory muscle function and exercise capacity in multiple sclerosis. Eur Respir J. 1994;7(1):23-8.
11. Nishimura Y, Tsutsumi M, Nakata H, Tsunenari T, Maeda H, Yokoyama M. Relationship between respiratory muscle strength and lean body mass in men with COPD. Chest. 1995;107(5):1232-6.
the predicted values (Figure 1) because our sample is com-posed exclusively of sedentary individuals. herefore, the po-tential implications of this study relate to proposing predicted MIP and MEP values that can be more comparable with many disorders and diseases, since physical activity can modify RMS. his data can be used in the evaluation of this population and to verify the efects of many interventions such as rehabilita-tion programs and speciic respiratory muscle training.
Certain limitations of this study must be considered. It was not possible to perform a cardiopulmonary test for all individu-als. However we applied a validated method of quantiication
of physical activity16. In addition, it was not possible to evaluate
the body mass composition, which would be important in the interpretation of the results of this study. here was no com-parison between MEP and predicted values due to the scarcity of data in the literature for this measure.
We conclude that RMS decreases with age in both sexes. Moreover, RMS is related to age, weight and height. he RMS val-ues were lower compared to the predicted valval-ues from age 40. Ad-ditionally, the negative inluence of age on RMS for both sexes and of age and weight for females were strong predictors of MIP and MEP in healthy, sedentary individuals of central São Paulo state.
12. van der Palen J, Rea TD, Manolio TA, Lumley T, Newman AB, Tracy RP, et al. Respiratory muscle strength and the risk of incident cardiovascular events. Thorax. 2004;59(12):1063-7.
13. Johan A, Chan CC, Chia HP, Chan OY, Wang YT. Maximal respiratory pressures in adult Chinese, Malays and Indians. Eur Respir J. 1997;10(12): 2825-8.
14. Kim J, Sapienza CM. Implications of expiratory muscle strength training for rehabilitation of the elderly: tutorial. J Rehabil Res Dev. 2005;42(2):211-24.
15. Steier J, Kaul S, Seymour J, Jolley C, Rafferty G, Man W, et al. The value of multiple tests of respiratory muscle strength. Thorax. 2007;62(11):975-80.
16. Baecke JA, Burema J, Frijters JE. A short questionnaire for the measurement of habitual physical activity in epidemiological studies. Am J Clin Nutr. 1982;36(5):936-42.
17. Florindo AA, Latorre MRDO. Validação do questionário e reprodutibilidade de Baecke de avaliação da atividade física habitual em homens adultos. Rev Bras Med Esporte. 2003;9(3):121-8.
18. Obesity: preventing and managing the global epidemic. Report of a WHO consultation. World Health Organ Tech Rep Ser. 2000;894:i-xii,1-253.
19. Lung function testing. Selection of reference values and interpretative strategies. American Thoracic Society. Am Rev Respir Dis. 1991;144(5):1202-18.
20. Sociedade Brasileira de Pneumologia e Tisiologia (SBPT). I consenso brasileiro sobre espirometria. J Pneumol. 1996;22(3):105-64.
21. Sociedade Brasileira de Pneumologia e Tisiologia (SBPT). Diretrizes para testes de função pulmonar. J Pneumol. 2002;28(Suppl 3):S1-238.
22. Black LF, Hyatt RE. Maximal respiratory pressures: normal values and relationship to age and sex. Am Rev Res Dis. 1969;99(5):696-702.
67
24. Vincken W, Ghezzo H, Cosio MG. Maximal static respiratory pressures in adults: normal values and their relationship to determinants of respiratory function. Bull Eur Physiopathol Respir. 1987;23(5):435-9.
25. Souza RB. Pressões respiratórias estáticas máximas. J Pneumol. 2002;28(Suppl 3):S155-65.
26. Bruschi C, Cerveri I, Zoia MC, Fanfulla F, Fiorentini M, Casali L, et al. Reference values of maximal respiratory mouth pressures: a population-based study. Am Rev Respir Dis. 1992;146(3):790-3.
27. McElvaney G, Blackie S, Morrison NJ, Wilcox PG, Fairbarn MS, et al. Maximal static respiratory pressures in the normal elderly. Am Rev Respir Dis. 1989;139(1):277-81.
28. Enright PL, Kronma R, Manollo TA, Schenker MB, Hyatt RE. Respiratory muscle strength in the elderly. Correlates and reference values. Am J Respir Crit Care Med. 1994;149(2 Pt 1):430-8.
29. Berry JK, Vitalo CA, Larson JL, Patel M, Kim MJ. Respiratory muscle strength in older adults. Nurs Res. 1996;45(3):154-9.
30. Pride NB. Ageing and changes in lung mechanics. Eur Respir J. 2005;26(4):563-5.
31. Berend N. Normal ageing of the lung: implications for diagnosis and monitoring of asthma in older people. Med J Aust. 2005;183 (1 Suppl):S28-9.
32. Chaunchaiyakul R, Groeller H, Clarke JR, Taylor NA. The impact of aging and habitual physical activity on static respiratory work at rest and during exercise. Am J Physiol Lung Cell Mol Physiol. 2004;287(6):1098-106.
33. Derenne JP, Macklem PT, Roussos C. The respiratory muscles: mechanics, control and pathophysiology. Am Rev Respir Dis. 1978;118(1):119-31.
34. Shoenberg JB, Beck GJ, Bouhuys A. Growth and decay of pulmonary function in healthy blacks and whites. Respir Physiol. 1978;33(3):367-93.
35. Leech JA, Ghezzo H, Stevens D, Becklake MR. Respiratory pressures and function in young adults. Am Rev Respir Dis. 1983;128(1):17-23.
36. Carpenter MA, Tockman MS, Hutchinson RG, Davis CE, Heiss G. Demographic and anthropometric correlates of maximum inspiratory pressure: the arteriosclerosis risk in communities study. Am J Respir Crit Care Med. 1999;159(2):415-22.
37. O’Brien RJ, Drizd TA. Roentgenographic determination of total lung capacity: normal values from a national population survey. Am Rev Respir Dis. 1983;128(5):949-52.
38. Powers SK, Criswell D. Adaptive strategies of respiratory muscles in response to endurance exercise. Med Sci Sports Exerc. 1996;28(9):1115-22.