Printed in Brazil - ©2006 Sociedade Brasileira de Química 0103 - 5053 $6.00+0.00
Article
*e-mail: [email protected]
Analysis of Liquid Stevioside and Cyclamate-Saccharin Dietetic Sweeteners by Inductively
Coupled Plasma Optical Emission Spectrometry without Sample Treatment
Rafael Arromba de Sousa, Nivaldo Baccan and Solange Cadore*
Instituto de Química, Universidade Estadual de Campinas CP 6154, 13084-971 Campinas-SP, Brazil
A determinação de espécies inorgânicas em adoçantes líquidos à base de ciclamato-sacarina e esteviosídeo é descrita. O método, sem tratamento prévio da amostra, é baseado na espectrometria de emissão óptica em plasma com acoplamento indutivo. Parâmetros instrumentais foram otimizados de acordo com a robustez do plasma e a razão sinal analítico/ sinal de fundo. A exatidão foi avaliada para As, Ca, Cd, Co, Cu, Fe, Mg, Mn, Ni, Pb e Zn empregando experimentos de adição e recuperação. Os valores de recuperação ficaram entre 90 e 110% para a maioria dos analitos, os RSDs obtidos foram, em geral, menores que 5% e os limites de detecção ficaram na faixa de 0,7 (Mg) a 71 (Pb) µg L-1. Não foi detectada a presença de As, Co e Pb. As concentrações de Cu e Zn foram semelhantes para as amostras de ciclamato-sacarina e esteviosídeo enquanto as demais espécies mostraram diferenças.
An analytical method for the determination of inorganic species in liquid cyclamate-saccharin and stevioside sweeteners is presented. The method is based on inductively coupled plasma optical emission spectrometry and allowed analysis without prior sample treatment. Instrumental parameters were optimized according to plasma robustness and the signal to background ratio. The accuracy of the method was evaluated for As, Ca, Cd, Co, Cu, Fe, Mg, Mn, Ni, Pb, and Zn employing analyte addition and recovery experiments. The recovery values were between 90 and 110% for the majority of the analytes, the RSDs obtained were, in general, lower than 5% and the limits of detection were in the range 0.7 (Mg) – 71 (Pb) µg L-1. The analyses of different samples indicated that the average values of many of the analytes studied were different for the two types of samples. Copper and Zn concentrations were in the same range and As, Co, and Pb were not detected in any samples.
Keywords: dietetic sweeteners, inorganic species, ICP OES, instrument optimization, axial view
Introduction
While many people are used to consuming a lot of sugar as a part of their diets, scientists have been observing an increase in health problems such as dental caries, type II diabetes and obesity. Consequently the substitution of common sugar by other sweetening substances has been changing alimentary habits and has also generated many discussions.1,2
The use of sweeteners instead of sucrose allows obtaining low calorie foods with normal sweetness3 and
it may be appropriate for people who have restrictions on the ingestion of sucrose, fructose and glucose, like those obese and the diabetics.2,3
In this context the use of edulcorants such as cyclamate, saccharin and stevioside has became popular in Brazil, Europe and Asia, where they are commonly used in the production of light and diet foods and also of “sweetener products”, called dietetic sweeteners or tabletop sweeteners.1,2,4
In the last 50 years much research has been done in order to find substitutes for sucrose2,3 and also to monitor the quality
of foods containing edulcorants. The evaluation of aspartame degradation in beverages,5 the determination of contaminants
such as methanol6 and aniline7 in beverages containing
aspartame and cyclamate, respectively, are some examples. On the other hand, it is difficult to find papers that report the presence of inorganic species in sweeteners,8
J. Braz. Chem. Soc.
the artificial ones, such as cyclamate and saccharin. The former are extracted from the plant Stevia rebaudiana Bertoni9,10 and both edulcorant types are industrially
processed, which means they may be exposed to contamination sources related to processing; some synthetic routes employ inorganic reagentsand besides the machinery generally used are made of stainless steel, which may contaminate the final product with inorganic elements such as As, Cd, Fe, Ni, and Pb.10
Thus, the aim of this work was to develop an analytical method for the determination of inorganic species (As, Ca, Cd, Co, Cu, Fe, Mg, Mn, Ni, Pb, and Zn) in liquid dietetic sweeteners (stevioside and cyclamate-saccharin) and to evaluate the presence of these species in commercial samples. Inductively coupled plasma optical emission spectrometry (ICP OES) was employed for this purpose, due to its characteristics which are appropriate for this study, such as simultaneous, multi-elemental capability, good detectability, a large linear range of analytical response10 and the possibility of introducing some kinds
of samples without a mineralization step.11
Experimental
Instrumentation
The analytical measurements were made with a simultaneous Perkin-Elmer ICP OES, model Optima 3000DV (Norwalk, CT, USA), equipped with a peristaltic pump, a cross-flow nebulizer coupled to a Ryton double pass spray chamber (Scott type) and a ceramic central torch tube injector with an internal diameter of 2.0 mm. This instrument has a solid-state segmented array charge coupled device (SCD) detector and operates in radial and axial torch configurations. For the axial viewing mode, which was employed in this work, the cool plasma recombination area was striped off with a shear gas
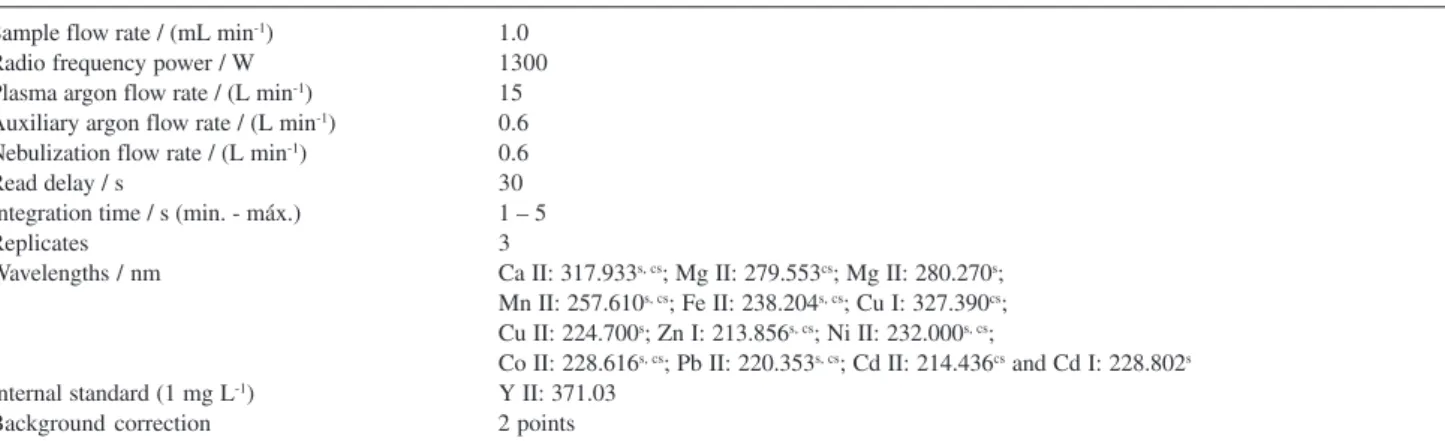
interface (N2). The entire system is controlled with PE Winlab software. The spectrometer conditions of operation are presented in Table 1.
Solutions, reagents and samples
Pure argon (99.996%, White Martins, SP, Brazil) was used. Analytical solutions (1000 mg L-1 in 2% v/v HNO
3,
Carlo Erba Analyticals) of each analyte were used for preparation of multielemental calibration standards in 0.3% v/v HNO3. All the glassware used was cleaned with dilute nitric acid (10% v/v) and then with deionized water (MilliQ system, 18.2 MΩ cm).
The samples studied correspond to 22 dietetic sweeteners of different brands (7 stevioside sweeteners and 15 cyclamate-saccharin sweeteners) purchased in the local supermarkets. The chemical composition of these samples is slightly different, but there are common components such as sodium cyclamate and sodium saccharin, stevioside, preservatives (methylparaben, propylparaben or sodium benzoate), and thickeners.
Procedure
Solutions containing 90% (v/v) of the matrix were prepared with 2% (v/v) HNO3 and, for the optimization studies, two samples of cyclamate-saccharin sweetener named “Ac” and “Bc” were spiked with Ca, Cd, Co, Cu, Fe, Mg, Mn, Ni, Pb, and Zn and analyzed at different nebulization gas flow rates (from 0.2 to 1.0 L min-1), plasma
powers (from 1200 to 1500 W) and auxiliary gas flow rates (from 0.3 to 1.0 L min-1), in an univariate form. The analyzed
samples were prepared in duplicate and the results were evaluated by comparing plasma robustness and the signal to background ratio (SBR) for Mn. Plasma robustness was calculated by dividing the Mg II for Mg I sample emission
Table 1. Instrument operating conditions for the determination of metallic species in stevioside and cyclamate-saccharin sweetener
Sample flow rate / (mL min-1) 1.0
Radio frequency power / W 1300
Plasma argon flow rate / (L min-1) 15
Auxiliary argon flow rate / (L min-1) 0.6
Nebulization flow rate / (L min-1) 0.6
Read delay / s 30
Integration time / s (min. - máx.) 1 – 5
Replicates 3
Wavelengths / nm Ca II: 317.933s, cs; Mg II: 279.553cs; Mg II: 280.270s;
Mn II: 257.610s, cs; Fe II: 238.204s, cs; Cu I: 327.390cs;
Cu II: 224.700s; Zn I: 213.856s, cs; Ni II: 232.000s, cs;
Co II: 228.616s, cs; Pb II: 220.353s, cs; Cd II: 214.436cs and Cd I: 228.802s
Internal standard (1 mg L-1) Y II: 371.03
Background correction 2 points
intensities.12 The SBR was considered as the analyte
emission intensity divided by the blank signal.13
Using optimized instrument conditions (plasma power of 1300 W, 0.6 L min-1 of nebulization flow rate and 0.6 L
min-1 of auxiliary gas flow rate) and yttrium as internal
standard (1 mg L-1), analyte addition and recovery
experiments for species studied were carried out for samples “Ac”, “Bc” and also for two stevioside sweeteners (“As” and “Bs”), in order to evaluate matrix and spectral interferences, adequate wavelengths and the accuracy of the proposed method, since there is no available certified reference material for dietetic sweeteners.14
After the optimization of the experimental parameters, samples were analyzed employing the conditions presented in Table 1.
Results and Discussions
Sample preparation
In preliminary experiments it was observed that the acidification of samples with HNO3 led to the formation of precipitates, probably composed by organic substances insoluble in acidic medium. Since sample acidification occurs during analytical studies (addition of analytes to carry out addition and recovery experiments, addition of internal standards, etc), sample solutions were prepared containing a maximum acid concentration of 0.3% (v/v) added as HNO3 and this quantity of acid showed to be adequate in avoiding any precipitation that could lead to analytical errors.
Plasma optimization
For the instrument optimization of plasma spectrometers the plasma robustness has been evaluated by many researchers.12,15,16 The atomization-excitation processes are
favorable in the plasma when the local thermodynamic equilibrium is attained and the energy transfer processes are more effective. This situation characterizes a robust plasma and may be advantageous to decompose organic samples and to minimize matrix effects, mainly interferences of easily ionized elements, such as Na, K, and Ca.17 Robustness as a parameter is calculated by
dividing the emissions of the ionic (280.270 nm) and atomic (285.213 nm) lines of Mg12 and a Mg II/Mg I ratio equal or
higher than 10 represents a robust plasma.17
For the nebulization gas flow rate (NFR) evaluation, the plasma power (1300 W) and the auxiliary gas flow rate (0.5 L min-1) were fixed and the NFR was varied. The
results obtained are presented in Figure 1.
It can be seen in Figure 1 that plasma robustness varied with the NFR in the same way for samples “Ac” and “Bc” and the higher values were obtained when 0.4 and 0.5 L min-1 nebulization gas flow rates were used. For 0.5 L
min-1 the Mg II/Mg I was 11 for both samples and the
RSD for the emissions of Mg presented smaller values than the ones obtained for 0.4 L min-1 (although the ratio
was higher). Thus, the value of 0.5 L min–1 for the NFR
was considered more adequate.
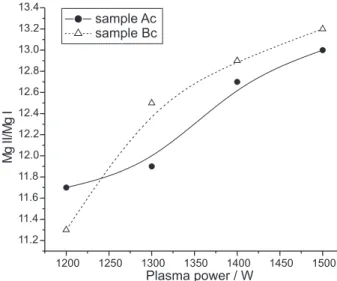
Afterwards the plasma power was varied from 1500 to 1200 W in order to choose the best value. It was observed that below 1200 W, such as 1100 and 1000 W, the plasma generated was not stable and the obtained results are presented in Figure 2.
The Mg II/Mg I ratios were higher than 10 for all evaluated plasma powers. So, an adequate value was selected evaluating an auxiliary parameter, the signal to background ratio (SBR) for Mn, as studied in previous
Figure 2. Mg II/Mg I ratio for samples “Ac” and “Bc”. Operational con-ditions: nebulization flow rate: 0.5 L min -1 and auxiliary gas flow rate:
0.5 L min -1.
J. Braz. Chem. Soc.
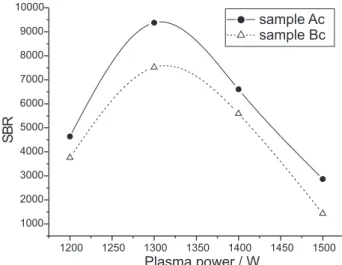
works18,19 for a different matrix. The SBR obtained for
the studied plasma powers are shown in Figure 3.
Figure 3 shows that the highest SBR was attained when a plasma power of 1300 W was used. This means that with this condition analytical measurements are more sensitive, being advantageous for the determination of micro constituents.
Finally, the auxiliary gas flow rate was evaluated adopting the same approach that the nebulization gas flow rate was studied. It was observed that an auxiliary gas flow rate of 0.6 L min-1 produced the same robustness
values for both samples, equal to 11.9. Thus, this gas flow rate was considered appropriate and was used in further experiments.
Employing these selected parameters analyte addition and recovery experiments were carried out. The recoveries obtained were not satisfactory, suggesting that another adjustment was necessary.
The nebulization gas flow rate initially selected (0.5 L min-1) was then varied and higher values (0.60 and 0.65
L min-1) were tested, considering that it is a still robust
condition but more appropriate in minimizing possible interferences of easily ionized elements, such as Na, which is usually a macro constituent in this kind of sample.
Using these higher nebulization gas flow rates the recovery values were similar for both flow rates and were better than the ones previously obtained. An increase at about 33% in the recovery values was observed, but this was not still satisfactory, since the average values were at about 70%.
Since physical effects may occur when standards and samples have different composition the use of an internal standard (IS) was also investigated. Considering the good
results reported in literature15,20 and the ones obtained in a
previous work with the same plasma equipment,18 yttrium
was selected as a possible internal standard.
Employing 0.6 L min-1 of NFR and the selected
internal standard another analyte addition and recovery experiment was carried out. In this case the recovery values increased significantly, except for As, attaining, in general, values between 90 and 110%, which may be considered adequate.21 Yttrium showed to be adequate
for most of the analytes of concerning (Ca, Cd, Co, Cu, Fe, Mg, Mn, Ni, Pb, and Zn). These results are presented in Table 2.
Observing the data in Table 2 it is possible to conclude that the selected experimental parameters allow the determination of Ca, Cd, Co, Cu, Fe, Mg, Mn, Ni, Pb, and Zn in liquid cyclamate-saccharin sweeteners without sample digestion with good accuracy. Besides, the RSD were usually below 5%, indicating that the method also presented good precision.
In relation to As determination no analytical signals were obtained, not even in the spiked samples. This fact may be explained due to interferences from carbon
compounds that produce emissions near 193.018 nm,22
increasing the background in the spectral region of As line.
In order to evaluate this hypothesis, the samples studied were digested with nitric acid and hydrogen peroxide in a hotplate. For this purpose 1 g of sample was mixed with
10 mL of concentrated HNO3 and 8 mL of 30% (m/m)
H2O2. This mixture was heated in a hotplate at 80-100 oC
until obtaining a clear solution followed by the evaporation of residual acid. The sample was diluted to 25 mL with deionized water and analyzed by ICP OES employing instrumental conditions more adequate for aqueous
samples: plasma power of 1300 W, 0.8 L min-1 of
nebulization gas flow rate and 0.5 L min-1 of auxiliary
gas flow rate.11
Following this procedure and using yttrium as IS, no As was detected in the samples and the mean recovery values were 82 and 94% for the addition of 1.25 and 5 mg of As, respectively. Considering that the first point of addition corresponds to a concentration near its limit of quantification (see Table 4), an acceptable accuracy was obtained for As after a mineralization procedure.
Considering that stevioside sweeteners also contain the edulcorants cyclamate and saccharin, according to the manufactures´ information, the analytical method previously studied was applied to them. For this purpose the accuracy of the analysis of this kind of dietetic sweetener was also evaluated using analyte recovery experiments and the results are shown in Table 3. Figure 3. Mn signal to background ratios (SBR) for samples “Ac” and
Table 3. Concentrations, in mg L-1, and recovery values, in %, for the analytes added to samples “As” and “Bs”. Instrument conditions: plasma power:
1300 W, nebulization gas flow rate: 0.6 L min-1, auxiliary gas flow rate: 0.6 L min-1
Analyte Original concentration Recovery
Added mass* 0.10 mg 0.20 mg
Mg As: 4.50 ± 0.02 As: 110 ± 6 As: 108.0 ± 0.7
Bs: 1.30 ± 0.01 Bs: 105 ± 1.4 Bs: 107 ± 1
Ca As: 3.30 ± 0.08 As: 91.0 ± 0.2 As: 91.0 ± 0.2
Bs: 4.60 ± 0.04 Bs: 100.0 ± 0.2 Bs: 98.5 ± 0.9
Added mass * 0.002 mg 0.004 mg
Mn As: 0.0240 ± 0.0001 As: 102.0 ± 0.3 As: 102.0 ± 0.2
Bs: 0.0170 ± 0.0002 Bs: 107.5 ± 0.3 Bs: 107.0 ± 0.1
Fe As: 0.100 ± 0.007 As: 97.0 ± 0.1 As: 98.0 ± 0.5
Bs: 0.070 ± 0.003 Bs: 101.0 ± 0.3 Bs: 104.0 ± 1.6
Cu As: 0.040 ± 0.004 As: 92 ± 5 As: 95 ± 3
Bs: < 0.002 Bs: 99 ± 2 Bs: 100.0 ± 0.1
Zn As: 0.030 ± 0.002 As: 100.0 ± 0.2 As: 100.0 ± 0.7
Bs: 0.018 ± 0.001 Bs: 102.0 ± 0.3 Bs: 103 ± 3
Ni As: < 0.037 As: 99.6 ± 2.0 As: 98 ± 6
Bs: < 0.037 Bs: 103.0 ± 0.5 Bs: 103.0 ± 0.3
Co As: < 0.007 As: 96.0 ± 0.2 As: 94.0 ± 0.3
Bs: < 0.007 Bs: 105.0 ± 0.3 Bs: 104 ± 2
Pb As: < 0.007 As: 88.0 ± 0.4 As: 88 ± 0.2
Bs: < 0.007 Bs: 99 ± 1 Bs: 101 ± 1.4
Added mass * 0.001 mg 0.002 mg
Cd As: < 0.015 As: 97.5 ± 1.0 As: 99 ± 4
Bs: < 0.015 Bs: 95 ± 1 Bs: 99.0 ± 0.4
*Volume of sample solution: 5 mL.
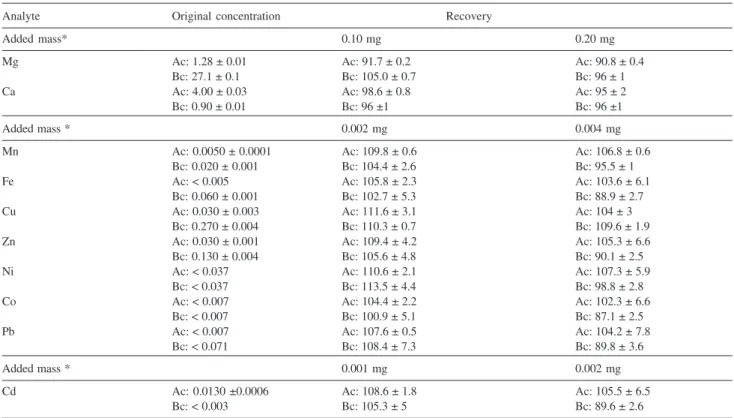
Table 2. Concentrations, in mg L-1, and recovery values, in %, for the analytes added to samples “Ac” and “Bc”. Instrument conditions: plasma power:
1300 W, nebulization gas flow rate: 0.6 L min-1, auxiliary gas flow rate: 0.6 L min-1
Analyte Original concentration Recovery
Added mass* 0.10 mg 0.20 mg
Mg Ac: 1.28 ± 0.01 Ac: 91.7 ± 0.2 Ac: 90.8 ± 0.4
Bc: 27.1 ± 0.1 Bc: 105.0 ± 0.7 Bc: 96 ± 1
Ca Ac: 4.00 ± 0.03 Ac: 98.6 ± 0.8 Ac: 95 ± 2
Bc: 0.90 ± 0.01 Bc: 96 ±1 Bc: 96 ±1
Added mass * 0.002 mg 0.004 mg
Mn Ac: 0.0050 ± 0.0001 Ac: 109.8 ± 0.6 Ac: 106.8 ± 0.6
Bc: 0.020 ± 0.001 Bc: 104.4 ± 2.6 Bc: 95.5 ± 1
Fe Ac: < 0.005 Ac: 105.8 ± 2.3 Ac: 103.6 ± 6.1
Bc: 0.060 ± 0.001 Bc: 102.7 ± 5.3 Bc: 88.9 ± 2.7
Cu Ac: 0.030 ± 0.003 Ac: 111.6 ± 3.1 Ac: 104 ± 3
Bc: 0.270 ± 0.004 Bc: 110.3 ± 0.7 Bc: 109.6 ± 1.9
Zn Ac: 0.030 ± 0.001 Ac: 109.4 ± 4.2 Ac: 105.3 ± 6.6
Bc: 0.130 ± 0.004 Bc: 105.6 ± 4.8 Bc: 90.1 ± 2.5
Ni Ac: < 0.037 Ac: 110.6 ± 2.1 Ac: 107.3 ± 5.9
Bc: < 0.037 Bc: 113.5 ± 4.4 Bc: 98.8 ± 2.8
Co Ac: < 0.007 Ac: 104.4 ± 2.2 Ac: 102.3 ± 6.6
Bc: < 0.007 Bc: 100.9 ± 5.1 Bc: 87.1 ± 2.5
Pb Ac: < 0.007 Ac: 107.6 ± 0.5 Ac: 104.2 ± 7.8
Bc: < 0.071 Bc: 108.4 ± 7.3 Bc: 89.8 ± 3.6
Added mass * 0.001 mg 0.002 mg
Cd Ac: 0.0130 ±0.0006 Ac: 108.6 ± 1.8 Ac: 105.5 ± 6.5
Bc: < 0.003 Bc: 105.3 ± 5 Bc: 89.6 ± 2.6
J. Braz. Chem. Soc.
For the stevioside sweeteners the recovery values for the majority of the analytes were also between 90 and 110%. These results were obtained in the same conditions used for the cyclamate-saccharin dietetic sweeteners, although it was necessary to use other wavelengths for Mg, Cu, and Cd, which were, respectively: 280.270, 224.700, and 228.802 nm. This suggests that matrix differences between these two types of sweeteners may affect the determinations of these species and, consequently, other wavelengths were more appropriate in this case.
For As determinations analytical problems similar to the ones previously discussed were observed. In this case the employment of an acid digestion, as a sample pretreatment, also improved the results. The mean recovery values were 88 and 101% for the addition of 1.25 and 5 mg of As, respectively and the analyte was not detected in the samples.
Figures of merit
The limits of detection (LOD) and the limits of quantification (LOQ) were calculated as described by Thomsen et al.:13 LOD= (3 × RSD × BEC) / 100; LOQ= 5 × LOD. In these expressions, RSD corresponds to the relative standard deviation, for 10 measurements of the blank, and BEC corresponds to the background equivalent concentration, which was determined experimentally using the optimized conditions. The calculated values for LOD and LOQ are presented in Table 4.
Considering the values presented in Table 4 and the maximum allowed limit of 1000 µg kg-1 of Cu in foods,
established by Brazilian legislation,23 and the values for
Cd and Pb established by Codex Alimentarius,24,25
respectively equal to 100 and 20–500 µg kg-1,it is noted
that the proposed method has adequate detectability for the determination of these contaminants in liquid sweeteners.
Analysis of stevioside and cyclamate-saccharin sweeteners
The average concentrations for the species studied in different samples are presented in Table 5, where they are expressed for a 95% confidence interval.
The results in Table 5 show that the average concentrations for the species studied are different for the two types of samples, cyclamate-saccharin and stevioside. However, Cu and Zn are in the same order of magnitude and As, Co, and Pb were not detected in any sample. It should also be mentioned that the dispersions for the average values were higher for the stevioside sweeteners, which suggest that there is not a pattern for the inorganic species distribution in this kind of sample. Taking into account the Cu and Cd concentrations, the values found are below the referred allowed limits.24,25
Conclusions
The proposed method allows the determination of Ca, Cd, Co, Cu, Fe, Mg, Mn, Ni, Pb, and Zn in liquid sweeteners (cyclamate-saccharin and stevioside) without a mineralization treatment using an axially configured ICP OES. The described method showed to be fast and friendly to the environment, by minimization of reagents consumption and time, and presented adequate detectability for the determination of inorganic
contaminants in liquid sweeteners. The analyses of
different samples allowed establishing a statistical interval for the concentration of macro (Ca, Mg) and microconstituents (Mn, Fe, Cu, Zn and Ni) in a group of Table 5. Average concentrations (µg g-1), for 95% confidence interval,
for the inorganic species in liquid sweeteners
Analyte Cyclamate-saccharine Stevioside sweeteners (n=15) Sweeteners (n= 7)
Ca 5.06 ± 0.28 3.5 ± 0.9
Mg 10.8 ± 0.6 3.7 ± 1.6
Mn 0.19 ± 0.03 0.073 ± 0.055
Fe 0.037 ± 0.001 0.18 ± 0.17
Cu 0.069 ± 0.002 0.045 ± 0.027
Zn 0.110 ± 0.004 0.103 ± 0.063
Ni 0.117 a < 0.037
Cd 0.014a < 0.015
As < 0.026 < 0.026
aAnalytes found only in one sample.
Table 4. Limits of detection (LOD) and quantification (LOQ), in µg L-1,
for the determination of inorganic species in two types of liquid sweeten-ers
Inorganic specie (λ / nm) type* LOD LOQ
Ca (II 317.933) cs, s 2.3 12
Mg (II 279.553) cs 9.4 47
Mg (II 280.270) s 0.7 3.5
Mn (II 257.610) cs, s 1.2 5.9
Fe (II 238.204) cs, s 5 25
Cu (I 327.390) cs 19 95
Cu (II 224.700) s 2.3 12
Zn (I 213.859) cs, s 4 21
Ni (II 232.000) cs, s 37 183
Co (II 228.616) cs, s 6.5 33
Pb (II 220.353) cs, s 71 350
Cd (II 214.436) cs 2.9 15
Cd (I 228.802) s 15.4 77
As (I 193.696) ** cs, s 26.3 131.4
*s= stevioside dietetic sweetener; cs = cyclamate-saccharin dietetic
many samples. According to the values obtained in this work, the mineral contents found do not represent a potential danger for human health.
Acknowledgments
The authors gratefully acknowledge Dr. Carol H. Collins for assistance with English in this manuscript, and the Fundação de Amparo à Pesquisa do Estado de São Paulo (FAPESP) and the Conselho Nacional de Desenvolvimento Científico e Tecnológico (CNPq) for financial support of this work.
References
1. Henin, N.; Int. Sugar J. 2001, 103, 346.
2. Mitchell, H.; Dedman, J.; Garman, C; Int. Sugar J. 2001, 103, 324.
3. Kretchmer, N; Hollenbeck, C. B.; Sugars and Sweeteners, CRC Press: Boca Raton, 1991.
4. Gerhartz, W.; Ullmann’s Encyclopedia of Industrial Chemistry, 5th ed., VCH: New York, 1985, vol. A4.
5. Sales, J. A.; Cardeal, Z. D.; J. Food Add. Cont. 2003, 20, 519. 6. Jost, R.; Monti, J. C.; Schauhelberger, U.; Int. J. Vitam. Nutr.
Res. 1982, 52, 229.
7. Saurina, J.; Hlabangana, L.; García-Milla, D.; Hernández-Cassou, S.; Analyst 2004, 129, 468.
8. Profirio, D. M.; Oliveira, E.; Rev. Analytica 2006, 21, 60. 9. Ahmed, M. J.; Smith, R. M.; J. Sep. Sci. 2002, 25, 170. 10. Reilly, C.; Metal Contamination of Food, Elsevier: Amsterdan,
1991.
11. Boss, C. B.; Fredeen, K. J.; Concepts, Instrumentation and Techniques in Inductively Coupled Plasma Optical Emission
Spectrometry, 2nd ed., Perkin-Elmer Corp: Norwalk, 1999.
12. Mermet, J. M.; Anal. Chim. Acta 1991, 250, 85.
13. Thomsen, V; Roberts, G.; Burgess, K.; Spectroscopy 2000,15, 33.
14. Thompson, M.; Ellison, S. L. R.; Fajgelj, A.; Willetts, P.; Wood,
R.; Pure Appl. Chem. 1999, 71, 337.
15. Brenner, I. B.; Zander, A.; Spectrochim. Acta, Part B 2000, 55, 1195.
16. Silva, J. C. J; Santos, D. M.; Cadore, S.; Baccan, N.; Nóbrega, J. A.; Microchem. J. 2004, 77, 185.
17. Brenner, I. B.; Zander, A.; Cole, M.; Wiseman, A.; J. Anal. At.
Spectrom. 1997, 12, 897.
18. Sousa, R. A.; Silva, J. C. J. S.; Baccan, N.; Cadore, S.; J. Food
Compos. Anal. 2005, 18, 399.
19. Sousa, R. A.; Baccan, N.; Cadore, S.; J. Braz. Chem. Soc. 2005,
16, 540.
20. Belchamber, R. M.; Horlick, G.; Spectrochim. Acta, Part B
1982, 17, 1037.
21. Jenniss, S. W.; Katz, A. S.; Lynch, R. W.; Applications of Atomic
Spectrometry to Regulatory Compliance Monitoring, 2nd ed.,
Wiley-VHC: New York, 1997.
22. Pan, C.; Zhu, G.; Browner, R. F.; J. Anal. At. Spectrom. 1992,
7, 1231.
23. http://e-legis.bvs.br/leisref/public/showAct.php?id =90&mode=PRINT_VERSION, accessed in May 2005. 24. http://www.codexalimentarius.net/web/stand; CAC/GL 39 –
2001, accessed in July 2005.
25. http://www. codexalimentarius.net/web/stand; CODEX STAN 210 – 2001, accessed in July 2005.
Received: May 5, 2006 Published on the web: October 3, 2006