Printed in Brazil - ©2005 Sociedade Brasileira de Química 0103 - 5053 $6.00+0.00
Article
* e-mail: [email protected]
A New Application of PC-ANN in Spectrophotometric Determination of
Acidity Constants of PAR
T. Khayamiana, Z. Kardanpoura and J. Ghasemi*,b
a
Analytical Chemistry Group, Chemistry Faculty, Isfahan University of Technology, Isfahan, Iran
b
Chmeistry Department, Science Faculty, Razi University, Kermanshah, Iran
As constantes de acidez do PAR foram determinadas por Análise de Componentes Principais em Rede Neural Artificial, usando-se dados espectrais simulados e experimentais. As equações de balanço de massa do ácido triprótico e os perfis espectrais correspondentes, gerados por um modelo Gaussiano, foram usados para simular todos os dados de absorbância-pH necessários. Um ruído constante, com média zero e diferentes desvios padrões (1-3% dos valores máximos de absorbância) foi sobreposto ao espectro simulado gerado. Um modelo experimental triangular foi usado para selecionar e determinar as diferentes constantes de acidez simuladas. Os efeitos de ruído em diferentes níveis foram também estudados para avaliar a habilidade de predição do modelo. Um conjunto completo de dados experimentais de titulação fotométrica do PAR, no intervalo de pH 1,50-13,00, foi usado como teste. As constantes de acidez obtidas concordam com os valores previamente relatados usando-se o programa DATAN.
The acidity constants of the PAR were determined by Principal Component Analysis Artificial Neural Networks, using simulated and experimental spectral data. Triprotic acid mass balance equations and corresponding spectral profiles generated by a Gaussian model were used to simulate all required absorbance-pH data. A constant noise with zero mean and different standard deviations (1-3% of the maximum absorbance values) was superimposed on the generated simulated spectra. A triangular experimental design was used to select and produce the different simulated acidity constants. The effects of white noise at different levels were also studied to check the prediction ability of the model. A fully experimental data set, photometric titration data of PAR at pH=1.50-13.00 range was used as a test set. The obtained acidity constants are in a good agreement with previously reported values using DATAN software.
Keywords: acidity constants, experimental design, Principal Component Analysis, Artificial Neural Networks, photometric titration, DATAN
Introduction
The accurate determination of acidity constant values is often required in various chemical and biochemical areas. These are of vital importance in understanding the distribution, transport behavior, binding to receptors and mechanism of action of certain pharmaceutical preparation.1,2 The acidity constants of organic reagents
play a very fundamental role in many analytical procedures such as acid-base titration, solvent extraction and complex formation reactions. But in determining of acidity constants of these molecules we are faced with several drawbacks such as low solubility in aqueous solutions and the low values of acidity constants.
Therefore, in order to enhance the acidity constants on one hand and to increase the solubility on the other, we forced to choose mixed solvents.
Spectroscopic methods are, in general, highly sensitive and are as such suitable for studying chemical equilibrium of solutions. If the components involved can be obtained in pure form, or if their spectral responses do not overlap, such analysis is, in general, trivial. For many systems, particularly those with similar components, this is not the case, and these have been difficult to analyze. Therefore to overcome this problem we have to employ the graphical and computational methods. Up to the middle of the 1960s, the evaluation of equilibrium measurements was based on the different graphical methods. These methods were reviewed in considerable details, by Rossotti and Rossoti.3
ever-greater importance in the evaluation of equilibrium measurement data using multiple wavelengths or full spectral domain for determining the stability and acidity constants. The most relevant reports are on LETAGROP-SPEFO,4 SPECFIT,5 SQUAD,6 and HYPERQUAD.7 All these
computational approaches are based on an initial proposal of a chemical equilibrium model defining species stoichiometries and based on mass-action law and mass balance equations (hard modeling methods) and also involve least squares curve fitting procedures. In contrast the soft modeling approaches are free from the restriction of the mass-action law and do not require an initial model species to be set up. Artificial Neural Network’s (ANNs) is one of the most powerful techniques of soft or model free computation. The use of soft modeling goes back to 1971, in which Lawton and Silvestre8 introduced
chemometrics-based methods for spectral analysis. A basic review of the applications of ANN was published by Gasteiger and
Zupan.9 Recently ANN has successfully been applied in
capillary zone electrophoresis,10-12 for modeling in ion
chromatography13 or in electrokinetic micellar
chroma-tography14 without necessity to know or determine
physiochemical parameters. ANN actually represents a well known soft modeling without to know or establish any mathematical model between input and output
rela-tionship.15 Here we used an ANN system to establish a
nonlinear relationship between score vectors of the absorbance- pH data matrix as input and acidity constants of a tri-protic acid as output. To our knowledge this is the first report on the application of PC-ANN in determination of acidity constants using pH- absorbance titration data.
Theory
Multivariate spectrophotometric data were generated
based o Beer-Lambert’s law. A matrix C was calculated
based on the chemical reactions model and the appropriate formation constants (equilibrium constants). The columns
of C are formed by the concentration profiles of the
absorbing species of the chemical equilibrium system. The
rows of the matrix A contain the respective absorption
spectra of components involved in chemical equilibrium model. According to Beer-Lambert’s law, the matrix product C × A results in a matrix Y of the individual absorbance readings at all wavelengths and each pH step. An error term with zero mean and different standard deviation in the range 1-3% of the maximum absorbance values, were generated by Gaussian random generator of MATLAB software represented by matrix R is added:16-18
Y= CA +R (1)
A Principal component analysis (PCA) was used to convert each spectral data to a simple and more usable and compact one. It is note worthy to mention that principal component analysis has been widely applied in data mining to investigate data structure. In PCA, new orthogonal variables (latent variables or principal components) are obtained by maximizing variance of the data. The number of the latent variables (factors) is much lower than the number of original variables, so that the data can be visualized in a low-dimensional PC’s (a space span by principal components) space. While PCA greatly reduces the dimensionality of the space, it does remain the initial information in new space as mush as possible. PCA technique has a special application for all spectro-photometric studies which divided the spectral information into two different orthogonal matrices, score and loading, while score values have the most relevant information to the concentration matrix, instead loading matrices have the most related data to the pure spectral profiles matrix. In this study PCA used for data compression and also for extract the score matrix as the input for the ANN model.
The theoretical aspects of the artificial neural networks are described in several papers.19,20 The development of
the artificial neural network (ANN) has provided a powerful tool for non-linear approximations. A multi-layered ANN with enough neurons can approximate almost any non-linear input-output mapping at any required accuracy. An artificial neural network (ANN) is a mathematical structure designed to mimic the information processing functions of a network of neurons in the brain.21, 22 ANNs are highly
parallel systems that process information through many interconnected units that respond to inputs through modifiable weights, thresholds, and mathematical transfer functions. Each unit processes the pattern of activity it receives from other units, and then broadcasts its response to still other units. ANNs are particularly well suited for problems in which large datasets contain complicated nonlinear relations among many different inputs. ANNs are able to find and identify complex patterns in datasets that may not be well described by a set of known processes or simple mathematical formulae.23-26 The neural network
used in this work is back propagation (BNN) type. A typical back propagation neural network has three layers: the input, the hidden, and the output layers. The activation of a neuron is defined as the sum of the weighted input signals to that neuron:
(2)
bias of neuron j. The uj of the weighted inputs is transformed with a transfer function, which is used to get to the output level. Several functions can be used for this
purpose, but the “sigmoid function” is mostly applied.27
This function is as follows:
(3)
where yj is output of the neuron j. The BP network learns by adjusting its weights according to the error (E), equation 4. The goal of training of a network is to change the weights between the layers in a direction that minimizes the error,
E:
(4)
The error E of a network is defined as the squared
differences between the target values t and the outputs y of the output neurons summed over p training patterns and k
output nodes.
After obtain the error all weights have to correct in turn with back propagation derivative equations, and repeat these two steps to access to an acceptable value for error. In back propagation step, learning rate and momentum must be apply, learning rate for adjusting the variation rate in model and momentum for using the effect of last iteration value of the weights in the next correction. To construct an ANN model three set of data must be apply, calibration set for training the random weights of the network, prediction set to distinguish the optimum values of parameters and the architecture of the network and the test set to evaluate the model efficiency.
Experimental
Data set
In order to establish the model, three different data sets have been used: calibration set, prediction set and the test set. The calibration and prediction sets were generated by using mass balance equations, a simulated Gaussian curves and proper estimates of all protolytic constants from a experimental design strategy, while the applied test set was a real experimental data set which previously published.28-30
Simulated data
In order to have some simulated data which are similar to data of real experiments, we tried to design some triprotic acids with three different sets of pKa‘s (pKa1, pKa2, pKa3) at a reasonable intervals. A triangular experimental design was
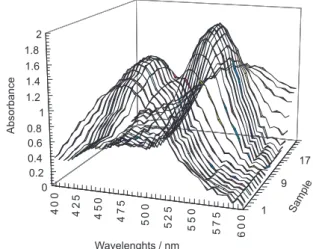
applied to construct data set. For these virtual triprotic acids some spectral information must be approximated, each spectrum structured with a combined Gaussian distribution using the chemical behavior of the desired species in the solutions. In each spectrum we added a random noise to the absorbance values to have as much the relatively real spectra as possible. Figure 1 shows a sample of simulated spectra for prediction set. For all numerical experiments, the spectra were simulated using Gaussian functions in the wavelength range 380-600 nm in 5 nm intervals; the means were 450, 480, 500 and 520 nm and widths 25, 28, 31 and 41 nm and the maximal molar absorbencies were set on 1.2, 1.5, 1.4 and 2.0 mol-1 cm-1
for four chemical species from a triprotic acid respectively. To the simulated data a 1-3% constant noise were added with zero mean and 0.01-0.03 standard deviations.
Experimental data
The applied test set was a real experimental data set which previously published.28-30 This real data sets are
visible spectra of the 4-(2-pyridylazo) resorcinol (PAR) in different composition of methanol-water at designed pH intervals.
Model constructing
In this part an ANN model was proposed to train a network for predicting the pKa values using spectral information’s as input data for each sample. Each sample is related to a matrix with size equal to the number of pH values as the rows and the wavelength values as the columns. A principal component analysis used to compression the resulting matrix to more compact score and loading matrices. The summation of first four PC’s was used as input vector for each sample. Of course several combination of scores were used and it was found that the summation of first four principal components (scores)
gave the best calibration model. The values of pKa1, pKa2 and
pKa3 are structured as the output nodes. The PCA-ANN
program was written in MATLAB 6.1 (Mathworks) in our laboratory, and back propagation strategy was used for training of the network. The parameters of the model were optimized using prediction set, finally a 12-8-3 model obtained. The real test set was used to predict the real data and evaluate the model for experimental conditions.
Results and Discussion
The main aim of this work was to define and establish a theoretical model to predict some physicochemical properties of interested molecules form experimental data without any knowledge of the under study system.
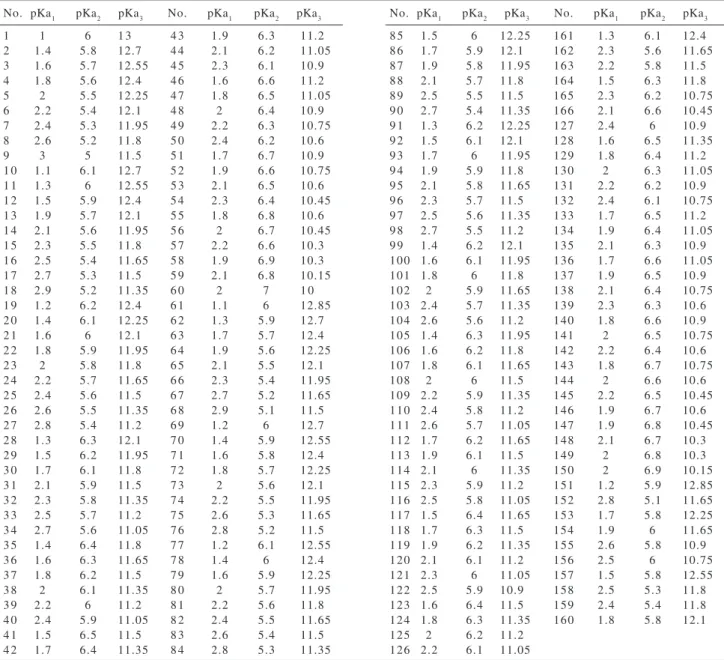
All simulations used in this study were based on theoretical knowledge and analytical relationships. A triangular design was applied to create different artificial acidity constants. In this design a triangle shape used, while one of each pKa1, pKa2 and pKa3, had been scaled on the one of its gone. That is, pKa1 varies from 1 to 3 while pKa2 and pKa3 were changed between 5-7 and 10-13 respectively on each gone of the triangular shape. Figure 2 shows all of the designed acids with their pKa’s on the related triangle. The pKa values of all designed acids are listed in Table 1. Some of these acids randomly selected for prediction set. The concentrations of the components of each acid were obtained from mass-balance relations, corresponding simulated pH values and spectral profiles. Absorbance data matrix obtained by multiplication of concentration matrix
Table 1. The simulated acidity constants for assumed triprotic acids for training and predictions sets
No. pKa1 pKa2 pKa3 No. pKa1 pKa2 pKa3
1 1 6 1 3 4 3 1.9 6.3 11.2
2 1.4 5.8 12.7 4 4 2.1 6.2 11.05
3 1.6 5.7 12.55 4 5 2.3 6.1 10.9
4 1.8 5.6 12.4 4 6 1.6 6.6 11.2
5 2 5.5 12.25 4 7 1.8 6.5 11.05
6 2.2 5.4 12.1 4 8 2 6.4 10.9
7 2.4 5.3 11.95 4 9 2.2 6.3 10.75
8 2.6 5.2 11.8 5 0 2.4 6.2 10.6
9 3 5 11.5 5 1 1.7 6.7 10.9
1 0 1.1 6.1 12.7 5 2 1.9 6.6 10.75
1 1 1.3 6 12.55 5 3 2.1 6.5 10.6
1 2 1.5 5.9 12.4 5 4 2.3 6.4 10.45
1 3 1.9 5.7 12.1 5 5 1.8 6.8 10.6
1 4 2.1 5.6 11.95 5 6 2 6.7 10.45
1 5 2.3 5.5 11.8 5 7 2.2 6.6 10.3
1 6 2.5 5.4 11.65 5 8 1.9 6.9 10.3
1 7 2.7 5.3 11.5 5 9 2.1 6.8 10.15
1 8 2.9 5.2 11.35 6 0 2 7 1 0
1 9 1.2 6.2 12.4 6 1 1.1 6 12.85
2 0 1.4 6.1 12.25 6 2 1.3 5.9 12.7
2 1 1.6 6 12.1 6 3 1.7 5.7 12.4
2 2 1.8 5.9 11.95 6 4 1.9 5.6 12.25
2 3 2 5.8 11.8 6 5 2.1 5.5 12.1
2 4 2.2 5.7 11.65 6 6 2.3 5.4 11.95
2 5 2.4 5.6 11.5 6 7 2.7 5.2 11.65
2 6 2.6 5.5 11.35 6 8 2.9 5.1 11.5
2 7 2.8 5.4 11.2 6 9 1.2 6 12.7
2 8 1.3 6.3 12.1 7 0 1.4 5.9 12.55
2 9 1.5 6.2 11.95 7 1 1.6 5.8 12.4
3 0 1.7 6.1 11.8 7 2 1.8 5.7 12.25
3 1 2.1 5.9 11.5 7 3 2 5.6 12.1
3 2 2.3 5.8 11.35 7 4 2.2 5.5 11.95
3 3 2.5 5.7 11.2 7 5 2.6 5.3 11.65
3 4 2.7 5.6 11.05 7 6 2.8 5.2 11.5
3 5 1.4 6.4 11.8 7 7 1.2 6.1 12.55
3 6 1.6 6.3 11.65 7 8 1.4 6 12.4
3 7 1.8 6.2 11.5 7 9 1.6 5.9 12.25
3 8 2 6.1 11.35 8 0 2 5.7 11.95
3 9 2.2 6 11.2 8 1 2.2 5.6 11.8
4 0 2.4 5.9 11.05 8 2 2.4 5.5 11.65
4 1 1.5 6.5 11.5 8 3 2.6 5.4 11.5
4 2 1.7 6.4 11.35 8 4 2.8 5.3 11.35
No. pKa1 pKa2 pKa3 No. pKa1 pKa2 pKa3
8 5 1.5 6 12.25 161 1.3 6.1 12.4
8 6 1.7 5.9 12.1 162 2.3 5.6 11.65
8 7 1.9 5.8 11.95 163 2.2 5.8 11.5
8 8 2.1 5.7 11.8 164 1.5 6.3 11.8
8 9 2.5 5.5 11.5 165 2.3 6.2 10.75
9 0 2.7 5.4 11.35 166 2.1 6.6 10.45
9 1 1.3 6.2 12.25 127 2.4 6 10.9
9 2 1.5 6.1 12.1 128 1.6 6.5 11.35
9 3 1.7 6 11.95 129 1.8 6.4 11.2
9 4 1.9 5.9 11.8 130 2 6.3 11.05
9 5 2.1 5.8 11.65 131 2.2 6.2 10.9
9 6 2.3 5.7 11.5 132 2.4 6.1 10.75
9 7 2.5 5.6 11.35 133 1.7 6.5 11.2
9 8 2.7 5.5 11.2 134 1.9 6.4 11.05
9 9 1.4 6.2 12.1 135 2.1 6.3 10.9
100 1.6 6.1 11.95 136 1.7 6.6 11.05
101 1.8 6 11.8 137 1.9 6.5 10.9
102 2 5.9 11.65 138 2.1 6.4 10.75
103 2.4 5.7 11.35 139 2.3 6.3 10.6
104 2.6 5.6 11.2 140 1.8 6.6 10.9
105 1.4 6.3 11.95 141 2 6.5 10.75
106 1.6 6.2 11.8 142 2.2 6.4 10.6
107 1.8 6.1 11.65 143 1.8 6.7 10.75
108 2 6 11.5 144 2 6.6 10.6
109 2.2 5.9 11.35 145 2.2 6.5 10.45
110 2.4 5.8 11.2 146 1.9 6.7 10.6
111 2.6 5.7 11.05 147 1.9 6.8 10.45
112 1.7 6.2 11.65 148 2.1 6.7 10.3
113 1.9 6.1 11.5 149 2 6.8 10.3
114 2.1 6 11.35 150 2 6.9 10.15
115 2.3 5.9 11.2 151 1.2 5.9 12.85
116 2.5 5.8 11.05 152 2.8 5.1 11.65
117 1.5 6.4 11.65 153 1.7 5.8 12.25
118 1.7 6.3 11.5 154 1.9 6 11.65
119 1.9 6.2 11.35 155 2.6 5.8 10.9
120 2.1 6.1 11.2 156 2.5 6 10.75
121 2.3 6 11.05 157 1.5 5.8 12.55
122 2.5 5.9 10.9 158 2.5 5.3 11.8
123 1.6 6.4 11.5 159 2.4 5.4 11.8
124 1.8 6.3 11.35 160 1.8 5.8 12.1
125 2 6.2 11.2
by pure spectral profiles for all components. The pH values were varied in the range 1.5 to 13.0 with a step 0.5. The resulting data matrix is considered as inputs for PC-ANN model. To reduce the dimension of the input matrix, PCA technique was applied. PCA decompose data set to corresponding score and loading matrices, then scores were used as input data, because of their ability to cover all information about the concentration profiles, also the uncertainty in the simulation of spectral profile was neglected as a consequence. By using triprotic acids in different pH values as samples, there are four components present in each sample, therefore four principal components (PC) were selected for different pH values. Summation of these PC‘s at each pH value was used for each acid as input nodes for the ANN model. The ANN model has a good ability to relate the scores to the concentrations or to the pKa‘s because of high performance of ANN to predict the nonlinear and complex effects. The model was optimized by prediction set, the momentum and learning rate values are 0.1 and 0.9 respectively and 8 nodes were applied in hidden layer.
The mean square errors (MSEs) for the training and prediction sets were plotted against the number of iterations (Figure 3), finally at the iteration number of 9500 the ANN
Table 2. Real and predicted pKa values of the PAR using the con-structed optimized model
Sample pKa1 pKa2 pKa3 pKa1 pKa2 pKa3 (real) (real) (real) (predicted) (predicted) (predicted)
1 2.45 6.82 12.77 2.30 6.88 12.75
2 2.50 6.69 12.68 2.33 6.65 12.64
3 2.57 6.52 12.57 2.41 6.50 12.52
4 2.65 6.35 12.45 2.49 6.44 12.44
5 2.72 6.28 12.40 2.56 6.34 12.38
6 2.80 6.11 12.37 2.68 6.19 12.32
7 2.88 5.97 12.22 2.74 5.96 12.20
8 2.90 5.86 12.21 2.78 5.85 12.18
9 3.01 5.80 12.11 2.97 5.74 12.13
Figure 2. Triangular experimental design.
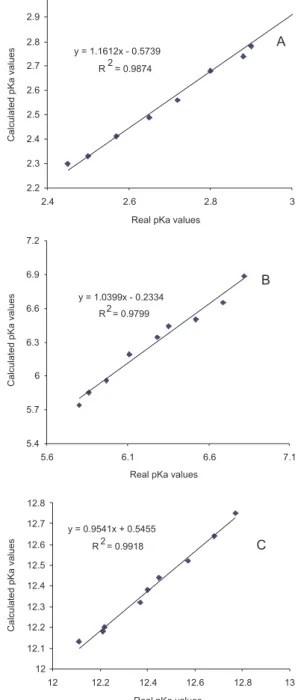
Figure 4. The calculated pKa values vs real pKa values (obtained by DATAN software). A: pKa1; B: pKa2; C: pKa3.
model was trained. The model response has compared with the pKa‘s obtained from DATAN software.31 Table 2, shows
that the predicted pKa‘s were in the good agreement with values obtained from DATAN software for different samples. The ANN predicted pKa‘s were plotted against
the pKa‘s obtained from DATAN in Figure 4. The good R2
values, 0.9874, 0.9799, 0.9918, for pKa1, pKa2, pKa3 respectively, explain the superior ability of the model to predict these acidity constants.
Conclusions
The good ability of ANN may applied to build models based on theoretical information and used to predict experimental values, prevent any trial and error experiments, which save time and cost. This method proved the prediction of acidity constants of different kind of acids. Also this kind of modeling can be used to predict any other properties for all kind of molecules. This is the first step of using chemical information to build a model for special purpose.
Acknowledgments
This work was supported by Isfahan University of Technology and Center of Excellency in Chemistry of Isfahan University of Technology.
References
1. Almasifar, D.; Forghaniha, A.; Khojasteh, Z.; Ghasemi, J.; Shargi, H.; Shamsipur, M.; J. Chem. Eng. Data1997, 42, 1212.
2. Shamsipur, M.; Ghasemi, J.; Tamaddon, F.; Sharghi, H.; Talanta
1992, 40, 697.
3. Rossotti, F. J. C.; Rossotti, H. S.; The Determination of Stability
Constants, McGraw-Hill: New York, 1961.
4. Sillen, L. G.; Warnqvist, B.; Ark. Kemi1968, 31, 377. 5. Gampp, H.; Maeder, M.; Mayer, C. J.; Zuberbuhler, A.; Talanta
1985, 32, 95.
6. Legget, D. J. In Computational Methods for the Determination
of Formation Constants; Legget, D. J.; ed., Plenum Press: New
York, 1985, p. 159.
7. Gans, P.; Sabbatini, A.; Vacca, A.; Talanta1996, 43, 1739. 8. Lawton, W.; Sylvestre, E.; Technometrics1971, 13, 617.
9. Gasteiger, J.; Zupan, J.; Angew. Chem. 1993, 32, 503. 10. Havel, J.; Pena- Mendez, E. M.; Rojas-Hernandez, A.; Doucet,
J.P.; Panaye, A.; J. Chromatogr.1998, 793, 317.
11. Frakova, M.; Pena- Mendez, E. M.; Havel, J.; J. Chromatogr. A. 1999, 848, 365.
12. Dohnal, V.; Farkova, M.; Havel, J.; Chirality1999, 11, 616. 13. Havel, J.; Madden, J. E.; Haddad, P. R.; Chromatographia
1999, 49, 481.
14. Havel, J.; Breadmore, M.; Macka, M.; Haddad, P. R.; J.
Chromarogr. A. 1999, 850, 345.
15. Havel, J.; Lubel, P.; Farkova, M.; Polyhedron2002, 21, 1375. 16. Fisher, R.; Mackenzie, W.; J. Agric. Sci.1993, 13, 311. 17. Wold, H. In Research Papers in Statistics; Daved, F., ed.; Wiley:
New York, 1996, p.441.
18. Mardia, K. V.; Kent, J. T.; Bibby, J. M.; Multivariate Analysis, Academic Press: London,1979.
19. Zupan, J.; Gasteiger, J.; Neural Networks for Chemist: An
Introduction, VCH: Weinhcim, 1993.
20. Hahau, M. T.; Demuth, H. B.; Beal, M.; Neural Network Design, PWS: Boston,1996.
21. Hinton, G. E.; Sci. American1992, 267, 144.
22. Jensen, B.A; Expert Systems - Neural Networks, Instrument
Engineers’ Handbook, 3rd ed., Radnor: Pennsylvania, 1994.
23. Chen D. S.; Ramesh C. J.; IEEE Trans. Neural Networks
1994, 5.
24. Li, S. T.; Leiss, E.; Radial Basis Function Neural Networks:
Recent Developments in Theory and Applications, Howlett, R.
J.; Jain, L.C., eds.; Springer Verlag: Heidelberg, 2001, pp. 124.
25. Hwang, J. N.; IEEE Trans. Signal Processing1994, 42, 2795. 26. Shashidhara, H. L.; Lohani, S.; Gadre, V. M.; Proceedings of
IEEE International Conference on Industrial Technology,
2000, vol. 2, pp. 335, 2000.
27. Cybenko, G., Signals and Systems, 1989, vol. 2, p. 303. 28. Ghasemi, J.; Niazi, A.; Kubista, M.; Elbergali, A.; Anal. Chim.
Acta 2002, 455, 335.
29. Ghasemi, J.; Kubista, M.; Forootan, A.; Ahmadi, Sh.; J. Chem.
Eng. Data2003, 48, 6.
30. Rouhollahi, A.; Kiaee, F. M.; Ghasemi, J.; Talanta2005,66, 653.
31. http://www.multid.se/DATAN