Printed in Brazil - ©2005 Sociedade Brasileira de Química 0103 - 5053 $6.00+0.00
Article
* e-mail: [email protected]
# Present Address: Instituto de Química, Universidade Federal de Uberlândia - MG, Brazil
§ Present Address: Instituto de Qúimica, Universidade Estadual de Campinas - SP, Brazil
Determination of Anions, Cations, and Sugars in Coconut Water
by Capillary Electrophoresis
Eduardo M. Richter#, Dosil P. de Jesus§, Rodrigo A. A. Muñoz, Claudimir L. do Lago
and Lúcio Angnes*
Instituto de Química, Universidade de São Paulo, Av. Prof. Lineu Prestes, 748, 05508-900 São Paulo- SP, Brazil
Este trabalho apresenta a determinação de diversos analitos em água de coco por eletroforese capilar com detecção condutométrica sem contato (CCD). Foram analisadas 5 diferentes amostras: duas não processadas (naturais) e três industrialmente processadas (comerciais). As amostras foram injetadas sem tratamento prévio e apenas uma simples diluição foi necessária. A técnica foi aplicada para quantificação de 12 analitos: cloreto, sulfato, fosfato, malato, ascorbato, potássio, sódio, cálcio, magnésio, frutose, glicose e sacarose, sendo que seus respectivos limites de detecção (LOD) são: 0,09; 0,12; 0,50; 0,97; 1,2; 0,05; 0,17; 0,12; 0,08; 5,4; 7,4 e 8,9 mg L-1. Para realizar estas análises, foram utilizados quatro tampões de corrida
diferentes.
This work presents the determination of several analytes in coconut water by using capillary electrophoresis with contactless conductivity detection (CCD). It was analyzed 5 different samples: two unprocessed (natural) coconut water and three processed (commercial) ones. The samples were injected without pretreatment and only a simple dilution was necessary. The technique was applied to quantify 12 analytes: chloride, sulfate, phosphate, malate, ascorbate, potassium, sodium, calcium, magnesium, fructose, glucose, and sucrose with limit of detection (LOD) of 0.09, 0.12, 0.50, 0.97, 1.2, 0.05, 0.17, 0.12, 0.08, 5.4, 7.4, and 8.9 mg L-1, respectively.
These analysis were done utilizing four different running buffers.
Keywords: coconut water, capillary electrophoresis, contactless conductivity detection.
Introduction
Coconut water is largely consumed as a refreshing drink in Brazil due to the abundance of the fruit, mainly in the northeast region of the country. From coconut fruit, it is possible to obtain some commercial products such as coconut milk, coconut water, and grated coconut, which are used in the preparation of other food products.1,2 Coconut water starts to be produced into the fruit after one month and a half. The best time to collect the fruit is at the sixth month of growing, when the maximum volume of water is reached, corresponding to ~25% of the fruit weight. In this phase, the coconut water is tastier and rich in nutrients, presenting low fat levels, and for this reason, it is considered an excellent isotonic drink.3
In the literature, it is possible to find some research about the nutritional composition of coconuts. Santoso et al.4 described information on vitamins, sugar, organic acids, fatty acids, amino acids, fibers, and minerals in coconut (Cocus nucifera L.). Aleixo et al.5 determined selenium in coconut water and coconut milk using graphite furnace atomic absorption spectrometry. The main advantage of the proposed method is the possibility of direct analysis of both samples, without any sample preparation. Dey et al.6 discovered the two principal phenolic compounds (4-hydroxybenzoic acid and ferulic acid) accumulated in the mesocarpic husk material of coconut. This coconut material is one of the major agro-industrial waste material generated by the developing countries each year, and can be used by the rope-making industry. Another characteristic of this fruit is its antioxidant capacity.7,8
matrix. Changes in the chemical composition of coconut water were studied.10 Traces and minor element contents were determined in green coconut water for application as intravenous hydration fluid, to replace the expensive parenteral nutrition solutions11 in undeveloped regions. Coconut water was evaluated as rehydration fluid in diarrhea. Oral rehydration has been recommended to replace the fluid loss from gastrointestinal tract. The final conclusion of this work indicated that the ingestion of fresh coconut water from young fruit could be recommended for this purpose.12
Pesticide residues were determined in coconut water by liquid-liquid extraction and gas chromatography.13 Separation and determination of cytokinins in the same sample was described using micellar electrokinetic capillary chromatography.14
Capillary electrophoresis (CE) is a powerful technique, which provides high-resolution efficiency for separation and quantification of organic and inorganic ions. The purpose of this work is the determination of cations, anions, and sugars in coconut water by using a capillary electrophoresis with contactless conductivity detector (CE-CCD). The CE-CCD developed in our laboratory15,16 has been applied for the determination of cations and anions in rain water,17 human serum,18 and ethanol fuel,19 as well as sugars in beverages.20
Experimental
Reagents
The reagents were of analytical grade and were purchased from Merck (Darmstadt, Germany) or Sigma (St. Louis, MO, USA) and used as received. All solutions were prepared with Nanopure (Barnstead, Dubuque, IA, USA) deionized water. Standard solutions were prepared by dilution of individual stock solutions of sodium chloride, potassium chloride, sodium nitrate, sodium sulfate, calcium chloride, magnesium chloride, lithium hydroxide, sodium dihydrogen phosphate monohydrate, tartaric acid, malic acid, citric acid, ascorbic acid, benzoic acid, fructose, glucose, sucrose, and galactose. Two running buffers were utilized for anions analysis. For chloride, sulfate, and malate quantification, the
running buffer was 20 mmol L-1
2-[N-morpholino]-ethanosulfonic acid (MES), 20 mmol L-1 L-histidine (His), and 0.2 mmol L-1 N-cetyl-N-N-N-trimethyl-ammonium hydroxide (CTAH),19 pH 6.0. For phosphate and ascorbate analysis, the running buffer which provides the best separation was 30 mmol L-1 lactic acid, 10 mmol L-1 His, and 0.3 mmol L-1 CTAH (pH 3.7). For cations analysis,
the best running buffer found was 20 mmol L-1 lactic acid/ histidine (Lac/His) and 2.5 mmol L-1 18-crown-6-ether (pH 4.9).18 For sugar analysis, the running buffer was 10 mmol L-1 NaOH, 4.5 mmol L-1 Na
2HPO4, and 0.2 mmol L-1 CTAH (pH 11.5).20
Equipment
A home made capillary electrophoresis equipment with CCD was used for the analysis.15, 16 A microcomputer controls the instrumental parameters and the signals acquisition. The detector was placed at 9 cm from the end of the capillary. A fused-silica capillary (Agilent Technologies, São Paulo, Brazil) with 50 cm length was used for the analysis. For anions and cations analysis, the inner diameter of the capillary was 75 µm and for sugars
analysis, 50 µm. The applied voltages were 28, +25, and
-15 kV for anions, cations and sugars determinations, respectively.
Samples
Five different coconut water samples were analyzed by the proposed CE methodology. Three were purchased from supermarket (processed water) and two samples were obtained directly from a fruit (unprocessed water). The samples were only diluted with deionized water as required before analysis. Different dilutions were used for anions and cations determination: chloride and malate (50 times), potassium (20 times), sulfate, calcium and magnesium (10 times), phosphate and ascorbate (5 times), sodium (2 times). For sugar analyses, one sample was diluted 25 times and the other ones 100 times.
Results and Discussion
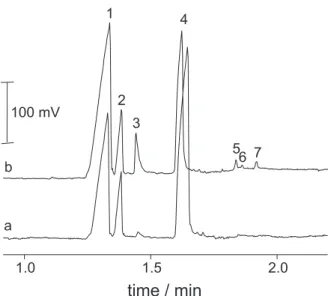
Identification of the compounds was performed using spiking techniques. For anions separation, two running buffers were used. Figure 1 shows the electropherogram of unprocessed (a) and processed (b) coconut water sample by using MES/His/CTAH running buffer. The peaks for chloride (1), sulfate (3), malate (4), phosphate (5), benzoate (6), and ascorbate (7) could be identified. Nitrate (2) was used as internal standard.
Figure 2 shows the electropherogram of unprocessed (a) and processed (b) coconut water sample by using Lac/ His running buffer. The peaks for chloride (1), sulfate (2), phosphate (3), malate and citrate (5), ascorbate (6), and benzoate (7) could be identified. Tartrate (4) was used as internal standard.
electrolytes, which is in high concentration in the samples. Thus, its determination can be easily done in both mediums. In the present study, the peak at the MES/His electropherogram was used. Ascorbate can also be quantified using both buffers. However, Lac/His was chosen because the higher sensitivity attained for this anion.
An interaction between CTAH and sulfate was observed, which yielded a distorted peak and low
sensitivity. The amount of CTAH required to obtain stable and reproducible experiments was lower in the MES/His. Thus, sulfate was quantified using this electrolyte.
In Lac/His buffer, malate and citrate co-migrate. Thus, MES/His was used to quantify malate, because no peak was observed for citrate in this buffer. There was also co-migration for benzoate and phosphate at MES/His. Such a problem did not occur using Lac/His, which allowed the quantification of phosphate. However, in this case, benzoate presented low mobility and its peak was frequently superposed to the EOF one. Thus, although sometimes it was possible to identify its presence in the sample, benzoate was not quantified.
The use of the running buffer 20 mmol L-1 Lac/His was successful for the cations separation. The crown-ether delays the K+ peak, otherwise superimposed to the NH4+ peak. The concentration of NH
4
+ was below
the limit of detection in all analyzed samples. Potassium was the major cation in coconut water and, for this reason, different sample dilutions were employed for its determination. Figure 3 presents two electropherograms that shows the difference between processed and unprocessed coconut water samples. The peaks for potassium (1), sodium (2), calcium (3), and magnesium (4) were also identified. Lithium (5) was used as an internal standard (17.5 mg L-1).
Figure 4 shows electropherograms for separation of fructose, glucose, and sucrose in unprocessed and processed coconut water samples. Galactose was used Figure 3. Separation of cations: Electropherogram of an unpro-cessed coconut water sample (a) and of a processed coconut water sample (b). Running buffer: 20 mmol L-1 Lac/His and 2.5 mmol L-1 18-crown-6-ether. Separation voltage +25 kV; gravity injection at 90 mm for 10 s; silica capillary with 75 µm inner diameter and 50 cm long
was used. Peaks: (1) potassium, (2) sodium, (3) calcium, (4) magnesium, and (5) lithium as internal standard (17.5 mg L-1).
Figure 1. Separation of anions: Electropherograms of an unprocessed coco-nut water sample (a) and of a processed cocococo-nut water sample (b). Running buffer: 20 mmol L-1 MES/His and 0.2 mmol L-1 CTAH, pH 6.0. Separation voltage -28 kV; gravity injection at 90 mm for 20 s; silica capillary with 75 μm inner diameter and 50 cm long was used. Peaks: (1) chloride, (2) nitrate as internal standard (10 mg L-1), (3) sulfate, (4) malate, (5) phosphate, (6) benzoate and (7) ascorbate.
as internal standard because this carbohydrate was not present in the samples. In conductivity detection of sugars, the corresponding peaks are negative owing to the low mobility of these dissociated carbohydrates and the high mobility of the co-ion (hydroxyl) in the running buffer. This kind of detection simplified the sugar analysis, because only a dilution of the sample is required. Other methods require permanent chemical modification and normally this step involves a very cumbersome work.
Table 1 contains the migration times of all analytes in standard solutions and diluted samples. The relative standard deviations (n = 4) are below 2%, which indicates excellent repeatability of the signals in all running buffers. Table 2 shows addition/recovery studies for all analytes. The RSD of the recoveries were calculated for four different samples (two unprocessed and two processed samples). For the recovery studies, the concentrations of the added analytes were similar the Figure 4. Electropherograms for separation of fructose (1), glucose (2), and sucrose (4) from unprocessed (a) and processed (b) coconut water. Galactose (3) was used as an internal standard. Running buffer: 10 mmol L-1 NaOH, 4.5 mmol L-1 Na
2HPO4, and 0.2 mmol L
-1 CTAH. Separation voltage –15kV; gravity injection at 100 mm for 10s; silica capilallary with 50 μm inner diameter and 50 cm long was used.
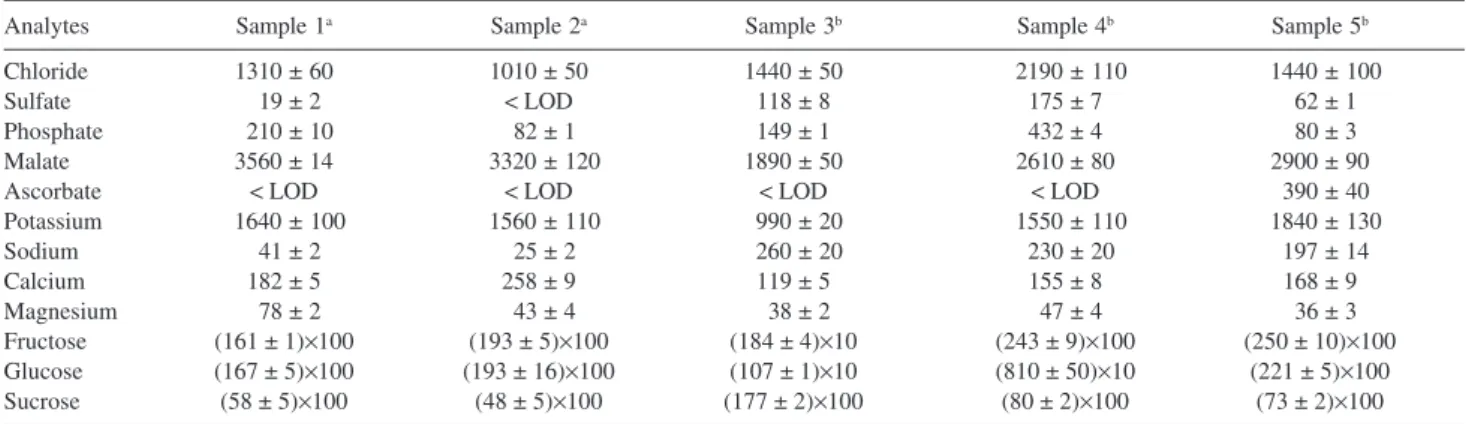
original concentrations present in coconut water. Table 3 presents the concentrations of the analytes in five coconut water samples. In natural (unprocessed) coconut water, chloride, malate, and potassium are the major ions. Sulfate and sodium was found at much higher concentration in all processed coconut waters, due to the sodium bisulfite addition as a preserving additive whose oxidation is a source of sulfate. Citrate, ascorbate, and benzoate were found only in one sample of processed coconut waters, due to addition of citric and benzoic acids as preserving additives and ascorbic acid as antioxidant as stated by the manufacturer. For sugar analysis of the unprocessed samples (1 and 2), fructose and glucose concentrations are close and they are the major carbohydrates. According to Santoso et al.,4 this fact was expected for coconut water extracted from a young fruit. In contrast, for the sample 3, sucrose is the chief sugar and the concentration of the others carbohydrates are smaller than in the remaining samples. This is probably due to the water is originate from a mature fruit. The sample 5 (processed water) presents sugar concentration profile similar that for water obtained from a young fruit. The other processed water (sample 4) presents fructose concentration much larger than glucose concentration, which is not common in coconut water. The manufacturer states that fructose is added for standardizing the taste.
Table 4 shows the analytical characteristics of the proposed methods. The detection limit and the peak resolution are suitable for the quantification of these analytes in coconut water samples.
Table 2. Recovery results for the quantified ions in coconut water (n = 4a)
Analytes Recovery (%) Analytes Recovery (%)
Chloride 097 ± 5 Sodium 107 ± 4
Sulfate 106 ± 4 Calcium 102 ± 6
Phosphate 108 ± 7 Magnesium 105 ± 4
Malate 100 ± 6 Fructose 094 ± 7
Ascorbate 102 ± 7 Glucose 0090 ± 10
Potassium 096 ± 3 Sucrose 091 ± 4
a Two unprocessed and two processed coconut water samples were evalu-ated.
Table 1. Migration times for the ions in standard solutions and coconut water samples (n = 4)
Analytes Standards (min) Samples (min) Analytes Standards (min) Samples (min)
Chloride 0.85 ± 0.01 0.87 ± 0.01 Sodium 1.98 ± 0.07 1.96 ± 0.01
Nitrate 0.89 ± 0.01 0.91 ± 0.01 Calcium 2.07 ± 0.09 2.04 ± 0.01
Sulfate 0.95 ± 0.02 0.99 ± 0.02 Magnesium 2.18 ± 0.09 2.13 ± 0.02
Malate 1.03 ± 0.03 1.07 ± 0.02 Lithium 2.35 ± 0.10 2.33 ± 0.01
Phosphate 1.45 ± 0.02 1.46 ± 0.02 Fructose 6.72 ± 0.02 6.72 ± 0.02
Tartrate 1.61 ± 0.03 1.63 ± 0.03 Glucose 7.13 ± 0.01 7.16 ± 0.03
Ascorbate 2.14 ± 0.04 2.21 ± 0.04 Galactose 7.35 ± 0.01 7.38 ± 0.03
Conclusions
Capillary electrophoresis with CCD was found to be very suitable for the determination of inorganic ions and carbohydrates in coconut water. The main advantages of the proposed methods are the low cost, the simplicity of the sample preparation (only a dilution), and the great number of analytes that can be quantified. The results demonstrated that is possible to distinguish an unprocessed from processed coconut water. By the sugar analysis, one can found if coconut water is originated from a young or mature fruit. This is an important information to maintain the taste uniformity of industrialized coconut water. Quantification of sulfate is another important contribution of this study, once provides a simple and efficient way to indicate the addition of sulfite to canned coconut water.
Acknowledgments
The authors gratefully acknowledge financial support from Brazilian foundations (FAPESP, CAPES and CNPq). Table 4. Analytical characteristics of the proposed method
Analytes LODa (mg L-1) LODa (mol L-1) LOQb (mg L-1) LOQb (mol L-1) Mobilities (10-8 m2 V-1 s-1) Rc
Chloride 0.09 2.5 x 10⁻⁶ 0.30 8.3 x 10⁻⁶ 14.3
-Sulfate 0.12 1.25 x 10⁻⁶ 0.340 4.1 x 10⁻⁶ 12.5 2.1
Phosphate 0.50 5.26 x 10⁻⁶ 1.65 1.7 x 10⁻⁵ 7.73 17
Malate 0.97 7.2 x 10⁻⁶ 3.20 2.4 x 10⁻⁵ 11.5 4.2
Ascorbate 1.2 6.8 x 10⁻⁶ 3.96 2.2 x 10⁻⁵ 5.2 19
Potassium 0.05 1.3 x 10⁻⁶ 0.17 4.2 x 10⁻⁶ 8.16
-Sodium 0.17 7.4 x 10⁻⁶ 0.56 2.4 x 10⁻⁵ 7.07 5.1
Calcium 0.12 2.99 x 10⁻⁶ 0.40 9.9 x 10⁻⁶ 6.77 1.4
Magnesium 0.08 3.29 x 10⁻⁶ 0.26 1.1 x 10⁻⁵ 6.50 1.7
Fructose 5.4 3.0 x 10⁻⁵ 18.0 1.7 x 10⁻⁴ 3.44
-Glucose 7.4 4.1 x 10⁻⁵ 24.7 1.3 x 10⁻⁴ 3.23 3.3
Sucrose 8.9 2.6 x 10⁻⁵ 29.7 8.7 x 10⁻⁵ 2.83 9.8
a for SNR = 3; b for SNR = 10, c Resolution between the corresponding peak and the previous one. Table 3. Concentration (mg L-1) of anions, cations and sugars in five coconut water samples (n = 3)
Analytes Sample 1a Sample 2a Sample 3b Sample 4b Sample 5b
Chloride 1310 ± 60 1010 ± 50 1440 ± 50 02190 ± 110 01440 ± 100
Sulfate 019 ± 2 < LOD 118 ± 8 175 ± 7 062 ± 1
Phosphate 0210 ± 10 082 ± 1 149 ± 1 432 ± 4 080 ± 3
Malate 3560 ± 14 03320 ± 120 1890 ± 50 2610 ± 80 2900 ± 90
Ascorbate < LOD < LOD < LOD < LOD 0390 ± 40
Potassium 01640 ± 100 01560 ± 110 0990 ± 20 01550 ± 110 01840 ± 130
Sodium 041 ± 2 025 ± 2 0260 ± 20 0230 ± 20 0197 ± 14
Calcium 182 ± 5 258 ± 9 119 ± 5 155 ± 8 168 ± 9
Magnesium 078 ± 2 043 ± 4 038 ± 2 047 ± 4 036 ± 3
Fructose (161 ± 1)×100 (193 ± 5)×100 (184 ± 4)×10 (243 ± 9)×100 (250 ± 10)×100
Glucose (167 ± 5)×100 (193 ± 16)×100 (107 ± 1)×10 (810 ± 50)×10 (221 ± 5)×100
Sucrose (58 ± 5)×100 (48 ± 5)×100 (177 ± 2)×100 (80 ± 2)×100 (73 ± 2)×100
a unprocessed coconut water, b processed coconut water.
References
1. Banzon, J.A.; Philippine J. Coconut Studies 1977, 2, 13. 2. Seow, C.C.; Gwee, C.N.; Int. J. Food Sci. Tecnol. 1997, 32,
189.
3. Aragão, W.M.; A Importância do Coqueiro-Anão Verde, http://www.embrapa.br, accessed in March 2005.
4. Santoso, U.; Kubo, K.; Ota, T.; Tadokoro, T.; Mackawa, A. ;
Food Chem. 1996, 7, 299.
5. Aleixo, P.C.; Nóbrega, J.A.; Santos, D.; Muller P.C.S.; Quim. Nova 2000, 23, 310.
6. Dey, G.; Sachan, A.; Ghosh, S.; Mitra, A.; Ind. Crops Prod.
2003, 18, 171.
7. Leong, L.P.; Shui, G.; Food Chem. 2002, 76, 69.
8. Wagner, K-H.; Derkits, S.; Herr, M.; Schuh, H.; Elmadfa, I.;
Food Chem. 2002, 78, 375.
9. Andrade, E.R.; Amorim, C.A.; Matos, M.H.T.; Rodrigues, A.P.R.; Silva, J.R.V.; Dode, M.A.N.; Figueiredo, J.R.; Small
Ruminant Res. 2002, 43, 235.
10. Jackson, J.C.; Gordon, A.; Wizzard, G.; McCook, K.; Rolle,
R.; J. Sci. Food Agric. 2004, 84, 1049.
11. Petroianu, G.A.; Kosanovic, M.; Shehatta, I.S.; Mahgoub, B.; Saleh, A.; Maleck, W.H.; J. Trace Element. Exp. Med. 2004,
12. Khan, M.N.; Muti-Ur-Rehman; Khan, K.W.; Pakistan J. Botany
2003, 35, 925.
13. Brito, N.M.; Navickiene, S.; Polese, L.; Jardim, E.F.G.; Abakerli, R.B.; Ribeiro, M.L.; J. Chromatogr. A2002, 957, 201.
14. Ge, L.Y.; Yong, J.W.H.; Tan, S.N.; Yang, X.H.; Ong, E.S.; J.
Chromatogr. A 2004, 1048, 119.
15. da Silva, J.A.F.; Guzman, N.; do Lago, C.L.; J. Chromatogr. A
2002, 942, 249.
16. da Silva, J.A.F.; do Lago, C.L.; Anal. Chem. 1998, 70, 4339. 17. Rocha, F.R.; da Silva, J.A.F.; do Lago, C.L.; Fornaro, A.; Gutz,
I.G.R.; Atmos. Environ. 2003, 37, 105.
18. da Silva, J.A.F.; Ricelli, N.L.; Carvalho, A.Z.; do Lago, C.L.;
J. Braz. Chem. Soc. 2003, 14, 265.
19. Munoz, R.A.A.; Richter, E.M.; de Jesus, D.P.; do Lago, C.L.; Angnes, L.; J. Braz. Chem. Soc. 2004, 15, 523.
20. Carvalho, A.Z.; da Silva, J.A.F.; do Lago, C.L.; Electrophoresis
2003, 24, 2138.
Received: March 21, 2005 Published on the web: August 30, 2005