Printed in Brazil - ©2005 Sociedade Brasileira de Química 0103 - 5053 $6.00+0.00
Article
* e-mail: [email protected]
Characterization of Buriti (
Mauritia flexuosa
L.) Oil by Absorption and
Emission Spectroscopies
Marcos L. S. Albuquerquea, Ilde Guedesa, Petrus Alcantara Jr.b, Sanclayton G. C. Moreirab, Newton M. Barbosa Neto*,c, Daniel S. Correac and Sergio C. Zilioc
a
Departamento de Física, Universidade Federal do Ceará, Campus do Pici, CP 6030, 60455-970 Fortaleza - CE, Brazil
b
Departamento de Física, Universidade Federal do Pará, Campus do Guamá, 66715-110 Belém - PA, Brazil
c
Departamento de Física e Ciência dos Materiais, Instituto de Física de São Carlos, Universidade de São Paulo, CP 369, 13560-970 São Carlos - SP, Brazil
Amostras de óleo obtido do fruto do Buriti (Mauritia flexuosa L.) foram caracterizadas por espectroscopia de absorção e emissão. O espectro de absorção foi obtido no intervalo de 300 a 2000 nm, enquanto o espectro de emissão foi analisado entre 400 e 800 nm, onde observamos várias bandas. Para melhor entender a complexidade destes espectros, também obtivemos os espectros de absorção e emissão dos componentes majoritários do óleo de Buriti. Correlacionando estes dados, apresentamos uma discussão sobre a origem das bandas observadas.
Oil samples obtained from Buriti (Mauritia flexuosa L.) palm tree fruits were characterized by absorption and emission spectroscopies. The absorption spectrum was recorded in the range from 300 to 2000 nm, while the emission spectrum was analyzed between 400 and 800 nm, where several bands were observed. To better understand these complex spectra, we recorded both absorption and emission spectra of its major components. By correlating these data, we present a discussion on the possible origin of the bands observed.
Keywords: vegetable oil, Mauritia flexuosa, absorption and emission spectra
Introduction
In the last few years several Amazon vegetable oils, including Buriti,1 Copaiba,2,3 and Babaçu4 oils, have been
studied. To make sure that they are suitable for commercial use, it is very important to investigate their chemical and physical properties. In particular, we are interested in Buriti oil, which was previously characterized as being composed mainly by fatty acids, tocopherols and carotenes.5 Some
of its characteristics are: red-orange color due to presence of carotenes, density of 0.86 g cm-3, refractive index of
1.46 at 22 oC, iodine index of 77.2 cg I
2 per 100 g,
saponification index of 169.9 mg KOH per g and melting point at 12 oC. Tocopherols, one of the constituents of
Buriti oil, are natural anti-oxidants forming vitamin E. Among the eight different natural tocopherols presenting vitamin E activity, α-tocopherol is the most important, corresponding to 90% of the total amount of tocopherols
in animal tissues and has the largest biological activity. The fatty acids, also present in the Buriti oil, are of long chain, given that they have more than 10 carbon atoms in their structure. Besides these components, Buriti and vegetable oils in general, present some amount of chlorophyll A in their chemical composition. The chlorophyll A may be present in the peel and pulp of the fruit.
Recently, thermal properties of Buriti, Copaiba, Pequi and Babaçu oils were analyzed by the thermal lens technique.6 In addition, physical and chemical properties
of Buriti oil were characterized by means of dielectric loss and differential scanning calorimetry measurements.1 The
analysis of its infrared absorption spectrum and the assignment of the bands observed between 650 and 4000 cm-1 have recently been reported.7 The spectrum is very
formation of alkanes, alkylcycloalcanes and alkylbenzenes during the catalytic hydrocracking of Buriti oil. Ongoing in the characterization of Buriti oil, here we focus on its absorption and emission spectra in the range 300–2000 nm. The assignment of both absorption and emission bands of the Buriti oil was performed based on correlations with the bands present in its individual components.
Experimental
Samples
The Buriti fruit was collected from a palm tree abundant in the Amazon region. Approximately, the fruit presents the following composition: 20% of shell and pulp, 30% of white cellulose layer and 50% of seed (m/m of fruit). After removing the white cellulose layer and the seeds, the resulting shell and pulp were dried in an oven with air circulation at 60 oC for 24 h. The dried solid material was
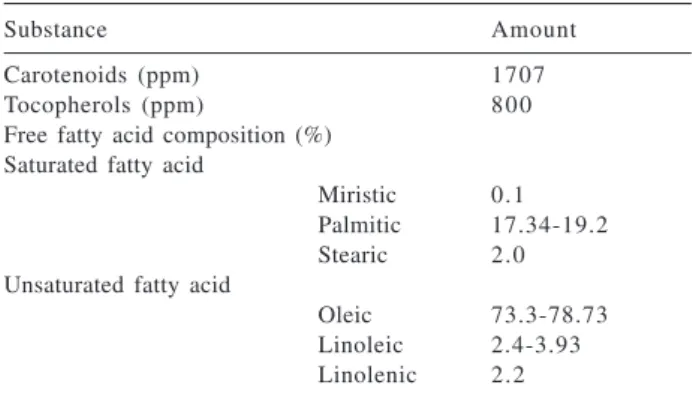
then ground in a comminuting mill and sifted for 30 min in a sieve shaker fitted with sieves of different sizes. Absorption and fluorescence measurements were carried out by using the Buriti oil as extracted. The extracts were analyzed with respect to total carotenes in a spectrophotometer and to other components (free fatty acid and tochopherols) by gas chromatography using the same procedure described before.1 Table 1 presents the oil
composition used in this work.
Many types of carotenoids were found, as listed in Table 2. As seen, the main contribution to the concentration of carotenoids comes from β-carotenes. The spectroscopic results presented later will be analyzed taking into account the contributions from α-tocopherol (AT), β-carotene (BC), chlorophyll A (CA), oleic acid (OA) and palmitic acid (PA), which are the major components of Buriti oil. Since we are not taking into account all of its components, the discussion presented focus only on a qualitative analysis.
Fatty acids (palmitic and oleic) and α-tocopherol were purchased from Merck & Co. Inc. and Sigma-Aldrich Co., respectively. The oleic acid was used as received while the palmitic acid was diluted in a 2 mol L-1 ethanol solution.
Absorption and emission spectra
The absorption spectra were obtained in a Cary-17 spectrophotometer with a resolution of 1.0 nm. The fluorescence spectra were measured at right-angle with an optical fiber based USB 2000 Ocean Optics portable spectrometer integrating the overall signal. This enables us to desconsider any transient effect. All measurements were performed with the substances (in the liquid state) inside a 1 cm long quartz cuvette. As excitation source we used a tunable optical parametric amplifier (TOPAS, from Light Conversion) pumped by 150 fs pulses at 775 nm delivered by a Ti: sapphire chirped pulse amplified system (CPA-2001, from Clark-MXR Inc.) operating at a 1 kHz repetition rate. The FWHM pulse width delivered by the parametric amplifier was about 120 fs, and the beam transverse profile presented a nearly Gaussian distribution. All spectra were recorded at room temperature and the results shown below are the average of 10 runs.
Results and Discussion
Figure 1 shows part of the normalized absorption spectrum of Buriti oil and some of its constituents in the range 300-550 nm. Absorption spectra of BC and CA were obtained from References 9 and 10, respectively. A high absorption for wavelengths shorter than 500 nm is observed. It should be noted that both BC and CA are responsible for the absorption from 500 down to 400 nm, while AT, PA and OA give rise to the absorption for wavelengths shorter than 375 nm. However, none of these compounds absorb significantly around 380 nm, suggesting that the contribution of other compounds of Table 1, not studied here, should be considered to correctly reproduce the Buriti oil spectrum.
Table 2. Contents (ppm) of carotenoids present in the Buriti oil
Substance Amount Substance Amount
(ppm) (ppm)
trans-β-carotene 672 ± 10 α-carotene 61 ± 7 13-cis-β-carotene 359 ± 27 mutachrome 45 ± 1 9-cis-β-carotene 150 ± 18 ζ-carotene 39 ± 3 phytofluene 150 ± 8 β-zeacarotene 38 ± 1 zeaxantine 098 ± 4 γ-carotene 13 ± 1
β-10-apo-carotene 070 ± 3 δ-carotene 11 ± 1
Table 1. Composition of the Buriti oil
Substance Amount
Carotenoids (ppm) 1707
Tocopherols (ppm) 800
Free fatty acid composition (%) Saturated fatty acid
Miristic 0.1 Palmitic 17.34-19.2
Stearic 2.0
Unsaturated fatty acid
Oleic 73.3-78.73
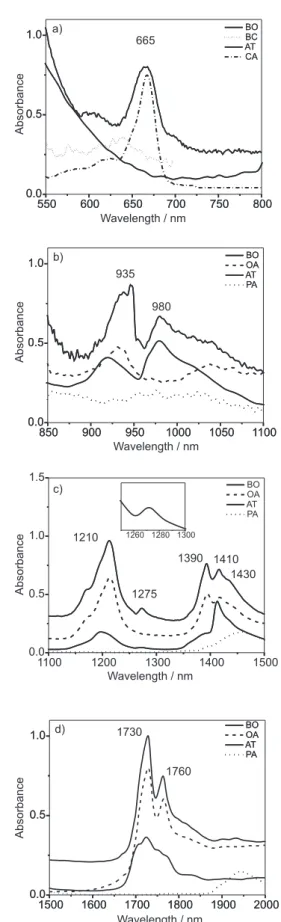
Figure 2a presents the normalized absorption spectra of Buriti oil and some of its constituents in the range 550-800 nm. The only absorption band observed at 665 nm should probably be attributed to CA (Q band).10 Figure 2b
shows the normalized absorption spectra in the range 850-1100 nm. It is observed that both AT and OA contribute to the band at 935 nm, while that at 980 nm is much probably to AT. Figure 2c shows the normalized absorption spectra in the 1100-1500 nm interval where several bands are observed. It seems that the main contribution to the absorption profile comes mainly from the OA, although there exists some contribution from AT. Similar spectra were also observed for decanoic acid.11 Usually, in the near
infrared (NIR) interval, OA shows strong bands at 1210, 1390, 1410, and 1430 nm.12 The band at 1210 nm is due to
the second overtone of the CH2 stretching mode, and the remaining bands are assigned to combination modes of the CH fundamental stretching vibration with deformation vibrations of CH groups.12 According to the inset, the band
at 1275 nm seems to be due to the AT. Figure 2d shows two intense absorptions around 1730 and 1760 nm basically due to the OA, which is assigned to the first overtone of stretching vibrations for hydrogen-bonded OH and/or CH of both CH2 e CH3 groups.
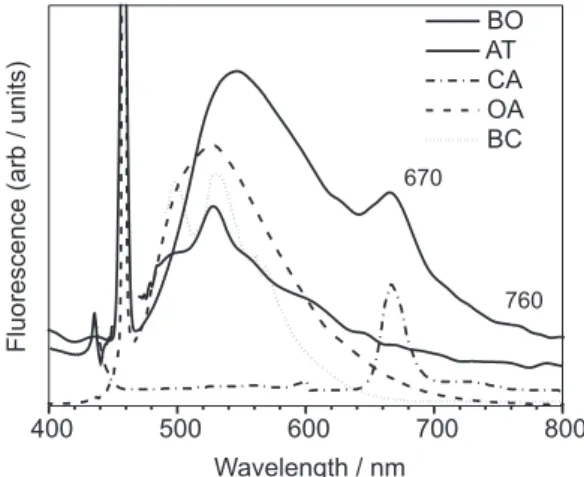
There exist several papers already published reporting the emission spectra of many natural oils.13,14 However,
none of them present the analysis based on the individual oil components. Figure 3 shows the emission spectra exhibited by Buriti oil and its components in the range 400-800 nm excited by 458 nm radiation. We observe three emission bands around 550, 670 and 760 nm. For the band at 550 nm we have the contribution of OA, BC and AT. According to reference 15, BC absorbing at 488 nm (and also 458 nm) fluoresces in the range 530-920 nm. The excitation wavelength drives the 1Ag- (0) → 1B
u + (2)
Figure 1 - Normalized absorbance spectra of Buriti oil and some of its components in the range 300-550 nm. BO = Buriti oil, BC =
β-carotene, CA = chlorophyll A, AT = α-tocopherol, PA = palmitic acid and OA = oleic acid.
Figure 2 - Normalized absorbance spectra of Buriti oil and some of its components in different spectral ranges. (a) 550-800 nm, (b) 850-1100 nm, (c) 1100-1500 nm and (d) 1500-2000 nm. The inset in Figure 2c is a close view of region from 1250 to 1300 of
absorptive transition producing a fluorescence spectrum due to the 1Bu+ → 1A
g
– (0,1,2,3) emissive transitions in
the range 500-600 nm while the very weak fluorescence spectrum observed for λ > 600 nm is mainly due to the 2Ag–→ 1A
g
– (0,1,2,3,4) emissive transitions.
The remaining bands to be analyzed are much probably due to CA. According to Rebane and Avarmaa,16 a
fluorescence emission at 670 nm has been observed in CA exciting it at 480-490 nm (B band). This fluorescence comes from the S1 → S0, emissive transition. The weak fluorescence band at 760 nm is not observed in isolated complexes,17 which presents a fluorescence band at
720-735 nm. It has been shown that cyanobacterial cells and membranes exhibit a fluorescence band at 750-760 nm, which is emitted by long wavelength chlorophyll absorbing at 735 nm (Q band).18 Hence, the long
wavelength emitted by chlorophyll is re-absorbed by it (cf. Figure 2a) resulting in the fluorescence band at 760 nm. According to Osbone and Fearn,19 this emission band
is formed only in high molecular mass complexes, which is the case of complex multicomponent compounds like Buriti oil.
In order to make sure the assignment of the fluorescence bands observed, we have varied the wavelength of the exciting laser from 458 to 514 nm. In Figure 4 we plot the behavior of the ratio between the intensities of the bands at 550 and 670 (I550/I670) nm as a function of the excitation wavelength.
By increasing the wavelength we observe that the ratio starts decreasing, being equal to one for λ = 488 nm and therefore becoming less than one for λ≥ 496 nm. Such a behavior indicates that as the wavelength increases, smaller is the contribution of BC, AT and OA absorption bands as already shown in Figure 1. It should also be mentioned that the ratio increases a bit when λ changes from 514 to
Figure 4 - Plot of the intensity ratio I550/I670 as a function of the excitation wavelength. The line is a guide for eyes.
532 nm. For this wavelength, the excitation is in between bands B and Q of CA, where the absorption is lower and therefore the intensity of the fluorescence band at 670 nm decreases with respect to the background signal. Only for wavelengths λ > 620 nm (the beginning of the Q band) this band becomes well defined and more intense with respect to the background.
Conclusions
Summarizing, we have presented a qualitative study of the absorption and emission spectra of Buriti oil and its major components at room temperature. Several absorption bands were observed in the range 300-2000 nm. They were tentatively identified and it was observed that for shorter wavelengths (λ < 500 nm) the absorption is mainly to some of its components as OA, PA, AT, BC and CA. For longer wavelengths (λ > 1000 nm) it seems that the main contributor is the OA. The emission spectrum of Buriti oil presents three bands in the range 400-800 nm which were also assigned. Many of its individual components contribute to the shorter wavelength band at around 570 nm, while basically only CA contributes to the 670 and 760 nm bands.
Acknowledgments
This work was supported by the CNPq under contract No. 475191/01-3, FUNCAP under contract No. 219/01,
FUNTEC under contract No. 015/00, and FAPESP under
contract No. 01/07410-2.
References
1. Garcia-Quiroz, A.; Moreira, S.G.C.; De Morais, A.V.; Silva, A.S.; Da Rocha, G.N.; Alcantara Jr., P.; Instrum. Sci. Technol. 2003,31, 93.
2. Tappin, M.R.R.; Pereira, J.F.G.; Lima, L.A.; Siani, A.C.; Mazzei J.L.; Ramos, M.F.S.; Quim. Nova2004, 27, 236.
3. da Veiga V. F.; Pinto A. C.; Quim. Nova2002, 25, 273. 4. Sarubbo, L.A; Marcal, M.C.R.; Campos-Takaki, G.M.; Arq.
Biol. Tecnol.1997, 40, 707.
5. Yang, C.-W.; Peng, C.-L.; Duan, J.; Chen, Y.-Z.; Bot. Bull.
Acad. Sin.2002,43, 181.
6. Bernal-Alvarado, J.; Mansanares, A.M.; Da Silva, E.C.; Moreira, S.G.C.; Rev. Sci. Instrum.2003, 74, 697.
7. Albuquerque, M.L.S.; Guedes, I.; Alcantara Jr., P.; Moreira, S.G.C.; Vib. Spectrosc. 2003, 33, 127.
8. Da Rocha, G.N.; Brodzki, D.; Djegamariadassou, G.; Fuel 1993, 72, 543.
9. http://www.chm.bris.ac.uk, accessed in May 2004.
10. Barbosa Neto, N.M.; Corrêa, D.S.; dos Santos Jr., D.S.; Misoguti, L.; Oliveira Jr., O.N.; Zílio, S.C.; Mendonça, C.R.; Mod. Phys.
Lett. B2003, 17, 83.
11. Iwahashi, M.; Hachiya, N.; Hayashi, Y.; Matsuzawa, H.; Suzuki, M.; Fujimoto, Y.; Ozaki, Y.; J. Phys. Chem.1993, 97, 3129. 12. Sasic, S.; Muszynski, A.; Ozaki, Y.; J. Phys. Chem. A2000,
104, 6380.
13. Zandomeneghi, M.; Carbonaro, L.; Caffarata, C.; J. Agric. Food Chem.2005, 53, 759.
14. Sikorska, E.; Gorecki, T.; Khmelinskii, I.V.; Henrance, R.; Bourdelance, J.L.; Sikorski, M.; Koziol, J.; Food Chem. 2005,
89, 217.
15. Onaka, K.; Fujii, R.; Nagae, H.; Kuki, M.; Koyama, Y.; Watanabe, Y.; Chem. Phys. Lett.1999, 315, 75.
16. Rebane, K.K.; Avarmaa, R.A.; Chem. Phys.1982, 68, 191. 17. Shubin, V.V.; Bezsmertnaya, I.N.; Karapetyan, N.V.; FEBS
Lett.1992, 309, 340.
18. Shubin, V.V.; Murthy, S.D.S.; Karapetyan, N.V.; Mohanty, P.; Biochim. Biophys. Acta 1991, 1060, 28.
19. Osbone, B.G.; Fearn, T. In Near Infrared Spectroscopy in Food Analysis; Lonman Scientific & Technical: New York, 1986, p. 28.
Received: November 4, 2004
Published on the web: August 30, 2005