Network-Based Analysis of Schizophrenia
Genome-Wide Association Data to Detect
the Joint Functional Association Signals
Suhua Chang☯, Kechi Fang☯, Kunlin Zhang, Jing Wang
*
Key Laboratory of Mental Health, Institute of Psychology, Chinese Academy of Sciences, Beijing, China
☯These authors contributed equally to this work. *[email protected]
Abstract
Schizophrenia is a common psychiatric disorder with high heritability and complex genetic architecture. Genome-wide association studies (GWAS) have identified several significant loci associated with schizophrenia. However, the explained heritability is still low. Growing evidence has shown schizophrenia is attributable to multiple genes with moderate effects. In-depth mining and integration of GWAS data is urgently expected to uncover disease-related gene combination patterns. Network-based analysis is a promising strategy to better interpret GWAS to identify disease-related network modules. We performed a network-based analysis on three independent schizophrenia GWASs by using a refined analysis framework, which included a more accurate geneP-value calculation, dynamic network module searching algorithm and detailed functional analysis for the obtained modules genes. The result generated 79 modules including 238 genes, which form a highly con-nected subnetwork with more statistical significance than expected by chance. The result validated several reported disease genes, such asMAD1L1,MCC,SDCCAG8,VAT1L,
MAPK14,MYH9andFXYD6, and also obtained several novel candidate genes and gene-gene interactions. Pathway enrichment analysis of the module gene-genes suggested they were enriched in several neural and immune system related pathways/GO terms, such as neuro-trophin signaling pathway, synaptosome, regulation of protein ubiquitination, and antigen processing and presentation. Further crosstalk analysis revealed these pathways/GO terms were cooperated with each other, and identified several important genes, which might play vital roles to connect these functions. Our network-based analysis of schizophrenia GWASs will facilitate the understanding of genetic mechanisms of schizophrenia.
Introduction
Schizophrenia (SZ) is a severe psychiatric disorder affecting~5‰of the population worldwide
[1,2]. Family and twin studies have shown schizophrenia has high heritability ranging 73%–
90% [3]. Genome-wide association study (GWAS) is an effective strategy to screen disease OPEN ACCESS
Citation:Chang S, Fang K, Zhang K, Wang J (2015) Network-Based Analysis of Schizophrenia Genome-Wide Association Data to Detect the Joint Functional Association Signals. PLoS ONE 10(7): e0133404. doi:10.1371/journal.pone.0133404
Editor:Chunyu Liu, University of Illinois at Chicago, UNITED STATES
Received:December 19, 2014
Accepted:June 26, 2015
Published:July 20, 2015
Copyright:© 2015 Chang et al. This is an open access article distributed under the terms of the
Creative Commons Attribution License, which permits unrestricted use, distribution, and reproduction in any medium, provided the original author and source are credited.
Data Availability Statement:All relevant data are within the paper and its Supporting Information files.
related genetic factors at genome level [4,5]. Plenty of GWASs have been conducted for schizo-phrenia and have identified many susceptibility loci [6–12], but they could only explain a small proportion of the genetic component of schizophrenia. The underlying genes remain largely unknown, especially the interplays between these susceptibility genes. It has been commonly accepted that the combination effects of multiple loci with moderate statistical significance, which might be lost in the GWAS approach due to the stringent significance level after multiple comparison correction, might make a risk contribution to schizophrenia.
To detect the common polygenic variations contributed to schizophrenia, analyses that focus on pathways or gene combination patterns could facilitate the reveal of disease related genes and the underlying genetic basis [13]. Pathway-based analysis (PBA) is one type of method employed to identify trait-associated pathways from GWAS [13] and has been used in many psychiatric diseases [14–16], autoimmune diseases [17,18]etc. However, PBA depends on prior biological pathways and treats the whole pathway as a single unit, it cannot detect a small portion of the pathway or other new combination of genes which may be associated with disease. Recent years, network-based analysis, which was originally used for gene expression data [19], was proposed to analyze GWAS data [20] and has been applied into several diseases with different analysis framework [21–24]. This method aims to identify connected network modules that show significant disease association signals by integrating GWAS data with molecular network. Compared with pathway-based analysis, the molecular network used in network-based analysis has higher coverage of human genes and the resulted modules could be of any size [20].
The Psychiatric Genetic Consortium (PGC) has collected a wealth of valuable genotypic data for schizophrenia, while the traditional single marker analysis will miss a large proportion of weakly associated markers. Network-based analysis of these data would facilitate the discov-ery of novel susceptibility genes or modules for schizophrenia. Despite there have been three network-based analyses for schizophrenia [21,24,25], the analysis pipeline still needs to fur-ther refine to sufficiently explore valuable information from the large number of genotyping data. Firstly, considering the collections of GWAS data from PGC were genotyped using vari-ous platforms and the sample sizes varied largely, how to effectively in-depth mine these data requires continuous exploration to obtain new knowledge. Secondly, it has been shown that geneP-value calculation is a critical step in network-based analysis [25]. Several gene-based association test methods have been developed and they have better performance than minimal P-value of SNPs in one gene, such as VEGAS [26] and GATES [27]. Furthermore, besides detecting the combined pattern of multiple genes relevant to schizophrenia, deeply functional annotation and analysis of the identified module genes could provide new insights for the understanding of disease mechanism.
In this study, we performed a network-based analysis on three independent schizophrenia GWASs from PGC by using a more accurate geneP-value calculation [26], dynamic network module searching algorithm [20] and detailed functional analysis for the obtained module genes. The result generated 79 modules including 238 genes, which formed a highly connected subnetwork with more statistical significance than expected by chance. The result validated several reported disease genes, such asMAD1L1,MCC,SDCCAG8,VAT1L,MAPK14,MYH9 andFXYD6, and also obtained several novel candidate genes and gene-gene interactions. Pathway enrichment analysis for the module genes showed they were significantly enriched in several neural and immune system related signaling pathways, biological processes, and pro-tein activities. Furthermore, crosstalk analysis of these pathways assisted the understanding of the functional connections between them and revealed several important genes, such as MAPK1,PSMB8,TRAF6andCAV1, which might play vital roles during these functions. Our Competing Interests:The authors have declared
network-based analysis of schizophrenia GWASs would facilitate the understanding of genetic mechanism of schizophrenia.
Materials and Methods
GWAS datasets and preprocessing
The GWAS data used in this study was from PGC and approved by the National Institute of Mental Health (NIMH) (https://www.nimhgenetics.org/available_data/data_biosamples/ gwas_data.php). Six collections of GWAS data genotyped on Affymetrix 6.0 platform and three collections of GWAS data genotyped on Affymetrix 500K platform were selected for this study. Then, we merged these datasets into three groups and named them as MGS, Affy6, and Affy500K separately. The detailed information about the GWAS datasets was summarized
inTable 1. A consistent quality control process was conducted for the three GWAS datasets
separately using PLINK [28]. Briefly, (i) SNPs were excluded if they had a missing rate>0.05
(before sample removal below); (ii) we removed samples with missing rate>0.05 or
heterozy-gosity rate outside 3 standard deviation from the mean; (iii) we calculated identity by descent (IBD) after pruning SNPs usingr2= 0.2 as threshold, and then excluded duplicated or related individuals with IBD>0.185; and (iv) we excluded SNPs with significant call rate difference in
cases and controls (P<10−5), minor allele frequency (MAF)<0.05 or Hardy-Weinberg equilib-riumP<10−6. Principal component estimation was done with EIGENSTRAT [29], which used the same collection of SNPs for IBD calculation. We estimated the first 20 principle compo-nents and evaluated their impact on the genome-wide test statistics usingλas [11]. Based on
this, we used the top five principle components with the smallestλtogether with the study
indi-cator variables as associated covariates for logistic regression test to calculateP-values of SNPs. To check theP-value of identified module genes in a larger dataset, SCZ2 was applied [30]. SCZ2 SNPP-value list was downloaded from PGC website (http://www.med.unc.edu/pgc/
downloads) and filtered to keep only SNPs whose imputation info score>0.8. More than eight
million SNPs were left for subsequent analysis.
Protein-protein interaction network dataset
The protein-protein interaction (PPI) network data was collected from InWeb [31], which con-tains high-confidence interactions as those seen in multiple independent experiments and
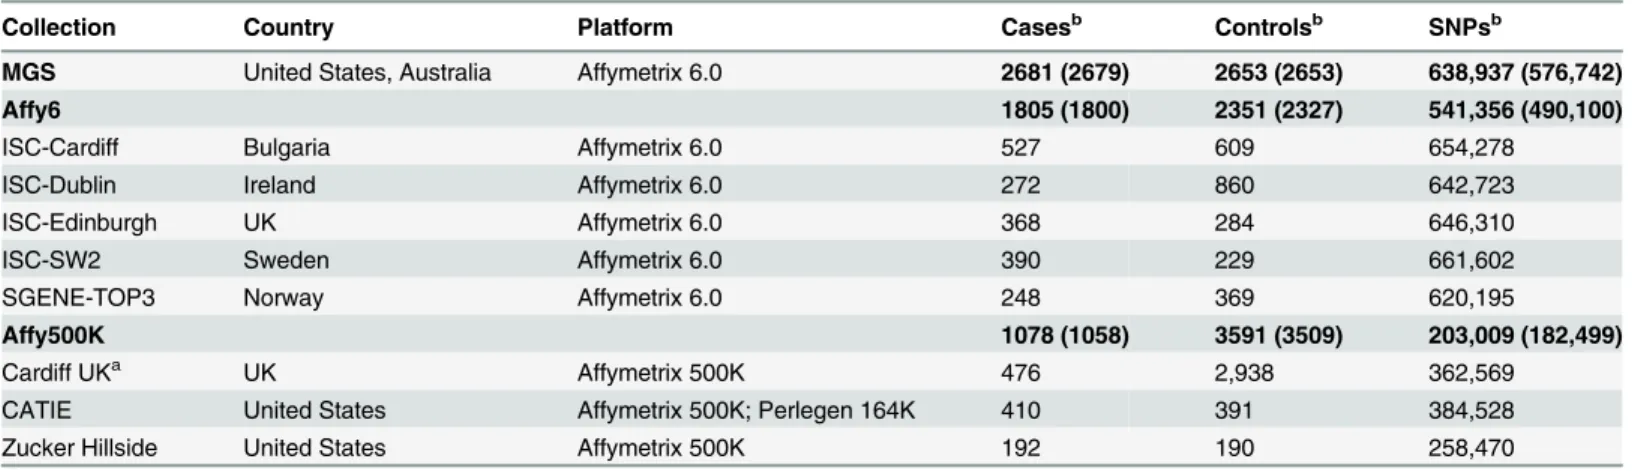
Table 1. Schizophrenia GWAS datasets used for this analysis.
Collection Country Platform Casesb Controlsb SNPsb
MGS United States, Australia Affymetrix 6.0 2681 (2679) 2653 (2653) 638,937 (576,742)
Affy6 1805 (1800) 2351 (2327) 541,356 (490,100)
ISC-Cardiff Bulgaria Affymetrix 6.0 527 609 654,278
ISC-Dublin Ireland Affymetrix 6.0 272 860 642,723
ISC-Edinburgh UK Affymetrix 6.0 368 284 646,310
ISC-SW2 Sweden Affymetrix 6.0 390 229 661,602
SGENE-TOP3 Norway Affymetrix 6.0 248 369 620,195
Affy500K 1078 (1058) 3591 (3509) 203,009 (182,499)
Cardiff UKa UK Affymetrix 500K 476 2,938 362,569
CATIE United States Affymetrix 500K; Perlegen 164K 410 391 384,528
Zucker Hillside United States Affymetrix 500K 192 190 258,470
aThe controls of Cardiff UK were from WTCCC [69].
bThe number of cases, controls and SNPs after quality control were labeled in parentheses.
reported more often in lower-throughput experiments. After mapping with approved gene symbol in HGNC [32] and removing self-interactions, the remaining PPI network was com-prised of 12,387 proteins and 156,095 interactions.
Gene-based association analysis
In the network analysis pipeline, the gene-based association analysis was conducted using VEGAS [26], which takes into account both the effects of all SNPs mapped to gene and linkage disequilibrium (LD) between SNPs by using simulations from the multivariate normal distri-bution to calculate the geneP-values. VEGAS allocates SNPs to one or more autosomal genes according to gene positions, in which gene version of hg18 was used and LD patterns of SNPs were estimated using HapMap data. Herein, the offline version of VEGAS was used. All SNPs mapped to gene within 20kb upstream and downstream of gene coordinates were used to calculate the geneP-value. In addition, several improvements were made based on the down-loaded version. First, the SNP positions of three GWAS datasets and gene version were updated to GRCh37.p11 and downloaded from Ensembl BioMarts [33]; second, all genes with HGNC symbols were filtered to ensure at least one SNP was mapped within 20kb of gene coordinates; third, the SZ specific genotype data was used to estimate LD patterns for SNPs within each gene instead of the HapMap data. Adjust geneP-values was calculated usingp.adjustfunction in R by inputting geneP-value list as input and setting adjust method as Benjamini & Hoch-berg (FDR). To calculate geneP-value from the largest scale of GWAS data SCZ2 for replica-tion, we used an alternative gene-based association test tool,i.e. GATES [27], which does not need permutation or simulation to evaluate empirical significance and is much faster. 1000 Genome phase I [34] EUR genotype data (hg19) were used for LD calculation. Extended gene region length was 20kb at both 5’and 3’. Threshold ofr2for SNPs in high LD was 0.8. Other parameters were default.
Network module search and evaluation
We used a dense module search (DMS) method, which is a R package developed by Jiaet al. (called dmGWAS) [20], to identify functional modules enriched for SZ association signals. The DMS algorithm dynamically searches for a dense module that holds as many genes with small P-value as possible for each node in the context of a node-weighted PPI network. The module
score is defined asZm¼
P zi
.
ffiffi k
p , where k is the number of genes within a module,ziis
trans-ferred from geneP-value according tozi=;−1(1−Pi), in which;−1denotes the inverse normal
distribution function [19]. In each round of module searching, the DMS algorithm starts with each seed gene as the initial module and identifies neighborhood interactors, which are defined as nodes whose shortest path to the module is within a distanced. The genes generating the maximum increment ofZmwill be added to the module ifZm+1>Zm(1 +r), whereZmis the
original module score,Zm+1is the new module score, andris a pre-defined expansion rate. Herein,dandrwere set to 2 and 0.1 as [20]. This process iterates until none of the nodes can satisfyZm+1>Zm(1 +r). To evaluate the significance of the identified modules, we undertook
two steps of examination. First, we calculatedP-values based on module score (Zm) for each
module by empirically estimating the null distribution [35]. Specifically, module scoresZm
werefirst median-centered by subtracting the median value ofZmfrom each of them (Zmedian).
Then, the meanδand standard deviationσfor the empirical null distribution were estimated
usinglocfdrin R packages. The module scores were standardized byZs¼Zmedian d
.
sand
converted toP-values byP(Zm) = 1−;(ZS), where;is the normal cumulative density function.
the dmGWAS package to minimize the bias from different GWAS datasets [20]. Details of cross evaluation are provided in dmGWAS document. Briefly, the modules from one GWAS dataset were used as discovery dataset and the modules’significance in the other two GWAS datasets, which were as evaluation datasets, were evaluated in turn (i.e.P(Zm(eval)) was
calcu-lated). The criteria used to screen modules were the modules withP(Zm)<0.05 in the discovery
dataset andP(Zm(eval))<0.05 in any of the two evaluation datasets. Finally, the modules passed
the tests from all three datasets were merged together and denoted as the resultant modules. The workflow of the network-based analysis for SZ GWAS data was shown inS1 Fig.
Statistical and functional analysis of module genes
DAPPLE (Disease Association Protein-Protein Link Evaluator) [36] was used with input of a list of genes to evaluate how closely connected between the proteins encoded by module genes. Number of permutation was set to 10,000 times and common interactor binding degree cutoff was set to 2.
We used the DAVID Gene Set Enrichment Analysis tool [37,38] to evaluate the enriched functions of identified module genes, including GO biological process, GO cellular component, GO molecular function [39] and KEGG pathways [40]. Only terms with an adjustedP-value (Benjamini & Hochberg) of less than 0.05 and with gene numbers less than 350 were retained as [41].
Results
Gene-based tests
We calculated geneP-values for the three SZ GWASs datasets using VEGAS with some refine-ments. The result was shown inTable 2. In order to perform network-based analysis, each node in the PPI network was assigned a geneP-value as the node weight if the name was matched. Accordingly, a MGS-weighted PPI consisting of 11,456 genes, an Affy6-weighted PPI consisting of 11,362 genes, and an Affy500K-weighted PPI consisting of 10,232 genes were gen-erated, and these three weighted PPIs were denoted as background sets for the follow-up net-work analysis. There were 651 (5.7%), 681 (6.0%), and 589 (5.8%) genes withP-value<0.05 in
the background sets of MGS, Affy6 and Affy500K separately.
Disease related network modules
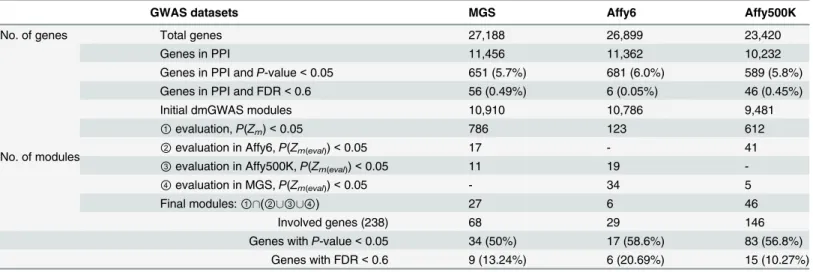
We next sought to identify modules enriched for SZ association signals in the background PPIs using dmGWAS. By performing dense module search with each gene in the background PPI as a seed, 10,910 modules for MGS, 10,786 modules for Affy6, and 9,481 modules for Affy500K were initially obtained (Table 2). After examining the significance of module score and cross validation, 27 modules (including 68 genes) for MGS, 6 modules (including 29 genes) for Affy6 and 46 modules (including 146 genes) for Affy500K met the criteria. Further-more, compared with the proportion of genes withP-value<0.05 contained in the background
PPI sets, the identified module genes for three datasets have a higher proportion of genes with P-value<0.05 (as shown inTable 2). After merging all modules from three datasets, a total of
modules, such asRPL35—SNORD21—PSAT1—PTPN21from MGS,FCHSD2—WASL— GRB2—MAPK14from Affy6,PSMA6—VHL—DGKIandTIAM1- ITIH1from Affy500K.
Annotation and functional analysis of module genes
To annotate the module genes which had been reported to be associated with schizophrenia, we searched two genetic databases: GWAS Catalog [42] and SZGene [43], and found that four genes (MAD1L1,SDCCAG8,MCCandVAT1L) had been reported their susceptibility with SZ by GWAS [11,44–46], and three genes (MAPK14[47],MYH9[48] andFXYD6[49]) had been reported at least one positive association in SZGene. Since many evidence suggested that schizophrenia and bipolar disorder (BD) share some symptoms and genetic factors [50], we also searched these genes in the bipolar disorder genetic database BDgene [51]. The result showed that 6 genes (includingMAD1L1[52],JAM3[53],MYL12B[53],MYL12A [53],ITIH1 [52] andRYR2[54]) had been reported to be significant associated with bipolar disorder in at least one genetic study.
To investigate the statistical significance of the interactions among proteins encoded by the module genes, we analyzed these genes by using DAPPLE. The results showed 230 out of the 238 module genes participated in the direct network (S2 Fig), and the direct PPI network of module genes had significantly more edges than expected by chance (P= 9.9 × 10⁻⁵), which means the network formed by the module genes were statistically significantly connected.
To explore the biological function of the module genes, pathway enrichment analyses were conducted for 238 merged module genes, 68 MGS module genes, 29 Affy6 module genes and 146 Affy500K module genes respectively. The results were listed inTable 3. The pathways enriched by 238 merged module genes involved several signaling pathways (such as neurotro-phin signaling pathway, VEGF signaling pathway), biological processes related with cellular adhesion, regulation of actin cytoskeleton, leukocyte transendothelial migration and regulation of protein metabolism, modification and ubiquitination, and cellular component of synapto-some. In addition, the analyses of the module genes from three separate datasets enriched an additional signaling pathway (GnRH signaling pathway) and one biological process (antigen processing and presentation).
To further understand the functional connections between these enriched pathways/GO terms, a crosstalk analysis was performed for them. According to their function and shared
Table 2. Results for gene-based test and dynamic module search of three schizophrenia GWAS datasets.
GWAS datasets MGS Affy6 Affy500K
No. of genes Total genes 27,188 26,899 23,420
Genes in PPI 11,456 11,362 10,232
Genes in PPI andP-value<0.05 651 (5.7%) 681 (6.0%) 589 (5.8%)
Genes in PPI and FDR<0.6 56 (0.49%) 6 (0.05%) 46 (0.45%)
No. of modules
Initial dmGWAS modules 10,910 10,786 9,481
①evaluation,P(Zm)<0.05 786 123 612
②evaluation in Affy6,P(Zm(eval))<0.05 17 - 41
③evaluation in Affy500K,P(Zm(eval))<0.05 11 19
-④evaluation in MGS,P(Zm(eval))<0.05 - 34 5
Final modules:①\(②[③[④) 27 6 46
Involved genes (238) 68 29 146
Genes withP-value<0.05 34 (50%) 17 (58.6%) 83 (56.8%)
Genes with FDR<0.6 9 (13.24%) 6 (20.69%) 15 (10.27%)
genes, the enriched pathways/GO terms (except three cancer related pathways) were classified into four groups as shown inFig 2. The first group included eight pathways from KEGG, which connect with many basic signaling pathways, such as MAPK signaling pathway, PI3K-Akt signaling pathway, and calcium signaling pathway. Furthermore, genesMAPK1, CDC42,PIK3CA,PIK3CGandPIK3R1were commonly shared by most of the eight pathways. The second group was synaptosome, which shares genesITGB1andMPDZwith the first group. The third group included six GO biological processes related with regulation of protein metabolic, modification, and ubiquitination, which are functionally related with neurotrophin signaling pathway through pathway ubiquitin mediated proteolysis. All these six GO terms involved several proteasome related genes, includingPSMA2,PSMB6,PSMB7,PSMB8, PSMC1andPSMD14, and ubiqutin C (UBC). The last group was antigen processing and pre-sentation, which involves several immune related genes, such asHLA-A,B2M,CD1Dand TAP2. The shared genes between these four groups of pathways/GO terms were shown inFig 2 panel C.
Fig 1. Protein-protein interaction network involving all merged module genes.Square nodes denote the reported genes associated with schizophrenia or bipolar disorder. The color of the node was proportioned with theP-value of gene. The width of the edge was proportioned with the No. of repeats of the
Discussion
Genetic data of schizophrenia has been accumulated rapidly over the past several years. In this study, we conducted a network-based analysis on three independent schizophrenia GWAS datasets to explore the joint effects of multiple genetic association signals on schizophrenia. After merging the modules identified separately from the three GWASs, 79 modules enriched with robust genetic signals in GWAS datasets were screened out, and 238 genes were involved in the identified modules. These modules and module genes could provide potential candidate genes, gene-gene interactions and molecular pathways involved in schizophrenia pathogenesis.
Of the 238 module genes, seven schizophrenia candidate genes had been collected in either GWAS Catalog or SZGene. Since the network-based analysis aims to search for module genes, which is a combination of several jointly GWAS signals, some genes with biggerP-value may also be selected. For example, among the seven replicated genes, although most of them hadP -value<0.05 in at least one of three SZ GWAS datasets, geneVAT1LhadP-value>0.05 in all
three SZ GWAS datasets. The identification ofVAT1Lby our network-based analysis might be due to its connection with another two genes withP-value<0.05 (SEPT3andARPC5L). One
Table 3. Enriched KEGG pathways and GO terms by module genes.
Gene Sourcea Category Term N (X)b FDRc
Merged KEGG hsa04670:Leukocyte transendothelial migration 118 (15) 8.32×10⁻⁵
Merged KEGG hsa04722:Neurotrophin signaling pathway 124 (14) 0.0011
Merged KEGG hsa04370:VEGF signaling pathway 75 (11) 0.0024
Merged KEGG hsa04810:Regulation of actin cytoskeleton 215 (17) 0.0058
Merged KEGG hsa04510:Focal adhesion 201 (16) 0.0114
Merged KEGG hsa04530:Tight junction 134 (13) 0.0154
Merged KEGG hsa04910:Insulin signaling pathway 135 (13) 0.0166
Merged KEGG hsa05200:Pathways in cancer 328 (22) 0.0019
Merged KEGG hsa05214:Glioma 63 (10) 0.0044
Merged KEGG hsa05222:Small cell lung cancer 84 (10) 0.0478
Merged GO CC GO:0019717~synaptosome 85 (10) 0.0065
Merged GO BP GO:0051247~positive regulation of protein metabolic process 243 (17) 0.0016 Merged GO BP GO:0032270~positive regulation of cellular protein metabolic process 233 (16) 0.0047
Merged GO BP GO:0031399~regulation of protein modification process 295 (17) 0.0196
Merged GO BP GO:0031400~negative regulation of protein modification process 119 (11) 0.0229
Merged GO BP GO:0031396~regulation of protein ubiquitination 100 (10) 0.0358
Merged GO BP GO:0031401~positive regulation of protein modification process 187 (13) 0.0497
Affy500K KEGG hsa04670:Leukocyte transendothelial migration 118 (11) 6.8×10⁻⁴
Affy500K KEGG hsa04722:Neurotrophin signaling pathway 124 (10) 0.0096
Affy500K KEGG hsa05200:Pathways in cancer 328 (15) 0.0133
Affy500K KEGG hsa04530:Tight junction 134 (10) 0.0180
Affy6 KEGG hsa05214:Glioma 63 (6) 0.0026
Affy6 KEGG hsa04912:GnRH signaling pathway 98 (6) 0.0234
MGS GO BP GO:0019882~antigen processing and presentation 83 (6) 0.0422
aMerged denotes all genes of the merged modules from MGS, Affy6 and Affy500K. b
N is total number of genes in the pathway or GO term. X is number of input genes which is mapped to the pathway. Only pathways or GO terms with N<350 were shown.
cFDR is the Benjamini & Hochberg-adjustedP-value. Only pathways or GO terms with FDR<0.05 were shown.
CC: cellular component; BP: biological process.
of the seven genes,MYH9, had been analyzed as a candidate gene for schizophrenia in Japanese population [48], which was a three-stage case-control association study. In the first and second stages, the authors found a potential association ofMYH9with schizophrenia (alle-licP-value = 0.047). In the third stage, however, they could not replicate the result in a larger sample size. In another study conducted in Taiwanese sample,MYH9was found as a vulnera-ble gene for neuropsychological defined subgroups of schizophrenia patients (P-value = 0.0059 with haplotype analysis) [55]. So far, it is still arguable forMYH9about its susceptibility to schizophrenia, especially in Caucasian population. In addition, considering the possible shared genetic variants between SZ and BD, we also investigated how many identified module genes had been reported their susceptibility to BD. One of the results wasMAD1L1gene, which also has been clearly reported its association with SZ by GWAS (P-value<5 × 10⁻⁸) [44–46]. Another interesting gene isITIH1, which hadP-value = 1.03 × 10⁻⁵in Affy500K, and was involved in an overrepresented interaction (ITIH1—TIAM1) in Affy500K modules. Notably, ITIH1,ITIH3andITIH4belong to a family of serine protease and are arranged in the order of ITIH1-ITIH3-ITIH4on chromosome 3p21. Currently, ITIH molecules have been found to play a particularly important role in inflammation [56]. In addition, the regionITIH3-ITIH4 has been identified to be susceptible to schizophrenia by GWAS (P-value = 7.8 × 10⁻⁹) [11]. In the study by Heet al., they found three out of six SNPs they tested within theITIH1-ITIH3 -ITIH4genomic region were significantly associated with SZ in the Han Chinese population (the strongest SNP was rs2710322 with allelicP-Bonferroni = 0.0018) [57]. These lines of evi-dence implied thatIT1H1might be not only associated with BD but also SZ. Among the unre-ported module genes, it is noteworthy thatDGKIgene had geneP-value<0.05 in all datasets
(geneP-value in MGS = 3.4 × 10⁻², in Affy6 = 2.7 × 10⁻³, in Affy500K = 2.17 × 10⁻⁴). In addi-tion, the interactions betweenDGKIandVHLandPSMA6genes (PSMA6—VHL—DGKI)
were overrepresented in Affy500K modules. Actually,DGKIhas been reported to be related with schizophrenia at gene level test (gene-widePmin= 6.7×10⁻⁴) [53].
Among the 238 module genes, there were 155 genes withP-value<0.05 (65%) in any of
MGS, Affy6 or Affy500K dataset. To check theP-values of our 238 module genes in a larger dataset, we calculated the geneP-values in SCZ2. Considering the huge number of SCZ2 SNPs, besides VEGAS, we also used GATES [27] to calculate the geneP-value in parallel. The results were shown inS1 Table. In summary, among all module genes, there were 88 and 61 genes withP-value<0.05 by using VEGAS and GATES respectively, which contained totally 93
genes (39.1%), including several possible candidate genes mentioned above, suchITIH1, DGKI.
As one of the first group of pathways, neurotrophin signaling pathway has been reported to be associated with schizophrenia in several analyses [24,25]. Neurotrophins are a family of tro-phic factors involved in differentiation and survival of neural cells [58]. The dysfunction of neurotrophin signaling pathway can affect axonal outgrowth, axonal guidance and synapse for-mation (from KEGG), which is functionally related with the second group of enriched GO term synaptosome. There is considerable evidence showing that abnormalities of synapse con-nectivity, synaptic transmission and synapse development contribute to the pathogenesis of schizophrenia [59,60], so the enrichment of synaptosome is consistent with previous reports. Another interesting pathway is regulation of protein ubiquitination. The ubiquitin proteasome system has been identified as a canonical pathway associated with several neuropsychiatric
Fig 2. Crosstalk analysis of enriched pathways/GO terms.Panel A shows the connections among the enriched pathways/GO terms. Blue squares are enriched KEGG pathways, green squares are their connected pathways from KEGG, red squares are enriched GO terms. Panel B shows the shared genes between the first group of enriched pathways. Panel C shows the shared genes between four groups of enriched pathways/GO terms. The genes in groups with more than one pathway/GO term were combined for the shared gene analysis.
disorders, including Alzheimer’s [61], Parkinson’s [62] and bipolar disorder [63]. Recently, Mariaet al. have reported the abnormalities of ubiquitination system in schizophrenia by using gene expression analysis [64]. The evidence supported the association of this pathway with schizophrenia. The enrichment of antigen processing and presentation is also consistent with the finding of the association of genes in MHC region with schizophrenia in several GWASs of schizophrenia [11,12]. Meanwhile, the shared gene analysis between different groups of path-ways could reveal some important connected genes.PSMB8andTRAF6, both of which were shared by two groups of pathways and identified by two GWAS datasets separately, were two notable examples.PSMB8encodes proteasome, which cleaves peptides in an ATP/ubiquitin-dependent process in a non-lysosomal pathway [65]. An essential function of a modified proteasome, the immunoproteasome, is the processing of class I MHC peptides [66].TRAF6 encodes TNF receptor-associated factor 6, E3 ubiqutin protein ligase, which functions as a signal transducer in the NF-kappaB pathway that activates IkappaB kinase (IKK) in response to proinflammatory cytokines, and also interacts with ubiquitin conjugating enzymes catalyz-ing the formation of polyubiquitin chains [67]. Thus, these two genes are related with both immune system and protein ubiquitination process and may play important functions in these pathways. In summary, the four groups of enriched pathways/GO terms were potentially asso-ciated with schizophrenia, and crosstalks among them revealed they were connected with each other through some shared genes and basic signaling pathways, which may implement the neu-ral and immune related functions and contribute to the pathogenesis of schizophrenia.
Compared with previous network-based analyses for schizophrenia [21,24,25], our analysis included more GWAS datasets and merged them into three groups according to genotyping platforms. Cross evaluation among three groups at the module level could improve the reliabil-ity of results. In addition, our analysis pipeline used more accurate geneP-value calculation and in-depth functional analysis for the module genes. We also compared our module network with two previous related studies. At the gene level, our module genes shared 12 genes with Jia et. al [21] and eight genes with Yu et. al [24] (the shared genes were shown inS1 Table). At the edge level (protein-protein interaction) our module network only share one edge with Jia et. al [21] (VHL (pp) FN1) and one edge with Yu et. al [24] (SRC (pp) GRB2). However, at the path-way level, our results validated several pathpath-ways enriched by other analyses, such as neurotro-phin signaling pathway by [24] and [25], tight junction by [21] and [24], antigen processing and presentation by [25], which was also validated by another PPI network analysis paper about the top genes of schizophrenia [68]. Furthermore, one of the enriched GO terms of our analysis,“regulation of protein ubiquitination”, was firstly identified by network-based analy-sis, which was also validated by other types of studies [64]. These results would provide new insights and hypothesis for further study. Additional experimental replication and verification are required in future genetic, gene expression and molecular functional studies.
In conclusion, our study suggests that network-based analysis of schizophrenia GWASs is a useful method that could identify new susceptible genes, gene interactions and molecular path-ways for schizophrenia. Our findings emphasize a central role for neural and immune-related pathways in the etiology of schizophrenia, and provide several candidate pathways and genes associated with schizophrenia, which would facilitate the understanding of genetic mechanism of schizophrenia.
Supporting Information
S1 Fig. Workflow of network-based analysis of GWAS data to identify functional modules for schizophrenia.
S2 Fig. The direct network formed by the module genes from DAPPLE.
(PDF)
S1 Table. Annotation for network module involved genes.
(XLSX)
S2 Table. PPI pairs involved in the identified modules for schizophrenia.Number of repeat
denotes how many modules involved the interaction. (XLSX)
Acknowledgments
We extend our gratitude to NIMH for the approval of download of schizophrenia PGC data. We thank all participants who participated in this study.
Author Contributions
Conceived and designed the experiments: SC KF JW. Performed the experiments: SC KF. Ana-lyzed the data: SC KF. Contributed reagents/materials/analysis tools: KZ. Wrote the paper: SC KF JW.
References
1. Tandon R, Keshavan MS, Nasrallah HA. Schizophrenia, "just the facts" what we know in 2008. 2. Epi-demiology and etiology. Schizophr Res. 2008; 102(1–3):1–18. doi:10.1016/j.schres.2008.04.011
PMID:18514488.
2. McGrath J, Saha S, Chant D, Welham J. Schizophrenia: a concise overview of incidence, prevalence, and mortality. Epidemiologic reviews. 2008; 30:67–76. doi:10.1093/epirev/mxn001PMID:18480098.
3. Sullivan PF, Kendler KS, Neale MC. Schizophrenia as a complex trait: evidence from a meta-analysis of twin studies. Archives of general psychiatry. 2003; 60(12):1187–92. doi:10.1001/archpsyc.60.12.
1187PMID:14662550.
4. Manolio TA. Genomewide association studies and assessment of the risk of disease. N Engl J Med. 2010; 363(2):166–76. doi:10.1056/NEJMra0905980PMID:20647212.
5. Hindorff LA, Sethupathy P, Junkins HA, Ramos EM, Mehta JP, Collins FS, et al. Potential etiologic and functional implications of genome-wide association loci for human diseases and traits. Proc Natl Acad Sci U S A. 2009; 106(23):9362–7. doi:10.1073/pnas.0903103106PMID:19474294; PubMed Central
PMCID: PMC2687147.
6. Stefansson H, Ophoff RA, Steinberg S, Andreassen OA, Cichon S, Rujescu D, et al. Common variants conferring risk of schizophrenia. Nature. 2009; 460(7256):744–7. doi:10.1038/nature08186PMID:
19571808; PubMed Central PMCID: PMC3077530.
7. Shi J, Levinson DF, Duan J, Sanders AR, Zheng Y, Pe'er I, et al. Common variants on chromosome 6p22.1 are associated with schizophrenia. Nature. 2009; 460(7256):753–7. Epub 2009/07/03. doi:
nature08192 [pii] doi:10.1038/nature08192PMID:19571809.
8. International Schizophrenia C, Purcell SM, Wray NR, Stone JL, Visscher PM, O'Donovan MC, et al. Common polygenic variation contributes to risk of schizophrenia and bipolar disorder. Nature. 2009; 460(7256):748–52. doi:10.1038/nature08185PMID:19571811.
9. Yue WH, Wang HF, Sun LD, Tang FL, Liu ZH, Zhang HX, et al. Genome-wide association study identi-fies a susceptibility locus for schizophrenia in Han Chinese at 11p11.2. Nat Genet. 2011; 43(12):1228–
31. doi:10.1038/ng.979PMID:22037552.
10. Shi Y, Li Z, Xu Q, Wang T, Li T, Shen J, et al. Common variants on 8p12 and 1q24.2 confer risk of schizophrenia. Nat Genet. 2011; 43(12):1224–7. doi:10.1038/ng.980PMID:22037555.
11. Ripke S, Sanders AR, Kendler KS, Levinson DF, Sklar P, Holmans PA, et al. Genome-wide association study identifies five new schizophrenia loci. Nat Genet. 2011; 43(10):969–76. doi:10.1038/ng.940
PMID:21926974; PubMed Central PMCID: PMC3303194.
13. Wang K, Li M, Hakonarson H. Analysing biological pathways in genome-wide association studies. Nat Rev Genet. 2010; 11(12):843–54. Epub 2010/11/19. doi:10.1038/nrg2884PMID:21085203.
14. Jia P, Wang L, Meltzer HY, Zhao Z. Common variants conferring risk of schizophrenia: a pathway anal-ysis of GWAS data. Schizophr Res. 2010; 122(1–3):38–42. doi:10.1016/j.schres.2010.07.001PMID:
20659789; PubMed Central PMCID: PMC2933424.
15. Zhang K, Zhang L, Zhang W, Wang J. Pathway-based analysisi for genome-wide association studies of schizophrenia to provide new insight in schizophrenia study. Chinese Sci Bull. 2011; 56(32):3398–
402.
16. O'Dushlaine C, Kenny E, Heron E, Donohoe G, Gill M, Morris D, et al. Molecular pathways involved in neuronal cell adhesion and membrane scaffolding contribute to schizophrenia and bipolar disorder sus-ceptibility. Mol Psychiatry. 2011; 16(3):286–92. doi:10.1038/mp.2010.7PMID:20157312.
17. Wang K, Zhang H, Kugathasan S, Annese V, Bradfield JP, Russell RK, et al. Diverse genome-wide association studies associate the IL12/IL23 pathway with Crohn Disease. Am J Hum Genet. 2009; 84 (3):399–405. doi:10.1016/j.ajhg.2009.01.026PMID:19249008; PubMed Central PMCID:
PMC2668006.
18. Eleftherohorinou H, Wright V, Hoggart C, Hartikainen AL, Jarvelin MR, Balding D, et al. Pathway analy-sis of GWAS provides new insights into genetic susceptibility to 3 inflammatory diseases. PLoS One. 2009; 4(11):e8068. doi:10.1371/journal.pone.0008068PMID:19956648; PubMed Central PMCID: PMC2778995.
19. Ideker T, Ozier O, Schwikowski B, Siegel AF. Discovering regulatory and signalling circuits in molecular interaction networks. Bioinformatics. 2002; 18 Suppl 1:S233–40. Epub 2002/08/10. PMID:12169552.
20. Jia P, Zheng S, Long J, Zheng W, Zhao Z. dmGWAS: dense module searching for genome-wide asso-ciation studies in protein-protein interaction networks. Bioinformatics. 2011; 27(1):95–102. Epub 2010/
11/04. doi:10.1093/bioinformatics/btq615PMID:21045073; PubMed Central PMCID: PMC3008643. 21. Jia P, Wang L, Fanous AH, Pato CN, Edwards TL, Zhao Z. Network-assisted investigation of combined
causal signals from genome-wide association studies in schizophrenia. PLoS computational biology. 2012; 8(7):e1002587. Epub 2012/07/14. doi:10.1371/journal.pcbi.1002587PMID:22792057; PubMed Central PMCID: PMC3390381.
22. Pedroso I, Lourdusamy A, Rietschel M, Nothen MM, Cichon S, McGuffin P, et al. Common genetic vari-ants and gene-expression changes associated with bipolar disorder are over-represented in brain sig-naling pathway genes. Biol Psychiatry. 2012; 72(4):311–7. Epub 2012/04/17. doi:10.1016/j.biopsych.
2011.12.031PMID:22502986.
23. International Multiple Sclerosis Genetics C. Network-Based Multiple Sclerosis Pathway Analysis with GWAS Data from 15,000 Cases and 30,000 Controls. Am J Hum Genet. 2013. doi:10.1016/j.ajhg. 2013.04.019PMID:23731539.
24. Yu H, Bi W, Liu C, Zhao Y, Zhang JF, Zhang D, et al. Protein-interaction-network-based analysis for genome-wide association analysis of schizophrenia in Han Chinese population. J Psychiatr Res. 2014; 50:73–8. doi:10.1016/j.jpsychires.2013.11.014PMID:24365204.
25. Jia P, Zhao Z. Searching joint association signals in CATIE schizophrenia genome-wide association studies through a refined integrative network approach. BMC genomics. 2012; 13(Suppl 6):S15. PubMed PMID: doi:10.1186/1471-2164-13-S6-S15PMID:23134571
26. Liu JZ, McRae AF, Nyholt DR, Medland SE, Wray NR, Brown KM, et al. A versatile gene-based test for genome-wide association studies. Am J Hum Genet. 2010; 87(1):139–45. doi:10.1016/j.ajhg.2010.06.
009PMID:20598278; PubMed Central PMCID: PMC2896770.
27. Li MX, Gui HS, Kwan JS, Sham PC. GATES: a rapid and powerful gene-based association test using extended Simes procedure. Am J Hum Genet. 2011; 88(3):283–93. doi:10.1016/j.ajhg.2011.01.019
PMID:21397060; PubMed Central PMCID: PMC3059433.
28. Purcell S, Neale B, Todd-Brown K, Thomas L, Ferreira MA, Bender D, et al. PLINK: a tool set for whole-genome association and population-based linkage analyses. Am J Hum Genet. 2007; 81(3):559–75.
doi:10.1086/519795PMID:17701901; PubMed Central PMCID: PMC1950838.
29. Price AL, Patterson NJ, Plenge RM, Weinblatt ME, Shadick NA, Reich D. Principal components analy-sis corrects for stratification in genome-wide association studies. Nat Genet. 2006; 38(8):904–9. doi:
10.1038/ng1847PMID:16862161.
30. Schizophrenia Working Group of the Psychiatric Genomics C. Biological insights from 108 schizophre-nia-associated genetic loci. Nature. 2014; 511(7510):421–7. doi:10.1038/nature13595PMID:
25056061; PubMed Central PMCID: PMC4112379.
32. Gray KA, Daugherty LC, Gordon SM, Seal RL, Wright MW, Bruford EA. Genenames.org: the HGNC resources in 2013. Nucleic Acids Res. 2013; 41(Database issue):D545–52. doi:10.1093/nar/gks1066
PMID:23161694; PubMed Central PMCID: PMC3531211.
33. Flicek P, Ahmed I, Amode MR, Barrell D, Beal K, Brent S, et al. Ensembl 2013. Nucleic Acids Res. 2013; 41(Database issue):D48–55. doi:10.1093/nar/gks1236PMID:23203987; PubMed Central
PMCID: PMC3531136.
34. Abecasis GR, Auton A, Brooks LD, DePristo MA, Durbin RM, Handsaker RE, et al. An integrated map of genetic variation from 1,092 human genomes. Nature. 2012; 491(7422):56–65. doi:10.1038/
nature11632PMID:23128226; PubMed Central PMCID: PMC3498066.
35. Efron B. Correlated z-values and the accuracy of large-scale statistical estimates. Journal of the Ameri-can Statistical Association. 2010; 105(491):1042–55. doi:10.1198/jasa.2010.tm09129PMID:
21052523; PubMed Central PMCID: PMC2967047.
36. Rossin EJ, Lage K, Raychaudhuri S, Xavier RJ, Tatar D, Benita Y, et al. Proteins encoded in genomic regions associated with immune-mediated disease physically interact and suggest underlying biology. PLoS genetics. 2011; 7(1):e1001273. doi:10.1371/journal.pgen.1001273PMID:21249183; PubMed Central PMCID: PMC3020935.
37. Huang da W, Sherman BT, Lempicki RA. Systematic and integrative analysis of large gene lists using DAVID bioinformatics resources. Nature protocols. 2009; 4(1):44–57. Epub 2009/01/10. doi:10.1038/
nprot.2008.211PMID:19131956.
38. Huang da W, Sherman BT, Lempicki RA. Bioinformatics enrichment tools: paths toward the compre-hensive functional analysis of large gene lists. Nucleic Acids Res. 2009; 37(1):1–13. doi:10.1093/nar/
gkn923PMID:19033363; PubMed Central PMCID: PMC2615629.
39. Ashburner M, Ball CA, Blake JA, Botstein D, Butler H, Cherry JM, et al. Gene ontology: tool for the unifi-cation of biology. The Gene Ontology Consortium. Nat Genet. 2000; 25(1):25–9. doi:10.1038/75556
PMID:10802651; PubMed Central PMCID: PMC3037419.
40. Kanehisa M, Goto S. KEGG: kyoto encyclopedia of genes and genomes. Nucleic Acids Res. 2000; 28 (1):27–30. PMID:10592173; PubMed Central PMCID: PMC102409.
41. Gilman SR, Chang J, Xu B, Bawa TS, Gogos JA, Karayiorgou M, et al. Diverse types of genetic varia-tion converge on funcvaria-tional gene networks involved in schizophrenia. Nature neuroscience. 2012. doi: 10.1038/nn.3261PMID:23143521.
42. Hindorff LA, Sethupathy P, Junkins HA, Ramos EM, Mehta JP, Collins FS, et al. Potential etiologic and functional implications of genome-wide association loci for human diseases and traits. Proceedings of the National Academy of Sciences. 2009; 106(23):9362–7. doi:10.1073/pnas.0903103106
43. Allen NC, Bagade S, McQueen MB, Ioannidis JP, Kavvoura FK, Khoury MJ, et al. Systematic meta-analyses and field synopsis of genetic association studies in schizophrenia: the SzGene database. Nat Genet. 2008; 40(7):827–34. Epub 2008/06/28. doi:10.1038/ng.171PMID:18583979.
44. Cross-Disorder Group of the Psychiatric Genomics C, Genetic Risk Outcome of Psychosis C. Identifi-cation of risk loci with shared effects on five major psychiatric disorders: a genome-wide analysis. Lan-cet. 2013; 381(9875):1371–9. doi:10.1016/S0140-6736(12)62129-1PMID:23453885; PubMed
Central PMCID: PMC3714010.
45. Wang KS, Liu XF, Aragam N. A genome-wide meta-analysis identifies novel loci associated with schizophrenia and bipolar disorder. Schizophr Res. 2010; 124(1–3):192–9. doi:10.1016/j.schres.2010.
09.002PMID:20889312.
46. Bergen SE, O'Dushlaine CT, Ripke S, Lee PH, Ruderfer DM, Akterin S, et al. Genome-wide association study in a Swedish population yields support for greater CNV and MHC involvement in schizophrenia compared with bipolar disorder. Mol Psychiatry. 2012; 17(9):880–6. doi:10.1038/mp.2012.73PMID:
22688191.
47. Olsen L, Hansen T, Jakobsen KD, Djurovic S, Melle I, Agartz I, et al. The estrogen hypothesis of schizo-phrenia implicates glucose metabolism: association study in three independent samples. BMC medical genetics. 2008; 9:39. doi:10.1186/1471-2350-9-39PMID:18460190; PubMed Central PMCID: PMC2391158.
48. Amagane H, Watanabe Y, Kaneko N, Nunokawa A, Muratake T, Ishiguro H, et al. Failure to find an association between myosin heavy chain 9, non-muscle (MYH9) and schizophrenia: a three-stage case-control association study. Schizophr Res. 2010; 118(1–3):106–12. doi:10.1016/j.schres.2010.
01.023PMID:20188514.
49. Choudhury K, McQuillin A, Puri V, Pimm J, Datta S, Thirumalai S, et al. A genetic association study of chromosome 11q22-24 in two different samples implicates the FXYD6 gene, encoding phosphohippo-lin, in susceptibility to schizophrenia. Am J Hum Genet. 2007; 80(4):664–72. doi:10.1086/513475
50. Huang J, Perlis RH, Lee PH, Rush AJ, Fava M, Sachs GS, et al. Cross-disorder genomewide analysis of schizophrenia, bipolar disorder, and depression. Am J Psychiatry. 2010; 167(10):1254–63. Epub
2010/08/18. doi: appi.ajp.2010.09091335 [pii] doi:10.1176/appi.ajp.2010.09091335PMID:20713499. 51. Chang SH, Gao L, Li Z, Zhang WN, Du Y, Wang J. BDgene: A Genetic Database for Bipolar Disorder
and Its Overlap With Schizophrenia and Major Depressive Disorder. Biol Psychiatry. 2013. doi:10. 1016/j.biopsych.2013.04.016PMID:23764453.
52. Kondo K, Ikeda M, Kajio Y, Saito T, Iwayama Y, Aleksic B, et al. Genetic variants on 3q21 and in the Sp8 transcription factor gene (SP8) as susceptibility loci for psychotic disorders: a genetic association study. PLoS One. 2013; 8(8):e70964. doi:10.1371/journal.pone.0070964PMID:23967141; PubMed Central PMCID: PMC3742587.
53. Moskvina V, Craddock N, Holmans P, Nikolov I, Pahwa JS, Green E, et al. Gene-wide analyses of genome-wide association data sets: evidence for multiple common risk alleles for schizophrenia and bipolar disorder and for overlap in genetic risk. Mol Psychiatry. 2009; 14(3):252–60. doi:10.1038/mp.
2008.133PMID:19065143; PubMed Central PMCID: PMC3970088.
54. Prabhu S, Pe'er I. Ultrafast genome-wide scan for SNP-SNP interactions in common complex disease. Genome Res. 2012; 22(11):2230–40. doi:10.1101/gr.137885.112PMID:22767386; PubMed Central
PMCID: PMC3483552.
55. Liu YL, Fann CS, Liu CM, Chen WJ, Wu JY, Hung SI, et al. RASD2, MYH9, and CACNG2 genes at chromosome 22q12 associated with the subgroup of schizophrenia with non-deficit in sustained atten-tion and executive funcatten-tion. Biol Psychiatry. 2008; 64(9):789–96. doi:10.1016/j.biopsych.2008.04.035
PMID:18571626.
56. Opal SM, Artenstein AW, Cristofaro PA, Jhung JW, Palardy JE, Parejo NA, et al. Inter-alpha-inhibitor proteins are endogenous furin inhibitors and provide protection against experimental anthrax intoxica-tion. Infection and immunity. 2005; 73(8):5101–5. doi:10.1128/IAI.73.8.5101–5105.2005PMID:
16041026; PubMed Central PMCID: PMC1201260.
57. He K, Wang Q, Chen J, Li T, Li Z, Li W, et al. ITIH family genes confer risk to schizophrenia and major depressive disorder in the Han Chinese population. Progress in neuro-psychopharmacology & biologi-cal psychiatry. 2014; 51:34–8. doi:10.1016/j.pnpbp.2013.12.004PMID:24389398.
58. de la Rosa EJ, Arribas A, Frade JM, Rodriguez-Tebar A. Role of neurotrophins in the control of neural development: neurotrophin-3 promotes both neuron differentiation and survival of cultured chick retinal cells. Neuroscience. 1994; 58(2):347–52. PMID:8152543.
59. Frankle WG, Lerma J, Laruelle M. The synaptic hypothesis of schizophrenia. Neuron. 2003; 39(2):205–
16. PMID:12873379.
60. Khvotchev M. Schizophrenia and synapse: emerging role of presynaptic fusion machinery. Biol Psychi-atry. 2010; 67(3):197–8. doi:10.1016/j.biopsych.2009.12.007PMID:20103413.
61. Lam YA, Pickart CM, Alban A, Landon M, Jamieson C, Ramage R, et al. Inhibition of the ubiquitin-pro-teasome system in Alzheimer's disease. Proc Natl Acad Sci U S A. 2000; 97(18):9902–6. doi:10.1073/
pnas.170173897PMID:10944193; PubMed Central PMCID: PMC27620.
62. Shimura H, Schlossmacher MG, Hattori N, Frosch MP, Trockenbacher A, Schneider R, et al. Ubiquiti-nation of a new form of alpha-synuclein by parkin from human brain: implications for Parkinson's dis-ease. Science. 2001; 293(5528):263–9. doi:10.1126/science.1060627PMID:11431533.
63. Bousman CA, Chana G, Glatt SJ, Chandler SD, Lucero GR, Tatro E, et al. Preliminary evidence of ubi-quitin proteasome system dysregulation in schizophrenia and bipolar disorder: convergent pathway analysis findings from two independent samples. Am J Med Genet B Neuropsychiatr Genet. 2010; 153B(2):494–502. doi:10.1002/ajmg.b.31006PMID:19582768.
64. Rubio MD, Wood K, Haroutunian V, Meador-Woodruff JH. Dysfunction of the ubiquitin proteasome and ubiquitin-like systems in schizophrenia. Neuropsychopharmacology: official publication of the American College of Neuropsychopharmacology. 2013; 38(10):1910–20. doi:10.1038/npp.2013.84PMID:
23571678; PubMed Central PMCID: PMC3746696.
65. Lecker SH, Goldberg AL, Mitch WE. Protein degradation by the ubiquitin-proteasome pathway in nor-mal and disease states. Journal of the American Society of Nephrology: JASN. 2006; 17(7):1807–19.
doi:10.1681/ASN.2006010083PMID:16738015.
66. Basler M, Kirk CJ, Groettrup M. The immunoproteasome in antigen processing and other immunologi-cal functions. Current opinion in immunology. 2013; 25(1):74–80. doi:10.1016/j.coi.2012.11.004PMID:
23219269.
67. Chung JY, Lu M, Yin Q, Lin SC, Wu H. Molecular basis for the unique specificity of TRAF6. Advances in experimental medicine and biology. 2007; 597:122–30. doi:10.1007/978-0-387-70630-6_10PMID:
17633022.
Molecular Networks and Enrichment of Nucleosome (Chromatin) Assembly Genes in Schizophrenia Susceptibility Loci. Schizophrenia bulletin. 2013. doi:10.1093/schbul/sbt066PMID:23671194. 69. Consortium W. Genome-wide association study of 14,000 cases of seven common diseases and 3,000
shared controls. Nature. 2007; 447:661–78. PubMed PMID: doi:10.1038/nature05911PMID: