Experiments with mathematical models
to simulate hepatitis A population dynamics
under different levels of endemicity
Modelagem matemática para simular a dinâmica
populacional da hepatite A de acordo
com diferentes níveis de endemicidade
1 Instituto de Ciências Biológicas, Universidade de Pernambuco, Recife, Brasil. 2 Programa de Computação Científica, Fundação Oswaldo Cruz, Rio de Janeiro, Brasil.
Correspondence
C. T. Codeço
Programa de Computação Científica, Fundação Oswaldo Cruz. Av. Brasil 4365, Rio de Janeiro, RJ 21045-900, Brasil. [email protected]. fiocruz.br
Mariana Alves de Guimaraens 1 Cláudia Torres Codeço 2
Abstract
Heterogeneous access to sanitation services is a characteristic of communities in Brazil. This heterogeneity leads to different patterns of he-patitis A endemicity: areas with low infection rates have higher probability of outbreaks, and areas with higher infection rates have high prevalence and low risk of outbreaks. Here we develop a mathematical model to study the ef-fect of variable exposure to inef-fection on the epi-demiological dynamics of hepatitis A. Differen-tial equations were used to simulate population dynamics and were numerically solved using the software Stella™. The model uses parame-ters from serological surveys in the Greater Met-ropolitan Rio de Janeiro, in areas with different sanitation conditions. Computer simulation ex-periments show that the range of infection rates observed in these communities are characteris-tic of high and low levels of hepatitis A endemic-ity. We also found that the functional relation-ship between sanitation and exposure to infec-tion is an important component of the model. The analysis of the public health impact of par-tial sanitation requires a better understanding of this relationship.
Hepatitis A; Mathematical Models; Populations Dynamics
Introduction
Brazil is a very large and heterogeneous coun-try. Szwarcwald et al. 1describe the existence
of two Brazils, one characterized by adequate access to sanitation and health services and another Brazil with poor access to such ser-vices. These two Brazils are intertwined on all geographic scales. At the national scale, half of the population has adequate access to sewage disposal, while the other half must dispose of their sewage very rudimentarily. This pattern is repeated on smaller scales. Even in Greater Metropolitan Rio de Janeiro, only 63% of the population has access to sewage disposal ser-vices. Moreover, communities with adequate sanitation services and those with poor access live side by side 2.
Hepatitis A is a viral disease transmitted from person to person mainly by the fecal-oral route. Worldwide, there are three major pat-terns of hepatitis A epidemiology 3. In areas
propor-tion children and adolescents susceptible to the hepatitis A virus, because part of the popu-lation has access to adequate sewage disposal and water supply, which lower the risk of ac-quiring hepatitis A during childhood. In these areas, there are outbreaks of hepatitis A in ado-lescent and adults populations, which may represent a significant public health burden because infection is more virulent in this age class. The third pattern is observed in regions of low disease endemicity, where risk of acquir-ing the infection is very low.
In Latin America and some other areas of the developing world, the epidemiological pat-tern of hepatitis A is changing from highly en-demic to intermediate 4,5. Infection rates are
de-creasing in children and inde-creasing in teenagers and adults. This shift is not uniform, however, and varies between rural and urban areas and among social classes. These variations reflect underlying differences in local quality of life. In Brazil, a similar change has been observed. Age at infection has been shifting towards older age groups 6. Clemens et al. 7surveyed the
hepati-tis A seroprevalence in four metropolitan areas of Brazil. In Rio de Janeiro, they found that seropositivity at age 10 is some 50% in the low-er social class and some 28% in the intlow-ermedi- intermedi-ate plus higher social classes. In Fortaleza, Cea-rá, more than 90% of children are seropositive at age 10 in the lower social classes; in the oth-er classes, soth-eroprevalence at age 10 does not reach 25%. These numbers suggest the exis-tence of areas of high and intermediate en-demicity in Brazil. According to serological sur-veys in Rio de Janeiro, hepatitis A seropreva-lence is higher in low-income populations 8,9.
Risk of infection is associated with crowding and poor hygienic conditions in the domestic and social environment 10.
Intermediate hepatitis A endemicity poses a public health paradox. The gradual improve-ment of hygiene reduces but does not eliminate hepatitis A transmission. Since sanitation im-provement is not uniform, viral circulation re-mains high in some sectors, and part of the pop-ulation reaches adulthood without being infect-ed. While the infection is mild or asymptomatic in children (and can be mistaken for a flu infec-tion), in adults it is more virulent. This implies that investment in sanitation may have an ini-tially negative impact on hepatitis A epidemiol-ogy. Another important factor that should be considered when studying hepatitis A dynamics is that seasonal variation in the infection rate is strongly associated with the rainfall pattern 11.
Several studies on hepatitis A epidemiology show that more research is needed on infection
dynamics in order to establish more efficient vaccination programs 4,11. In this study, we
de-veloped a mathematical model to describe the dynamics of hepatitis A transmission and eval-uated it considering different levels of exposure to the disease. The modeling approach consists of developing a mathematical description of the sequence of events related to transmission and subsequent simulation of the dynamics. Mathematical models are useful tools for test-ing hypotheses on the system 12and design
and control strategies, helping to define when, who, and how to vaccinate, for example 13.
Mathematical models of diseases transmitted by the fecal-oral route, like hepatitis A, cholera, and typhoid fever, have been developed in lit-erature aimed at evaluating the cost-benefit of alternative control strategies, like sanitation versus vaccination of risk groups 14,15,16,17,18.
Model
The first set of simulations were performed with equations adapted from Brow & Rothery
19. This is a simpler model that does not
explic-itly include the population growth and mortal-ity rates. Since the model without demograph-ics does not allow persistence, we opted for a more complex model, adapted from Deangelis & Gross 20(equation 1). This is the well-known
SIR model, originally developed by Kermack & McKendrick 21. The equations were
numerical-ly solved using the StellaTMsoftware.
dS(t) = µN - mS(t) - c
βI(t) S(t) dt
dI(t)
= c βS(t) I(t) - (m + γ) I(t) (1)
dt
dR(t)
= γI(t) - mR(t) dt
person will actually get an infection after a po-tentially infective contact. Once infected, the individual leaves class S to class I. Individuals recover from infection at rate (γ= 1/30day-1)
(recovery rate is the inverse of the average in-fectious period) 22. Viral fecal excretion is
de-tected from the incubation phase to early symp-tomatic phase of the disease, during approxi-mately 10 days 23.
Birth and death rates were parameterized using data from the Greater Rio de Janeiro Met-ropolitan Area, as measured in 2000 (Instituto Brasileiro de Geografia e Estatística. Censo De-mográfico 2000. http://www.ibge.gov.br). De-mographic process is modeled in a simple way.
µN new individuals are born in the population per day and enter into the susceptible class, where µis the per capita birth rate and N is the number of individuals in the population. Indi-viduals in any class die at rate m.
Struchiner et al. 8estimated the incidence
rate of hepatitis A in three localities in Rio de Janeiro, characterized by different access to sanitation facilities. They estimated incidence as a function of age by fitting a Weibull survival curve to age-specific seroprevalence data. Av-eraging through all ages, they found a force of infection (hazard rate) equal to 0.0001 year-1or
0.27e-6 day-1. These values are used to
parame-terize the infection rate in our model (Table 1). We also included the effect of vaccination, re-moving individuals from the S to the R class.
To evaluate the amount of sanitation re-quired to prevent further spread of hepatitis A, we modified the model considering different assumptions for the functional relationship be-tween sanitation and contact rate:
dS(t) = (1 -
ν)µN - mS(t) - c(H) βI(t) S(t) dt
dI(t) = c(H)
βS(t) I(t) - (m + γ) I(t) (2)
dt
dR(t)
= νγI(t) - mR(t) dt
where νis the proportion of individuals vacci-nated and H is the sanitation level of the com-munity. The function c(H)describes the effect of sanitation on the contact rate. It is reasonable to assume that the number of infectious contacts decreases as sanitation increases. It is not clear, however, which function should be used to mod-el the rmod-elationship between contact rate and san-itation level.Here, we used three alternative functions (Figure 1), where cmaxis the maximum
contact rate and alphas are constants:
c(H) = cmax- α1H (3)
c(H) = cmaxe -α2H (4)
c(H) = cmax (3)
1 + e α3 (H- H50)
The linear function (equation 3) predicts that contact is reduced proportionally to the improvement of sanitation conditions. This is reasonable, if contact with fellow household members is the main mode of transmission. The exponential function (equation 4) says that a small improvement in hygiene causes great impact on contact reduction. This may be reasonable in a setting where individuals share
Table 1
Parameters used in model simulations. Values chosen for infection rates are within the range of values estimated by Struchiner et al. 8for microregions in Rio de Janeiro, Brazil, birth rates (day-1) were 5.3 e -5.
Simulation Infection rates (day-1) Mortality rates (day-1)
1 1.05e-3 8e-6
2 1e-3 8e-6
3 1.7e-4 5e-7
4 4.7e-5 1.5e-4
5 5.2e-5 1.5e-4
6 5.2e-5 3.3e-7
7 6.3e-5 3.3e-7
8 5.8e-5 8.2e-7
9 6.9e-5 5.4e-6
the same source of contamination. The third option is a sigmoidal curve (equation 5), ap-plicable to a situation where sanitation has a small effect when low and its effect increases as it is expanded.
Results
Without intervention
We begin by describing the temporal dynamics of hepatitis A, according to equation 1. If enough time is given, the system reaches a positive equilibrium:
S* = m + γ cb
I* = µN(t) - m (3)
m + γ cb
R* = N(t) - I* - S*
In this equilibrium, the relationship be-tween contact rate and HA seroprevalence is nonlinear (Figure 2). In a community with 1,000 individuals, 50% seroprevalence is ex-pected when the contact rate of ca. 0.0002 (i.e., 2 contacts per person per 10 days).
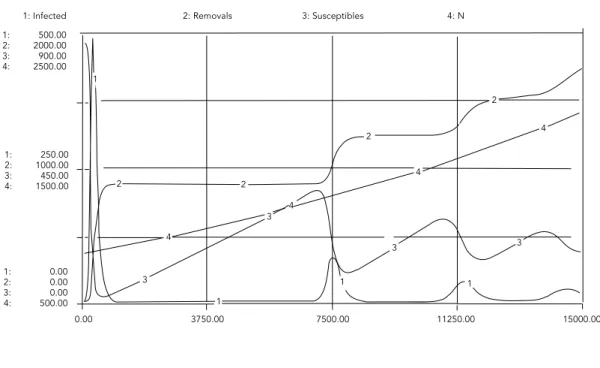
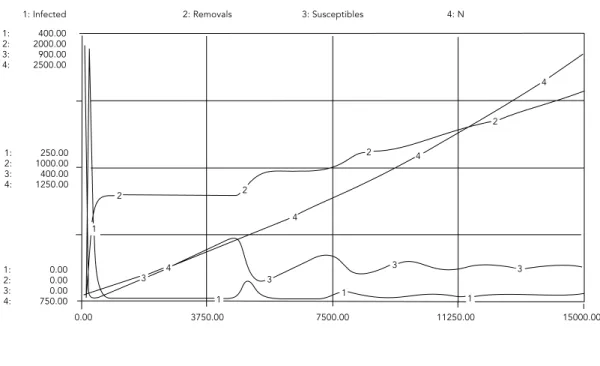
When equation system (equation 1) is solved numerically for different values of infection
rate (Table 1), two kinds of results are obtained: either infection persists at a low level in the community and no outbreaks are observed (af-ter the initial transient) or a chain of outbreaks are expected before the infected population settles to its equilibrium (Figures 3 and 4). These results suggest that the communities repre-sented by the values in Table 1 experience dif-ferent levels of endemicity.
With intervention
The ultimate goal of a public health strategy is to change the transmission dynamics of a dis-ease in such a way that if an infected individual arrives in a community, he will not trigger an epidemic. Mathematically, this means dI < 0.
dt
For hepatitis A, intervention can act in two ways: reducing the number of susceptible indi-viduals (S) by vaccination; or reducing the rate of contact (c) by sanitation. From equation sys-tem 1, we find that dI < 0 implies that
dt
c < m + γ (4)
βS
Model 2 introduces three possible expressions for the relationship between the contact rate and H, the proportion of individuals with ac-cess to adequate sanitation facilities. Using these functions, we can define the level of H re-quired to prevent HA outbreaks.
H < 1 (cmax- m + γ
) (5)
α1 βS
for the linear model
H < 1 1n
m + γ
(6)α2 cmaxβS
for the exponential model
H < 1 1n (cmaxβS -1) + H
50 (7)
α3 m + γ
for the sigmoidal model
Discussion
Our simulations suggest that the infection rates measured in Rio de Janeiro 8are
charac-teristic of high and low endemicity patterns. The impact of partial sanitation on these com-munities will depend on the functional rela-tionship between sanitation and its effect on exposure to infection. If this relationship is lin-ear, impact of sanitation is inversely related to
Figure 1
Hepatitis A seroprevalence (P) as a function of the infection rate (cb). Curve derived from model 2, equation 5.
0.0
c (contact rate)
0.1 0.2 0.3 0.4 0.5 0.6 0.7 0.8 0.9 1.0
1.0 H (sanitation level) 0.9
0.8 0.7 0.6 0.5 0.4 0.3 0.2 0.1 0.0
I
II
the number of susceptible individuals. That is, in a large population, partial sanitation would be hardly effective (it is either all or nothing). If this relationship is exponential, the impact of sanitation is inversely related to the log S. If this is the case, partial sanitation is expected to be a public health improvement. If the rela-tionship is sigmoid, improvement is achieved only if sanitation crosses a threshold H50.
It is not clear which one of these functional relationships is more appropriate. They actual-ly represent different situations that may take place at different places. The important point is that the impact of sanitation is sensitive to this function and more attention should be de-voted to the understanding of the relationship between sanitation and contact.
Mathematical models are useful tools for the development of control strategies. In this work, we present a simple model for hepatitis A. This model is based on the classical SIR model. Further developments of this model should include spatial heterogeneity in contact rate and age-dependent force of infection. Al-though many seroepidemiological surveys have been conducted in Brazil as a whole and Rio de Janeiro, we still know very little about the population dynamics of hepatitis A in Brazilian populations. To be able to build a more detailed model, further information is re-quired on the patterns of contact in the popu-lation (stratified by age, social class, and locali-ty), identification of main sources of disease transmission (direct contact x recreational contact x sanitation x water availability).
Figure 2
Three candidates for the relationship between sanitation level (proportion of individuals with access to sanitation services) and contact rate with sources of infection. Curves I, II, and III correspond to equations 3, 4, and 5, respectively.
P 0.0 0.2 0.4 0.6 0.8 1.0
0.001 cb 0.0008
0.0006 0.0004
1: Infected 1: 500.00 2: 2000.00 3: 900.00 4: 2500.00
1: 250.00 2: 1000.00 3: 450.00 4: 1500.00
1: 0.00 2: 0.00 3: 0.00 4: 500.00
2: Removals 3: Susceptibles 4: N
3750.00
0.00 7500.00 11250.00 15000.00
1
1 1 1
2 2
2
3
3 4
4
4
4 2
3 3
Figure 3
Hepatitis A epidemiology of age class 1 to 4.
Figure 3b
Microregion 111 ages 1 to 4 (simulation 2). Figure 3a
Microregion 9 (simulation 1).
1: Infected 1: 500.00 2: 2000.00 3: 900.00 4: 2500.00
1: 250.00 2: 1000.00 3: 450.00 4: 1500.00
1: 0.00 2: 0.00 3: 0.00 4: 500.00
2: Removals 3: Susceptibles 4: N
3750.00
0.00 7500.00 11250.00 15000.00
4
4
4
4
3 3
3
3
2 2
2
2
1
1 1
1
1: Infected 1: 700.00 2: 2000.00 3: 800.00 4: 1750.00
1: 350.00 2: 1000.00 3: 400.00 4: 1250.00
1: 0.00 2: 0.00 3: 0.00 4: 750.00
2: Removals 3: Susceptibles 4: N
3750.00
0.00 7500.00 11250.00 15000.00
1
1 1 1
2
2
2
3 3
4
4
4
4 2
3 3
Figure 4
Hepatitis A epidemiology of ages class 15 to 19.
Figure 4b
Microregion 111 ages 15 to 19 (simulation 6). Figure 4a
Microregion 9 (simulation 7).
1: Infected 1: 400.00 2: 2000.00 3: 900.00 4: 2500.00
1: 250.00 2: 1000.00 3: 400.00 4: 1250.00
1: 0.00 2: 0.00 3: 0.00 4: 750.00
2: Removals 3: Susceptibles 4: N
3750.00
0.00 7500.00 11250.00 15000.00
4
4
4
4
3 3
3 3
2 2
2
2
1 1 1
1
References
1. Szwarcwald CL, Leal MC, Castilho EA. Infant mor-tality rate in Brazil: Belgium-India or Bulgaria? Cad Saúde Pública 1997; 13:503-16.
2. Leal MC, Szwarcwald CL. Características da mor-talidade neonatal no Estado do Rio de Janeiro na década de 80: uma visão espaço-temporal. Cad Saúde Pública 1997; 31:457-65.
3. Gust ID. Epidemiological patterns of hepatitis A in different parts of the world. Vaccine 1992; 10 Suppl 1:S56-8.
4. Tufenkeji H. Hepatitis A in Middle East and Africa. Vaccine 2000; 18:S65-7.
5. Tanaka J. Hepatitis A shifting epidemiology in Latin America. Vaccine 2000; 18:S57-60.
6. Vitral CL, Yoshida CFT, Lemos ERS, Teixeira CS, Gaspar AMC. Age-specific prevalence of antibod-ies to hepatitis A in children and adolescents from Rio de Janeiro, Brazil, 1978 and 1995. Mem Inst Oswaldo Cruz 1998; 93:1-5.
7. Clemens SA, Fonseca JC, Azevedo T, Cavalcanti A, Silveira TR, Castilho MC, et al. Soroprevalência para hepatite A e hepatite B em quatro centros no Brasil. Rev Soc Bras Med Trop 2000; 33:1-10. 8. Struchiner CJ, Almeida LM, Azevedo RS, Massad
E. Hepatitis A incidence rate estimates from a pi-lot survey in Rio de Janeiro, Brazil. Int J Epidemi-ol 1999; 28:776-81.
9. Saback FL, Sabino RR, Carvalho SMF, Amorin LM, Gaspar AMC, Oliveira MLA, et al. Infection with Hepatitis A and TT viruses and socioeconomic status in Rio de Janeiro, Brazil. Scand J Infect Dis 2001; 33:121-5.
10. Almeida LM, Werneck GL, Cairncross S, Coeli CM, Costa MCE, Coletty PE. The epidemiology of he-patitis A in Rio de Janeiro: environmental and do-mestic risk factors. Epidemiol Infec 2001; 127: 327-33.
11. Santos DMS, Souto FJD, Santos DRL, Vitral CL, Gaspar AMC. Seroepidemiological markers of en-terically transmitted viral hepatitis A and E in in-dividuals in a community located in the North area of Rio de Janeiro, RJ, Brazil. Mem Inst Oswal-do Cruz 2002; 97:637-40.
12. Guimaraens MA. The influence of environmental factors on the seasonal dynamics of Ulvasp. and
Sargassum sp. in the Cabo Frio upwelling region of Brazil [Ph.D. Thesis]. Miami: University of Mia-mi; 2000.
13. Struchiner CJ, Brunet RC, Halloran ME, Massad E, Azevedo Neto RS. On the use of state-space models for the evaluation of health interventions. Journal of Biological Systems, 1995; 3:851-65. 14. Sundaresan TK, Grab B, Uemura K, Cvjetanovic B.
Comparative epidemiological analysis of sanita-tion and immunizasanita-tion in the control of typhoid and cholera. Am J Public Health 1974; 64:910-2. 15. Cvjetanovic B, Grab B, Uemura K. Dynamics of
acute bacterial diseases. Epidemiological models and their application in public health. Part II Epidemiological models of acute bacterial dis-eases. Bull World Health Organ 1978; 56 Suppl 1:25-143.
16. Gay NJ. A model of long-term decline in the trans-missibility of an infectious disease: implications
Acknowledgements
This research was supported by the Oswaldo Cruz Foundation, Carlos Chagas Filho Rio de Janeiro State Research Support Foundation, grant number 15254501.
Contributors
M. A. Guimaraens conducted the programming and testing of simulations with the model using the StellaTMprogram and calculated the model’s
parame-ters using the literature, with the assistance of C. T. Codeço. Meanwhile C. T. Codeço performed the theo-retical analysis of the model, including the interven-tion procedure. Both authors conducted the litera-ture research and discussed the drafting of the intro-duction, formulation of the model, and final remarks.
Resumo
Acesso heterogêneo a serviços sanitários é uma carac-terística de comunidades brasileiras. Essa heterogenei-dade promove diferentes níveis de exposição ao vírus da hepatite A, resultando em padrões variados de en-demicidade: áreas com taxas altas de infecção pos-suem tendência para ocorrência de endemismo, en-quanto taxas de infecção baixas mostram tendência para surtos. Neste trabalho, apresentamos um modelo matemático desenvolvido para estudar o efeito do risco variado de exposição na dinâmica epidemiológi-ca da hepatite A. Equações diferenciais foram usadas para simular a dinâmica populacional e sua solução numérica obtida usando-se o programa Stella®. O modelo usa parâmetros de infecção obtidos de estudos realizados na Região Metropolitana do Rio de Janeiro, em áreas com diferentes condições sanitárias. Simu-lações mostram que a amplitude observada de valores de taxa de infecção compreende dinâmicas de alta e baixa endemicidades de hepatite A. Observamos que a relação funcional entre saneamento e exposição à in-fecção é um componente importante do modelo. A análise do impacto do saneamento parcial requer uma maior compreensão desta relação.
for the incidence of hepatitis A. Int J Epidemiol 1996; 25:854-61.
17. Ranchov GK. An epidemiometric model of viral hepatitis A and its use. Zh Mikrobiol Epidemiol Immunobiol 1996; 2:36-9.
18. Codeço CT. Endemic and epidemic dynamics of cholera: the role of the aquatic reservoir. BMC In-fectious Diseases 2001; 1. http://www.biomed-central.com/1471-2334/1/1.
19. Brown D, Rothery P. Models in biology: mathe-matics, statistics and computing. Chichester/ New York: John Wiley & Sons; 1993.
20. Deangelis DL, Gross LJ. Individual-based models and approaches in ecology: populations, com-munities and ecosystems. New York: Chapman & Hall; 1992.
21. Kermack WO, McKendrick. A contribution to the mathematical theory of epidemics. Proceedings Royal Statistics Society 1927; 115:700-21. 22. Plotkin AS, Orenstein WA. Vaccines. Philadelphia:
W. B. Saunders; 1999.
23. Ciocca M. Clinical course and consequences of he-patitis A infection. Vaccine 2000; 18 Suppl 1:S71-4. Submitted on 26/May/2003