Methods to Identify the Anaerobic Threshold for Type-2 Diabetic and
Non-Diabetic Subjects
Herbert G. Simões
1, Sérgio R. Moreira
1, Robert J. Moffatt
2, Carmen S. G. Campbell
1 Universidade Católica de Brasília (UCB)1, Brasília DF – Brazil; Florida State University (FSU)2, Tallahassee FL – EUAAbstract
Background: In spite of Anaerobic Threshold (AT) to be widely used on exercise evaluation for different populations, there are few studies comparing methods to identify AT for individuals with type- diabetes.
Objective: To compare methods of AT determination on type- diabetics (TD) and non-diabetic (ND) subjects and verify the acid-base balance as related to AT intensity.
Methods: TD (n=0; 54.5±9.5 yr; 0.±5.0 kg/m) and younger ND (n=0; 6.6±.8 yr; .9±5.0 kg/m) performed
an incremental test (IT) on a cycle ergometer. The over-proportional increase in VE/VO and blood lactate ([lac]) identified the ventilatory (VT) and lactate thresholds (LT) respectively. The workload corresponding to the lower blood glucose ([gluc]) during test identified the individual glucose threshold (IGT). The AT was also determined by polynomial adjustment of the VE/Workload and [lac]/Workload responses to identify exercise intensities above which an over-proportional increase in VE and [lac] did occur and were named VTVE/W and LT[lac]/W.
Results: The workload (Watts-W) corresponding to LT, VT, IGT, LTLac/W and VTVE/W of diabetics (85.0±.; 88.0±.7; 86.0±.8; 8.0±0.9 and 90.±.W) and non-diabetics (9.0±9.0; .0±4.7; 40.8±6.4; .7±44. and .0±9.W) differed between groups (p<0.00), but not within groups. Thus it was evidenced an agreement among the studied methods. The pH and pCO were significantly decreased in parallel to the increase in [lac], pO and VE at
supra AT intensities.
Conclusion: The AT intensities, as determined by different methods both for diabetics and non-diabetic individuals, were in agreement to each other and identified exercise intensities above which the acid-basic balance is disrupted. (Arq Bras Cardiol 00; 94() : 67-7)
Key words: Anaerobic threshold; clinical protocols; blood glucose; acid-basic equilibrium.
Mailing address: Herbert G. Simões •
Universidade Católica de Brasília – UCB - EPTC, QS07, LT1 s/n. Bloco G Sala 116 - 72030-170 Águas Claras, Brasília, DF - Brazil
E-mail: [email protected]
Manuscript received September 16, 2008; revised manuscript received November 03, 2008; accepted November 03, 2008.
Introduction
The anaerobic threshold (AT) reflects an exercise intensity above which an over-proportional increase in glycolysis rate, blood lactate ([lac]) and ventilation (VE) is observed paralleled to the pH diminution1,2.
The invasive determination of AT from [lac] responses (lactate threshold – LT) has been considered a gold standard to evaluate aerobic capacity3-5, while the AT identification
from VE responses (ventilatory threshold – VT) has advantages due its noninvasive nature and has been recommended for exercise prescription for special populations5-8 including
diabetics7,9-14. However, the VT determination requires
expensive equipment and measurements are quite dependent on calibration methods before testing. Moreover, usually two or more experienced physicians are often needed to identify the intensity at which AT occurs15,16. On the other hand, the
mathematical modeling of VE responses to incremental tests through polynomial function would increase the accuracy of AT identification.
Additionally, during the incremental test (IT), the blood glucose ([gluc]) was shown to decrease until AT was reached and the exercise intensity above which the [gluc] recommences to increase was named Individual Glucose Threshold (IGT)17.
The IGT seems to demarcate an exercise intensity above which blood glucose output overcomes its uptake and it is not different from the VT and LT identified in young health individuals2.
Type 2 diabetes has been associated to skeletal muscle lipid accumulation, which inhibits insulin signaling and thus decreases GLUT-4 translocation, resulting in hyperglycemia18.
So, a more practical method for AT identification (e.g. IGT) and/or a non-invasive and less expensive procedure (e.g. VT identified through VE/Workload ratio) would be useful for exercise prescription to prevent skeletal muscle lipid accumulation and to control blood glucose in type 2 diabetics and non-diabetic individuals. However, the AT identification through blood glucose responses, as well as the utilization of a non-invasive and simple AT determination through the modeling of the VE/Workload responses, have not yet been investigated in diabetics.
Table 1 – Characteristics of the type 2 diabetics and non-diabetic participants
Age (yr)
BMI (kg.m2(-1))
Fat mass (%)
VO2 max
(ml.kg.min-1)
Fasting Blood
Glucose (mM) SBP (mmHg) DBP (mmHg)
Diabetics (n=10) 54.5 (9.5) 30.1 (5.0) 27.4 (9.3) 23.3 (6.7) 10.4 (3.2) 135.2 (17.6) 84.3 (7.5) No diabetcs (n=10)
36.6 †
(12.8) 23.9† (1.7) 17.1† (5.2) 42.4‡ (8.1) 4.6† (0.6) 117.9* (11.3) 73.8* (11.1)
* p<0.05; † p<0.01; ‡ p<0.001 in relation to type-2 diabetics.
polynomial function on the responses of VE/workload and [lac]/workload ratio during incremental test on a cycle ergometer was analyzed. The results were compared to other methods of AT determination and the pH, pO2 and pCO2 responses in relation to the identified AT intensities were analyzed to clarify the significance of AT identified through [gluc], VE/Workload and [lac]/Workload ratio.
Methods
Subjects
The University Ethics Committee for Human Research approved the methods used in this study. After completing the written informed consent procedure, 12 sedentary type 2 diabetics and 10 physically-active non-diabetic individuals volunteered for this investigation. Data from 10 of the 12 diabetics are presented, as it was not possible to identify all parameters of interest in 2 of them. Descriptive characteristics of the participants are presented in Table 1. The non-diabetic subjects have been involved in recreational training programs for the last 2 years (e.g. cycling and resistance training), consisting of at least 20 minutes of exercise 3 times/week on a regular basis, while the diabetic participants were sedentary. Additionally, the diabetics kept their oral hypoglycemic treatment (e.g. sulphonylureas, biguanides, alpha-glucosidase inhibitors) during the study.
Procedures
Data collection was performed at the Exercise Physiology Laboratory of the Catholic University of Brasília and at Florida State University. Participants were previously submitted to a cardiovascular examination, including resting electrocardiogram and blood pressure measurements (Microlife, England). Participants with cardiovascular, neurological or orthopedic complications were excluded. The selected subjects performed an incremental exercise test on an electromagnetic cycle ergometer (Lode Excalibur, Netherland) in an overnight fasting state between 8:30 and 9:30 am at a room with a temperature of 22-23° C, 665 mmHg of barometric pressure and 50% of humidity.
Incremental exercise test (IT)
An IT was applied to identify the LT, the VT, the IGT and the VO2max. A 1-min warm-up while pedaling at 0 Watts was
performed before starting with a workload of 15 to 50 Watts. Then the workload was increased every 3-mins by 15-25 Watts according to the participant’s life style and physical fitness.
For most participants (including all diabetics) the test initiated at 15 Watts with increments of 15 Watts at each 3-min stage. Work was terminated due to voluntary exhaustion or if any electrocardiographic abnormality was observed. Also, criteria for stopping the test included reaching an over-proportional increase in systolic blood pressure (SBP) and/or a diastolic blood pressure (DBP) over 115 mmHg, a failure to increase the oxygen pulse paralleled to the increase in the workload and/or a respiratory exchange ratio over 1.157,19.
Ventilatory measurement
Respiratory gas was measured continuously using either a Parvomedics MMS-2400 system (Florida State University) or the Cortex Metalyzer 3B system (Catholic University of Brasilia). Both the gas calibration and a flow meter calibration took place before every test. The results obtained from the last 20 seconds of each stage were considered for the identification of the minute ventilation (VE), oxygen consumption (VO2), carbon dioxide production (VCO2), respiratory exchange ratio (RER) and VT. The highest VO2 obtained at the voluntary
exhaustion was considered VO2peak.
Blood collection and laboratory analyses
During the last 10-sec of each stage, a 25-μl sample was collected from the ear lobe using heparinized and calibrated microcapillaries for [lac] and [gluc] measurements for all participants. A 75-μl sample of blood was also collected from 5 non-diabetics at rest, in the middle of the incremental test (usually at the end of stages 3 to 5; around the AT) and immediately at the conclusion of the test.
The 25ul were transferred into Eppendorf tubes containing 50μl of Sodium Fluoride (NaF) 1%. The [lac] and [gluc] were determined from each sample in duplicate by using a blood lactate and glucose analyzer (Yellow Springs 2700S). The [lac] and [gluc] results were corrected by the volume of the blood sampled within the Eppendorf tubes and are presented in mM. The pO2 and pCO2 (mmHg), the Base Excess - BE (mM) and pH were measured at the 75-μl sample using the AVL system (Blood Gas Analyzer – OMNI 3 Modular Analyzer, AVL Scientific Corporation, Roswell, GA).
Anaerobic threshold identiication
The LT was identified by the [lac] breakpoint, while the IGT was determined by [gluc] kinetics and was defined as the exercise intensity at which the [gluc] began to increase during the IT17. The VT was identified by two independent
a parallel increase in the VE/VCO2 1,20. If the VT could not
be identified by VE/VO2 and VE/VCO2 responses, the VT was identified considering the breakpoint in the VCO2-VO2
relationship (Figure 1).
In addition, the VE/workload and the [lac]/workload ratios were plotted against the workload for each participant during IT. The results were modeled through a second-order polynomial function and the originated equation was derived in order to determine an exercise intensity above which an over-proportional increase in both VE and [lac] in relation to workload did occur. The AT identification though these mathematical approaches were named respectively VTVE/W and
LT[lac]/W. The identification of the VTVE/W and LT[lac]/W for a single diabetic participant is presented in Figure 2 (a-b).
Statistical treatment and procedures for comparison
Data are presented as mean and standard deviation (SD). The mean results of IT for all participants are presented at the “1st
stage” (first stage of incremental test – “Beg”), “Mid1” (midpoint between 1st stage and AT), “TRANS” (either the VT, IGT or LT
workloads), “Mid2” (midpoint between the AT and the last stage/exhaustion) and the “End” (last stage/exhaustion moment). Comparison between AT identified by different methods was performed by one-way ANOVA with the Tukey-Kramer as a post hoc. A unpaired t-tes was applied for comparisons between groups for correspondent variables .The associations among variables were determined by Pearson’s moment correlation. Also, the agreement between AT intensity identified by blood lactate, which was set as the gold standard, and the AT identified by other methods in the present study were assessed by the Bland and Altman technique21. The level of significance was set
at P<0.05.
Results
The AT by ventilatory, [lac] and [gluc] responses as well as through the VE/Workload and [lac]/Workload ratios was
identified for both groups, but the IGT could not be identified in two diabetic participants. In general, five to eight stages were necessary to conclude the IT for most of the subjects. The mean (+SD) VE, [lac], [gluc], VE/Workload and [lac]/Workload at the same relative intensities are presented for non-diabetic and diabetic participants (Figure 3 A-E). Also, the mean blood lactate and glucose, pH, BE, pO2 and pCO2 at rest and during the incremental test are presented in Figure 4 (A-D). After reaching the AT, the [gluc] and pO2 responses were similar to [lac] responses, while the pH, BE and pCO2 responded inversely to the [lac], VE, VE/Workload and [lac]/Workload ratios (Figures 3 and 4). In spite of the differences between groups as presented in Tables 1 and 2, no differences were observed within groups for the workload, oxygen consumption and heart rate as related to the LT, VT, IGT, VTVE/W, LTv[lac]/W (p>0.05). Also, variables were highly correlated with each other (Table 3) and the Bland and Altman technique evidenced an agreement between LT and the AT identified by other methods (Figure 5).
Discussion
This study compared methods to identify the AT on type-2 diabetics and younger non-diabetic subjects. This choice of comparison between type-2 diabetics and younger health and physically active subjects was that, as expected, these groups were different in terms of body composition and physical fitness as related to the VO2peak and AT results. Even so, the studied protocols were consistent within groups regardless of their characteristics. So, our main findings were that the IGT was identified in diabetics similarly to non-diabetic subjects (Figures 2a-b and Figure 3), in spite of the differences between groups regarding their physical characteristics and health status. It was demonstrated for both groups that AT may be successfully identified during an incremental test on a cycle
Figure 1 -Determination of LT, VT and IGT for a single subject with type-2
diabetes.
Table 2 – Mean (± SD) workload, VO2, blood lactate, blood glucose and heart rate corresponding to the AT identiied by different methods for type two diabetics and non-diabetic subjects
Type 2 diabetics Non-diabetics
LT IGT VT LL[lac]/W VTVE/W LT IGT VT LL[lac]/W VTVE/W
Workload (Watts) 85.0* (32.1) 86.0* (33.8) 88.0* (31.7) 82.0* (20.9) 90.2* (22.2) 139.0 (39.0) 140.8 (36.4) 133.0 (42.7) 122.7 (44.3) 133.0 (39.1) VO2
(mL.kgmL.kg-1.min-1)
16.0* (5.1) 16.3* (4.8) 16.6* (5.5) 15.8* (3.8) 16.6* (4.4) 28.3 (7.3) 28.8 (8.7) 27.4 (8.5) 25.2 (9.0) 27.1 (8.1) [lac] (mM) 2.5 (1.0) 2.5 (0.8) 2.7 (1.1) 2.5 (1.0) 2.8 (1.0) 2.8 (1.2) 3.3 (2.3) 3.0 (1.9) 2.5 (1.4) 2.7 (1.1) [gluc] (mM) 6.6* (1.8) 6.2* (1.7) 6.7* (1.9) 6.8* (2.1) 6.6* (2.1) 4.3 (0.7) 4.0 (0.8) 4.6 (1.0) 4.6 (1.0) 4.4 (0.8) HR (bpm) 124.9 (15.1) 126.4 (14.1) 126.2 (15.2) 122.5 (12.2) 127.7 (11.6) 136.7 (24.1) 138.9 (20.9) 133.3 (25.1) 123.5 (27.6) 132.3 (23.4)
p<0.05 in relation to the corresponding variable on the non-diabetic group.
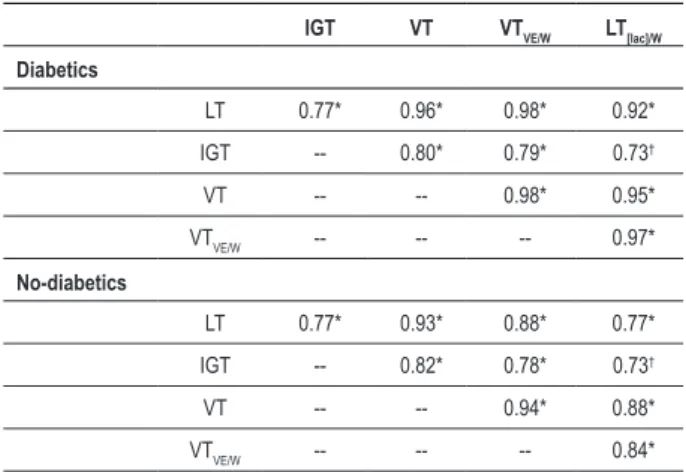
Table 3 – Relationship among exercise intensities corresponding to the AT identiied by different methods.
IGT VT VTVE/W LT[lac]/W
Diabetics
LT 0.77* 0.96* 0.98* 0.92*
IGT -- 0.80* 0.79* 0.73†
VT -- -- 0.98* 0.95*
VTVE/W -- -- -- 0.97*
No-diabetics
LT 0.77* 0.93* 0.88* 0.77*
IGT -- 0.82* 0.78* 0.73†
VT -- -- 0.94* 0.88*
VTVE/W -- -- -- 0.84*
* P<0.01; † P<0.05 for the correlation between variables.
ergometer by modeling the responses of VE/workload and [lac]/workload ratios through a second-order polynomial function with no differences when compared to other methods (Table 2). Also, different methods used to identify the AT in the present study showed high correlation to each other and the Bland and Altman technique showed an agreement between the LT and other methods to identify the AT, both for diabetics and non-diabetic subjects (Table 3; Figure 5). In support of our earlier studies with young physical active subjects2 the present study showed that the acid-base balance
was disrupted during incremental exercise at intensities above the identified thresholds (Figure 4), suggesting that the studied protocols are robust to identify intensities at which the acid-base balance may be kept during exercise. In spite of the lower aerobic fitness of diabetics in the present study, the thresholds of VO2peak were observed at around 68-70% for both groups (Table 1). Taken together, our findings reinforce the validity of the present methods to identify AT as an exercise intensity above which both metabolic acidosis
and [gluc] elevation occur.
We speculate that the IGT demarcates a transition from the predominance of [gluc] uptake to [gluc] output, stimulated by catecholamines and glucagon during high intensity exercises22.
The IGT was determined in 83.3% (10 of the 12) of the diabetic participants, while all non-diabetics had their IGT identified in the present study. The reason for the non-identification of IGT in some diabetics would be due to secondary metabolic/ hormonal disturbances or the effect of hypoglycemic agents on [gluc]. However, our results indicated that the exercise intensity that may elicits a [gluc] increase was similarly identified by either blood lactate and ventilatory responses (Table 2), which in turn may have clinical applications in blood glucose control and type-2 diabetes management. Since diabetic subjects may have problems both with blood coagulation and recovery from tissue damage, VT utilization seems to be attractive due its non-invasive nature.
Our data demonstrated that by modeling the VE/workload relationship through polynomial function, the resulting second-order equation may be derived and applied in order to identify at which intensity an over-proportional increase of the VE and thus VT occurs (Figure 2). The polynomial function modeling of the VE/workload results in a U-shaped curve that was similar to [lac]/workload ratio in both groups. This method enables AT identification with no O2 or CO2 analyses or interpretation by two or more physicians. Also, in addition to being non-invasive, it is independent from any specific value of ventilation, but dependent on its behavior, instead.
The insulin resistance has been associated to muscle lipid accumulation18. The AT identification from blood glucose and
from VE/Workload responses are simple methods that may identify optimal exercise intensities for the management of type 2 diabetes. While acute exercise at IGT intensity would improve the blood glucose profile, chronically it would prevent muscle lipid accumulation and thus, improve the insulin sensitivity of such patients. However, future studies should investigate both the acute and chronic effects of exercise performed at intensities related to AT on type 2 diabetics.
Figure 4 -Blood lactate and blood glucose (A), pH and BE (B), pO2 and pCO2 (C) at rest and during the incremental test for 5 non-diabetic participants.
Figure 3 (A-E) -Responses of the VE, [lac], [gluc], VE/Workload and [lac]/Workload during incremental test at the same relative intensities for type-2 diabetes (n=10)
Figure 5 -Agreemet between LT and IGT (A), LT and VT (B), LTand VTVE/W (C), LT and LT[lac/w] (D) for Non-diabetics and LT and IGT (E), LT and VT (F), LT and VTVE/W (G), LT and LT[lac/W] (H) for Diabetics (Bland and Altman 1986)
subjects, the AT may be accurately identified in type 2 diabetics during incremental test on a cycle ergometer through blood glucose responses, as well as by applying a second-order polynomial function to the VE/workload relationship. Also, the proposed methods to identify the AT did not differ from each other and seem to point out an exercise intensity
above which the blood glucose is increased and an acid-base disruption occurs.
Acknowledgements
The authors are grateful to CNPq (proc. 475575/2004-0)
References
1. Koyal S, Whipp NBJ, Huntsman D, Bray GA, Wasserman K. Ventilatory responses the metabolic acidosis of treadmill and cycle ergometry. J Appl Physiol. 1976; 40: 864-7.
2. Simoes HG, Campbell CS, Kushnick MR, Nakamura A, Katsanos CS, Baldissera V, et al. Blood glucose threshold and the metabolic responses to incremental exercise tests with and without prior lactic acidosis induction. Eur J Appl Physiol. 2003; 89: 603-11.
3. Jacobs I. Blood lactate: implications for training and sports performance. Sports Med. 1986; 3: 10-25.
4. Weltman A, Snead D, Stein P, Seip R, Schurrer R, Rutt R, et al. Reliability and Validity of a Continuous Incremental Treadmill Protocol for the Determination of Lactate Threshold, Fixed Blood Lactate Concentrations, and VO2max. Int J Sports Med. 1990; 11: 26-32.
5. Thin AG, Linnane SJ, McKone EF, Freaney R, FitzGerald MX, Gallagher CG, et al. Use of the gas exchange threshold to noninvasively determine the lactate threshold in patients with cystic fibrosis. Chest. 2002; 121: 1761-70.
6. Wasserman K, McIlroy M. Detecting the threshold of anaerobic metabolism in cardiac patients during exercise. Am J Cardiol. 1964; 14: 844-52.
7. Hornsby WG, Albright AL. Diabetes In: Dustine JL, Moore GE, ACSM1. Exercise management for persons with chronic diseases and disabilities. 2nd ed. Champaign: Human Kinetics; 2002. p. 133-41.
8. Meyer T, Gorge G, Schwaab B, Hildebrandt K, Walldorf J, Schafer C, et al. An alternative approach for exercise prescription and efficacy testing in patients with chronic heart failure: a randomized controlled training study. Am Heart J. 2005; 149 (5): 1-7.
9. Kawaji K, Fujita Y, Yajima Y, Shirataka M, Kubo H. Usefulness of anaerobic threshold in estimating intensity of exercise for diabetics. Diabetes Res Clin Pract. 1989; 15: (4): 303-9.
10. Bertoluci MC, Firedman G, Schaan BD, Ribeiro JP, Schmid H. Intensity-related exercise albuminuria in insulin dependent diabetic patients. Diabetes Res Clin Pract. 1993; 19: 217-25.
11. Fugita Y, Matoba K, Takeuchi H, Ishii K, Yajima Y. Anaerobic threshold can provoke microalbuminuria in non-insulin-dependent diabetics. Diabetes Res
Clin Pract. 1994; 22: 155-62.
12. Maiorana A, O’Driscoll G, Goodman C, Taylor R, Green D. Combined aerobic and resistance exercise improves glucemic control and fitness in type 2 diabetes. Diabetes Res Clin Pract. 2002; 56: 115-23.
13. Miyatake M, Takanami NS, Kawasaki Y, Fujii M. Relationship between visceral fat accumulation and physical fitness in Japanese women. Diabetes Res Clin Pract. 2004; 64: 173-9.
14. Kunitomi M, Takahashi K, Wada J, Suzuki H, Miyatake N, Ogawa S, et al. Re-evaluation of exercise prescription for japanese type 2 diabetic patients by ventilatory threshold. Diabetes Res Clin Pract. 2000; 50: 109-15.
15. Atkinson G, Davison RCR, Nevill AM. Performance characteristics of gas analysis systems: what we know and what we need to know. Int J Sports Med. 2005; 26 (Suppl.1): S2-10.
16. Meyer T, Lucia A, Earnest CP, Kindermann W. A conceptual framework for performance diagnosis and training prescription from submaximal gas exchange parameters-theory and application. Int J Sports Med. 2005; 26 (Suppl.1): S38-48.
17. Simões HG, Campbell CSG, Kokubun E, Denadai BS, Baldissera V. Blood glucose responses in humans mirror lactate responses for individual anaerobic threshold and for lactate minimum in track tests. Eur J Appl Physiol. 1999; 80: 34-40.
18. Bruce CR, Hawley JA. Improvements in insulin resistance with aerobic exercise training: a lipocentric approach. Med Sci Sports Exerc. 2004; 36 (7): 1196-201.
19. Gordon NF. Hypertension. In: Dustine JL, Moore GE, ACSM1. Exercise management for persons with chronic diseases and disabilities. 2nd ed. Champaign: Human Kinetics; 2002. p. 76-80.
20. Weltman A. The blood lactate response to exercise. Champaign: Human Kinetics; 1995. (Current Issues in Exercise Science, monograph no 4).
21. Bland JM, Altman DG. Statistical methods for assessing agreement between two methods of clinical measurement. Lancet. 1986; 1: 307-10.
22. Wasserman DH, Connolly CC, Pagliassotti MJ. Regulation of hepatic lactate balance during exercise. Med Sci Sports Exerc. 1991; 23: 912-9. to thank Dr. Ricardo Jaco de Oliveira for the collaboration and
LAFIT-UCB for the technical assistance.
Potential Conflict of Interest
No potential conflict of interest relevant to this article was reported.
Sources of Funding
This study was funded by CAPES.
Study Association

![Figure 2 - Determination of the AT through second-order polynomial function adjustment of the VE/Workload (VT VE/W )(A) and [lac]/Workload (LT [lac]/W ratio (B) for a individual with type-2 diabetes.](https://thumb-eu.123doks.com/thumbv2/123dok_br/15561520.601093/3.892.62.405.770.1087/determination-polynomial-function-adjustment-workload-workload-individual-diabetes.webp)

![Figure 5 - Agreemet between LT and IGT (A), LT and VT (B), LTand VT VE/W (C), LT and LT [lac/w] (D) for Non-diabetics and LT and IGT (E), LT and VT (F), LT and VT VE/W (G), LT and LT [lac/W] (H) for Diabetics (Bland and Altman 1986)](https://thumb-eu.123doks.com/thumbv2/123dok_br/15561520.601093/6.892.125.830.127.889/figure-agreemet-igt-ltand-diabetics-diabetics-bland-altman.webp)
