Genetic Factors in Familial Aggregation of Blood Pressure of
Portuguese Nuclear Families
Rogério César Fermino, André Seabra, Rui Garganta, José António Ribeiro Maia
Laboratório de Cineantropometria e Gabinete de Estatística Aplicada - Faculdade de Desporto, Universidade do Porto, Porto - Portugal
Summary
Background: Despite of the increase in the prevalence of hypertension in Portugal, the importance of genetic factors in blood pressure (BP) has not been studied extensively in our country.
Objectives: To verify the indirect presence of vertical transmission of genetic factors between parents and children in BP values, and to estimate the magnitude of genetic factors contributing for variation in BP values in the population.
Methods: Sample size comprises 367 individuals (164 parents and 203 children) pertaining the 107 nuclear families participating in “Familias Activas” project, proceeding from different regions of North Portugal. The BP was measured with Omron® model M6 (HEM-7001-E) digital device. SPSS 15.0 was used for data analysis; PEDSTATS was used to verify
the structure of each family data. Familial correlations and heritability estimates were computed in FCOR and ASSOC modules of S.A.G.E. version 5.3.
Results: For systolic BP (SBP), correlation values were low to moderate (0,21≤ r ≤0,35); for diastolic BP (DBP) values were found to be moderate (0,24≤ r ≤0,50). Genetic factors explain 43 and 49% of the total variation in SBP and DBP, respectively.
Conclusion: A moderate amount of the SBP and the DBP is accounted for by genetic factors. (Arq Bras Cardiol 2009;92(3): 199-204)
Key words: Heredity; genetics; Portugal; quantitative genetics
Correspondência: José António Ribeiro Maia •
Faculdade de Desporto – Universidade do Porto - Laboratório de Cineantro-pometria e Gabinete de Estatística Aplicada - Rua Dr. Plácido Costa, 91 – 4200-450 - Porto – Portugal.
E-mail: [email protected]
Artigo recebido em 05/12/07; revisado recebido em 05/06/08;
aceito em 05/06/08.
Introduction
The association between Blood Pressure (BP) levels and the risk of cardiovascular events is continuous and independent from other risk factors1. The increase in BP represents an important risk factor for the development of cardiovascular diseases, myocardial infarction and coronary artery disease1,2.
Systemic arterial hypertension (SAH) is one of the main Public Health problems in several countries, affects large populations and its prevalence is higher than 20% in the general population3. In the United States, 29% of the adult population is classified as hypertensive4. A study carried out in six countries of Europe suggested an even higher prevalence of SAH, i.e., of around 44%5. In Portugal, the prevalence of SAH is 42.1%6.
Among the determinant causes for the elevation in BP levels, it is known that genetic as well as environmental factors
play an important role7. Thus, SAH involves environmental and hereditary8 components, being classified as a complex and multifactorial disease, the result of the interaction between these factors7.
There is strong evidence, from investigations in Genetic Epidemiology, about the importance of the family history in BP values8-13. This influence is the result of the sharing of genes and a common environment of the members of the same family11. It is estimated that 2512 to 58%9 of the BP variability can be determined genetically. Robinson et al14 have suggested that the additional effects of the genes can be even higher in SAH (approximately 80%). Fuentes et al2 verified that when a parent is hypertensive, the descendant has up to approximately 3.5-fold more chances of developing SAH when compared to a descendant whose parents are normotensive.
Due to the fact of the acknowledged importance of BP control in terms of Public Health, the eventual alteration induced by the salutogenic behavior shared by the family members and the scarcity of information available in the Portuguese language about the aspects of family aggregation in BP values, we established the following objectives for this preliminary investigation:
and
2) to estimate the contribution of genetic factors responsible for the variation of BP values in population terms.
Methods
Sample
The “Famílias Activas” (Active Families) project has, initially, the objective of studying and referencing the genetic and environmental aspects in physical activity, physical fitness, metabolic syndrome (MS) components, dietary habits and behavioral risk factors in nuclear families. The second phase will deal with counseling and intervention in families with the purpose of altering risk behaviors and habits. The sampling of this project is divided in different places, based on the volunteer work of children and adolescents that wish to have their families involved in this research, as long as they have at least one brother or sister older than 7 years.
The data used in the present study refer to the pilot study of the first phase of the project. In order to do that we contacted the schools that were more easily accessible in some districts of the North region of the country in order to verify the possible enrollment in the project.
In places with higher accessibility, we sent a written information to each one of the families inviting them to participate in the study. According to the ethical aspects present in the Declaration of Helsinki, the written communication disclosed information about the purpose of the study, as well as the information related to the participation consent. After the informed consent form was duly signed, another communication was sent to the families explaining in details the necessary procedures for data collection, as well as the scheduling of date, time and place.
Due to the fact that other MS data were collected (glycemia, triglycerides and cholesterol), the individuals were evaluated in the morning and in fasting condition. The following cases were excluded: 1) non-biological father and/or mother (one father) and 2) individuals undergoing treatment with antihypertensive drugs (two cases).
The sample contained 367 individuals (164 parents - 41±4.6 years and 203 descendants – 13.2±3 years) belonging to 107 nuclear families from different regions of Northern Portugal.
Measurement of blood pressure
To evaluate BP, an automatic digital Omron® equipment model M6 (HEM-7001-E) was used, validated according to The International Protocol of the European Society of Hypertension15.
The measurement protocol followed the recommendations suggested in the literature16,17 and in the beginning, all procedures were explained to the individuals.
• Individuals: the assessed individuals remained sitting with the legs uncrossed, feet flat on the floor, the back against the chair and relaxed. The right upper limb was positioned with support at the heart level, with palm turned upwards and the elbow slightly flexed.
• Measurements: three measurements were carried out. The first after five minutes of rest and the others after an interval of approximately 3 minutes between them, in order to allow the stabilization of the blood flow. During the intervals, all possible care was taken to minimize anxiety. Individuals were also requested to remain silent during the measurement.
•Blood pressure cuff size: we chose a simplified and practical criterion for the cuff selection, for children and adolescents as well as for the adults, that would better attend to the main requirements:
1) to use the cuff that was large enough to cover 40% of the arm circumference midpoint between the acromion and the olecranon and
2) its length should cover 80 to 100% of the arm circumference, with minimal overlap. The cuff was adjusted firmly around 2 to 3 cm above the antecubital fossa, so it would be centralized over the brachial artery, with perfect contact with the skin; however, it should allow the introduction, without difficulty, of the forefinger between the cuff and the skin.
The BP value considered was the mean obtained from the three measurements. The individuals were classified as normotensive, pre-hypertensive or hypertensive, according to the classifications suggested by the Joint National Committee on Prevention, and Treatment of High Blood Pressure1 and the National High Blood Pressure Education Program Working Group on High Blood Pressure in Children and Adolescents17, for adults and children and adolescents, respectively.
Anthropometric measurements
Height was measured with a portable Siber Hegner® anthropometer with a precision of 0.1 cm. The equipment was fixed to a wooden base manufactured for this purpose. The barefoot individuals stood, with the heels lying flat on the aforementioned base, with gluteus and back against the anthropometer and the head positioned in the Frankfurt plane. Height was measured between the vertex and the reference plane of the wooden base18. Body mass was measured in a
Tanita® scale model BC-418MA (Tanita Corp., Tokyo, Japan) with a precision of 0.1 kg. The individuals were in the anthropometric position of reference18, barefoot and wearing light clothes.
Body mass index (BMI) was calculated by dividing the body mass (kg) by the square height (m), obtaining a final value expressed in kg/m2. Based on the BMI value, individuals were classified as normal weight, overweight or obese. For the adults, we used the classification suggested by the World Health Organization19 and for children and adolescents, the cutoffs proposed by Cole et al20.
Statistical analysis
groups. To calculate the confidence intervals of the prevalence among the groups, according to the classification of BP and BMI, the PEPI software was used. The PEDSTATS software wasused to verify the structure of each family and to analyze the generic behavior of the variables among the different members of the family. The calculations of the correlations among family members and the heritability (h2) estimates were carried out with modules FCOR and ASSOC of the S.A.G.E. 5 Genetic Epidemiology software. The Systolic Blood Pressure (SBP) was adjusted to such covariates as age, sex, age2, age x sex, age2 x sex, BMI and diastolic blood pressure (DBP) was adjusted to age2, age x sex, age2 x sex and BMI. The level of significance was set at 0.05.
Results
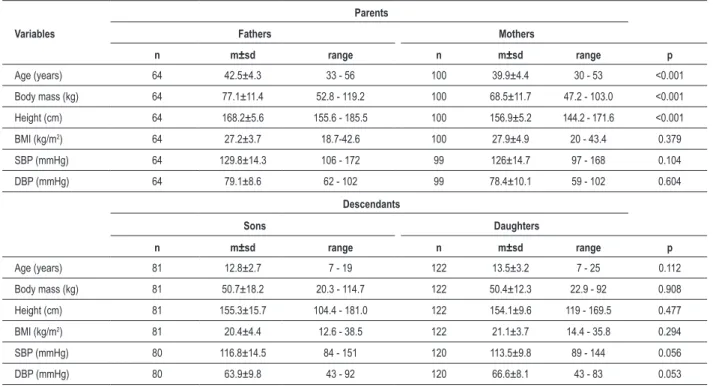
Table 1 shows the main descriptive aspects of the elements of the sample. Parents presented similar BMI values, as they demonstrated overweight levels (≥ 25 kg/m2). The parents presented higher mean BP levels, with the highest difference in SBP, however, not statistically significant. Among the offspring, with the exception of SBP, the girls presented higher BMI and DBP values when compared to boys. However, these results were not significant.
A higher prevalence of SAH was observed among the parents (≈ 1/3 vs. 1/5). Regarding BMI, the highest prevalence of obesity was observed in mothers (23 vs. 15.6%). It is important to emphasize the high prevalence of overweight/
Table 1 – Descriptive measurements of the sample variables
Variables
Parents
Fathers Mothers
n m±sd range n m±sd range p
Age (years) 64 42.5±4.3 33 - 56 100 39.9±4.4 30 - 53 <0.001
Body mass (kg) 64 77.1±11.4 52.8 - 119.2 100 68.5±11.7 47.2 - 103.0 <0.001
Height (cm) 64 168.2±5.6 155.6 - 185.5 100 156.9±5.2 144.2 - 171.6 <0.001
BMI (kg/m2) 64 27.2±3.7 18.7-42.6 100 27.9±4.9 20 - 43.4 0.379
SBP (mmHg) 64 129.8±14.3 106 - 172 99 126±14.7 97 - 168 0.104
DBP (mmHg) 64 79.1±8.6 62 - 102 99 78.4±10.1 59 - 102 0.604
Descendants
Sons Daughters
n m±sd range n m±sd range p
Age (years) 81 12.8±2.7 7 - 19 122 13.5±3.2 7 - 25 0.112
Body mass (kg) 81 50.7±18.2 20.3 - 114.7 122 50.4±12.3 22.9 - 92 0.908
Height (cm) 81 155.3±15.7 104.4 - 181.0 122 154.1±9.6 119 - 169.5 0.477
BMI (kg/m2) 81 20.4±4.4 12.6 - 38.5 122 21.1±3.7 14.4 - 35.8 0.294
SBP (mmHg) 80 116.8±14.5 84 - 151 120 113.5±9.8 89 - 144 0.056
DBP (mmHg) 80 63.9±9.8 43 - 92 120 66.6±8.1 43 - 83 0.053
BMI - body mass index, SBP - systolic blood pressure, DBP - diastolic blood pressure, m - mean, sd - standard deviation, p - statistical signiicance value.
obesity in both sexes (♂: 78.1% and ♀: 75%). Among the offspring, for SAH as well as for obesity, we observed a higher prevalence in boys. However, this difference was statistically significant only for obesity. If we add overweight and obesity, the highest prevalence is presented in girls (32% vs. 27.2%) (Table 2).
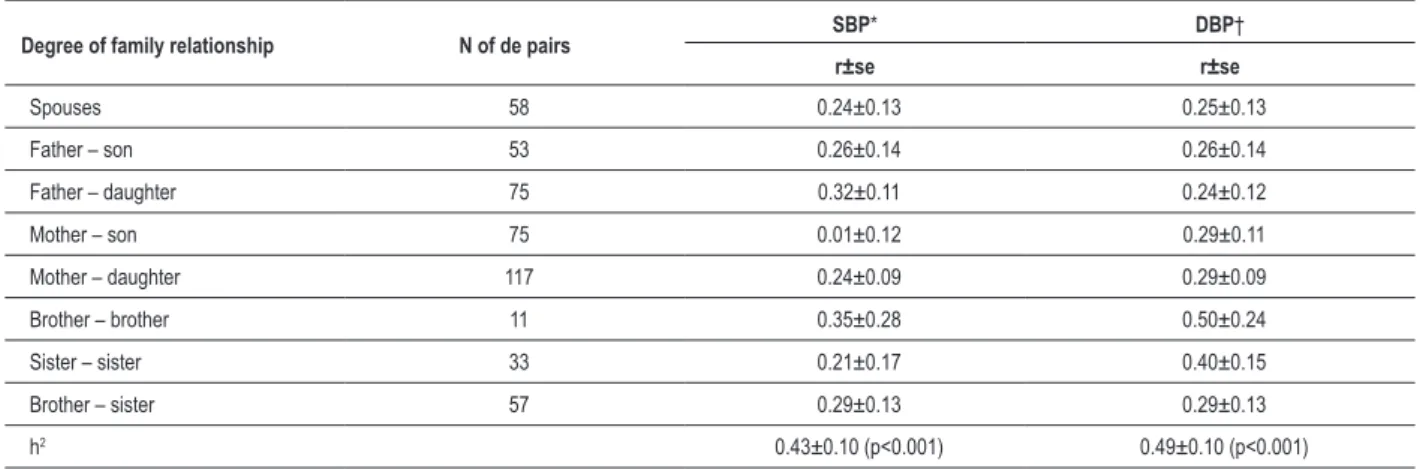
Correlation coefficient (r) values among family members and the estimates of h2 (± standard error) for SBP and DBP are shown in Table 3. For SBP, the r values among the degrees of family relationship in the nuclear family are low to moderate (0.21≤ r ≤0.35), except in the mother-son relationship (r=0.01). For DBP, the observed values were moderate (0.24≤ r ≤0.50). The h2 estimates were moderate and statistically significant (p<0.001). The genetic factors explained around 43% and 49% of the total variation of SBP and DBP, respectively.
Discussion
Table 2 – Relative frequency of individuals (and respective 95% conidence intervals) according to the blood pressure classiications and
body mass index
Relative frequency Parents Descendants
Fathers Mothers Sons Daughters
Normotensive
29.7% 35.4% 53.8% 67.5%
(0.19 – 0.42) (0.26 – 0.46) (0.42 – 0.65) (0.58 – 0.76)
Pre-hypertensive
40.6% 42.4% 23.7% 21.7%
(0.29 – 0.54) (0.33 – 0.53) (0.15 – 0.35) (0.15 – 0.30)
Hypertensive
29.7% 22.2% 22.5% 10.8%
(0.19 – 0.42) (0.15 – 0.32) (0.14 – 0.33) (0.06 – 0.18)
Normal weight 21.9% 25% 72.8% 68%
(0.13 – 0.34) (0.17 – 0.35) (0.62 – 0.82) (0.59 – 0.76)
Overweight 62.5% 52% 19.8% 27.1%
(0.50 – 0.74) (0.42 – 0.62) (0.12 – 0.30) (0.19 – 0.36)
Obese
15.6% 23% 7.4% * 4.9%
(0.08 – 0.27) (0.15 – 0.33) (0.03 – 0.15) (0.02 – 0.10)
* - statistically signiicant difference among descendants.
Table 3 – Correlation coeficients (r ± standard error) between family members and h2 estimates for systolic and diastolic arterial pressure
Degree of family relationship N of de pairs SBP* DBP†
r±se r±se
Spouses 58 0.24±0.13 0.25±0.13
Father – son 53 0.26±0.14 0.26±0.14
Father – daughter 75 0.32±0.11 0.24±0.12
Mother – son 75 0.01±0.12 0.29±0.11
Mother – daughter 117 0.24±0.09 0.29±0.09
Brother – brother 11 0.35±0.28 0.50±0.24
Sister – sister 33 0.21±0.17 0.40±0.15
Brother – sister 57 0.29±0.13 0.29±0.13
h2 0.43±0.10 (p<0.001) 0.49±0.10 (p<0.001)
SBP - systolic blood pressure, DBP - diastolic blood pressure ; * - adjusted to the covariables: age, sex, age2, age x sex, age2 x sex and BMI; † - adjusted to the
covariables age2, age x sex, age2 x sex and BMI.
was higher than among the girls (22.5% vs. 10.8%). Sorof et al21 found similar results in boys and higher values in girls (♂: 23% and ♀: 16%).
Familial aggregation designs aim at quantifying the contribution of genetic factors that are responsible for the variation of the BP values within the family. One way to interpret this contribution across families at the population level results in the calculations of the h2 estimates. The values obtained in the present study showed that the genetic factors significantly explained 43 and 49% of the SBP and DBP values, respectively. These results indicate that a significant part of both BP components have a strong genetic component.
A set of factors have been identified in the Portuguese population6, which can condition the BP values in population
terms. Among them, we emphasize the most relevant information for our research:
1) BP increases with age;
2) there is a difference in the mean BP values between the sexes, with men presenting more elevated SBP and DBP; and
3) the BMI was significantly higher in individuals with elevated BP.
Despite the importance of the BP in epidemiological terms, the family aggregation aspects seem to be scarcely studied in Portugal. The only study we had access to was the one carried out by Campos et al11, in which lower h2 estimates, of 34% and 17% for SBP and DBP, respectively, were found. When compared to the present sample, the sample from the Azores consisted of only 66 nuclear families and almost exclusively by three-member families (father, mother and son or daughter). It is important to emphasize that, in the present study, approximately 87% of the families had four or five members (3.94±0.45). The Azores Islands have an environmental aspect that is distinct from the mainland. It can be inferred that, due to the fact that the Islands consist basically of mountainous landscape, it is possible that the inhabitants present a higher level of physical activity when compared to the mainland dwellers.
Although the authors referred that approximately 60% of the individuals are insufficiently active (< 10,000 steps/day), the BP means are lower when compared to the individuals in the present sample. Considering that the h2 represents a population estimate of the magnitude of the genetic factors’ effect, one must be careful when directly comparing it with other studies, especially if the latter presents different characteristics regarding: sample size, family composition, age, socioeconomic level and ethnic and cultural aspects.
It is likely that the environmental differences, inherent to both cases, might have been responsible for the differences found in the h2 estimates.
In order to exemplify how the abovementioned factors can influence the h2 estimates, we mention the study by Gu et al13. The purpose of their study was to verify family aggregation in the BP of sedentary nuclear families of different ethnicities. A total of 434 individuals from 86 families of Caucasian origin (85 fathers, 85 mothers, 127 sons and 137 daughters) and 193 individuals from 74 families of Black origin (22 fathers, 37 mothers, 50 sons and 84 daughters) participated in The HERITAGE Family Study.
Regardless of gender and the condition of being a parent or a descendant, the Black individuals presented higher mean SBP and DBP values when compared to Caucasian individuals. It was observed that the genetic factors had a higher contribution in BP among Black individuals than among those of Caucasian origin (SBP: 68% vs 43% and DBP: 56% vs 24%).
Recent evidence provided by studies in Genetic Epidemiology carried out in populations from several countries supports the assertion that the genetic factors have an important influence on BP values8,10,13,22-25. Some studies analyzed nuclear families13,22,25, whereas others assessed extensive pedigrees8,10,23,24. The results found showed values between 1624-68%13 and 622-62%10 of the accountability of the SBP and DBP values, respectively, which can be attributed to genetic factors.
Rice et al26 carried out a study that shows the importance of aerobic exercise in the estimates of h2 for BP. Using a sample of 529 sedentary individuals belonging to 99
nuclear families from The HERITAGE Family Study, the authors calculated h2 for SBP and DBP, before and after an intervention program of 20 weeks of aerobic training. The results demonstrated that, at the start of the study, the h2 estimates were moderate (SBP h2=0.51 and DBP h2=0.42)25. However, after the exercise-induced effect, the values decreased, especially for SBP (SBP h2=0.18 and DBP h2=0.14)26. These results are interesting, as they demonstrate that both BP components are strongly influenced by the aerobic exercise.
A complementary form to interpret the h2 estimates is the verification of family aggregation based on r values. The results found in the present study were low to moderate (0.21 – 0.50), in the 8 correlations calculated between the degrees of family relationship in both BP components. Although a distinct pattern of similarity between the pairs of related individuals (parents-descendants: 0.24≤ r ≤0.32
and siblings: 0.21≤ r ≤0.50) was verified when compared
to unrelated individuals (spouses: r ≈0.25), these values suggest the presence of family aggregation in BP values. Among related individuals, this similarity can be attributed to genetic factors. However, the similarity found between spouses expresses an important influence of the common environment. The only discordant correlation was observed in the mother-son association for SBP. This fact suggests that, only for this component, the male descendants are not like their mothers.
Similar results were found in the study by Campos et al11. The authors found r values between -0.08 and 0.38, for DBP (father-son) and SBP (mother-daughter), respectively.
In the parent-offspring association, the values were -0.05≤ r ≤0.38 and -0.08≤ r ≤0.27 for SBP and DBP,
respectively. Between spouses, the similarity was 0.34 for SBP and 0.14 for DBP. As in the results of the present study, the similarity between mother and son in SBP was low (r=0.09). In a general context, although the correlations were similar to those of the present study (0.27≤ r ≤0.38),
the results showed negative values.
Other studies with nuclear families2,22,27 and in extensive pedigrees23 showed a similar pattern of family aggregation in BP among family members. The values obtained varied from 0.0323 to 0.5122 and 0.062,22 to 0.3322 for SBP and DBP, respectively.
References
1. The Seventh Report of the Joint National Committee on Prevention, Detection, Evaluation, and Treatment of High Blood Pressure. The JNC 7 Report. Hypertension. 2003; 42 (6): 1206-52.
2. Fuentes RM, Notkola IL, Shemeikka S, Tuomilehto J, Nissinen A. Familial aggregation of blood pressure: a population-based family study in eastern Finland. J Hum Hypertens. 2000; 14 (7): 441-5.
3. Nabel EG. Cardiovascular disease. N Engl J Med. 2003; 349 (1): 60-72.
4. American Heart Association. Heart disease and stroke statistics - 2007 Update: a report from the American Heart Association Statistics Committee and Stroke Statistics Subcommittee. Circulation. 2007; 115: e69-e171.
5. Wolf-Maier K, Cooper RS, Banegas JR, Giampaoli S, Hense HW, Joffres M, et al. Hypertension prevalence and blood pressure levels in 6 European countries, Canada, and the United States. JAMA. 2003; 289 (18): 2363-9.
6. Macedo ME, Lima MJ, Silva AO, Alcântara P, Ramalhinho V, Carmona J. Prevalence, awareness, treatment and control of hypertension in Portugal. The PAP study. Rev Port Cardiol. 2007; 26 (1): 21-39.
7. Irigoyen MC, Lancchini S, de Angelis K, Michelini LC. Fisiopatologia da hipertensão: o que avançamos? Rev Soc Cardiol Estado de São Paulo. 2003; 13 (1): 20-45.
8. Levy D, DeStefano AL, Larson MG, O’Donnell CJ, Lifton RP, Gavras H, et al. Evidence for a gene influencing blood pressure on chromosome 17: genome scan linkage results for longitudinal blood pressure phenotypes in subjects from the framingham heart study. Hypertension. 2000; 36 (4): 477-83.
9. Arya R, Blangero J, Williams K, Almasy L, Dyer TD, Leach RJ, et al. Factors of insulin resistance syndrome related phenotypes are linked to genetic locations on chromosomes 6 and 7 in nondiabetic mexican-americans. Diabetes. 2002; 51 (3): 841-7.
10. Li JK, Ng MC, So WY, Chiu CK, Ozaki R, Tong PC, et al. Phenotypic and genetic clustering of diabetes and metabolic syndrome in Chinese families with type 2 diabetes mellitus. Diabetes Metab Res Rev. 2006; 22 (1): 46-52.
11. Campos MA, Maia JAR, Seabra A, Silva RG, Lopes VP, Freitas DL. Actividade física e componentes da síndrome metabólica: um estudo em famílias açorianas. Porto: Direcção Regional do Desporto da Região Autónoma dos Açores e FADE-UP; 2007.
12. Austin MA, Edwards KL, McNeely MJ, Chandler WL, Leonetti DL, Talmud PJ, et al. Heritability of multivariate factors of the metabolic syndrome in nondiabetic Japanese americans. Diabetes. 2004; 53 (4): 1166-9.
13. Gu C, Borecki I, Gagnon J, Bouchard C, Leon AS, Skinner JS, et al. Familial resemblance for resting blood pressure with particular reference to racial differences: preliminary analyses from the HERITAGE Family Study. Hum Biol. 1998; 70 (1): 77-90.
14. Robinson RF, Batisky DL, Hayes JR, Nahata MC, Mahan JD. Significance of heritability in primary and secondary pediatric hypertension. Am J Hypertens. 2005; 18 (7): 917-21.
15. Topouchian JA, El Assaad MA, Orobinskaia LV, El Feghali RN, Asmar RG. Validation of two automatic devices for self-measurement of blood pressure according to the International Protocol of the European Society
of Hypertension: the Omron M6 (HEM-7001-E) and the Omron R7 (HEM 637-IT). Blood Press Monit. 2006; 11 (3): 165-71.
16. Hemmelgarn BR, Zarnke KB, Campbell NR, Feldman RD, McKay DW, McAlister FA, et al. The 2004 Canadian Hypertension Education Program recommendations for the management of hypertension: Part I - Blood pressure measurement, diagnosis and assessment of risk. Can J Cardiol. 2004; 20 (1): 31-40.
17. National High Blood Pressure Education Program Working Group on High Blood Pressure in Children and Adolescents. The fourth report on the diagnosis, evaluation, and treatment of high blood pressure in children and adolescents. Pediatrics. 2004; 114 (2 Suppl 4th Report): 555-76.
18. Lohman TG, Roche AF, Martorell R. Antropometric standardization reference manual. Champaign (Illinois): Human Kinetics Books; 1988.
19. Organização Mundial da Saúde [homepage na Internet]. Global database on body mass index an interactive surveillance tool for monitoring nutrition transition. [citado 2007 Maio 12]. Disponível em http://www.who.int/bmi/ index.jsp
20. Cole TJ, Bellizzi MC, Flegal KM, Dietz WH. Establishing a standard definition for child overweight and obesity worldwide: international survey. BMJ. 2000; 320: 1240-3.
21. Sorof JM, Lai D, Turner J, Poffenbarger T, Portman RJ. Overweight, ethnicity, and the prevalence of hypertension in school-aged children. Pediatrics. 2004; 113 (3 Pt 1): 475-82.
22. Saunders CL, Gulliford MC. Heritabilities and shared environmental effects were estimated from household clustering in national health survey data. J Clin Epidemiol. 2006; 59 (11): 1191-8.
23. Chien KL, Hsu HC, Chen WJ, Chen MF, Su TC, Lee YT. Familial aggregation of metabolic syndrome among the Chinese: report from the Chin-Shan community family study. Diabetes Res Clin Pract. 2007; 76 (3): 418-24.
24. Lin HF, Boden-Albala B, Juo SH, Park N, Rundek T, Sacco RL. Heritabilities of the metabolic syndrome and its components in the Northern Manhattan Family Study. Diabetologia. 2005; 48 (10): 2006-12.
25. An P, Rice T, Gagnon J, Borecki IB, Pérusse L, Leon AS, et al. Familial aggregation of resting blood pressure and heart rate in a sedentary population: the HERITAGE Family Study. Health, Risk Factors, Exercise Training, and Genetics. Am J Hypertens. 1999; 12 (3): 264-70.
26. Rice T, An P, Gagnon J, Leon AS, Skinner JS, Wilmore JH, et al. Heritability of HR and BP response to exercise training in the HERITAGE Family Study. Med Sci Sports Exerc. 2002; 34 (6): 972-9.
27. Park HS, Park JY, Cho SI. Familial aggregation of the metabolic syndrome in Korean families with adolescents. Atherosclerosis. 2006; 186 (1): 215-21.
28. Krushkal J, Ferrell R, Mockrin SC, Turner ST, Sing CF, Boerwinkle E. Genome-wide linkage analyses of systolic blood pressure using highly discordant siblings. Circulation. 1999; 99 (11): 1407-10.
29. The Wellcome Trust Case Control Consortium. Genome-wide association study of 14,000 cases of seven common diseases and 3,000 shared controls. Nature. 2007; 447: 661-78.
Conclusions
The results showed a strong family aggregation in both BP components, with a moderate degree of variation of this complex phenotype being attributed to genetic factors.
Potential Conflict of Interest
No potential conflict of interest relevant to this article was reported.
Sources of Funding
There were no external funding sources for this study.
Study Association