Revista de Nutrição Rev. Nutri., Campinas, 30(4):431-441, jul./ago., 2017
ULTRA-PROCESSED FOOD CONSUMPTION AMONG VEGETARIANS 431
https://doi.org/10.1590/1678-98652017000400003
ORIGINAL
ORIGINAL
1 Universidade Federal de Alagoas, Faculdade de Nutrição, Laboratório de Nutrição em Saúde Pública. Av. Lourival Melo
Mota, s/n., Tabuleiro dos Martins, 57072-900, Maceió, AL, Brasil. Correspondência para/Correspondence to: JAC SILVEIRA.
E-mail: <[email protected]>. 2 Nutricionista. Osasco, SP, Brasil.
Association between overweight and
consumption of ultra-processed food
and sugar-sweetened beverages
among vegetarians
Associação entre o excesso de peso e o consumo
de alimentos ultraprocessados e bebidas
açucaradas por diferentes grupos
vegetarianos
Jonas Augusto Cardoso da SILVEIRA1
Sabrina Silva MENESES2
Patrícia Teles QUINTANA2
Valquíria de Souza SANTOS2
A B S T R A C T
Objective
To assess the consumption of ultra-processed food and sugar-sweetened beverages and to identify the association of this consumption with overweight among vegetarians.
Methods
Results
Information was retrieved from 503 individuals (29.8±8.5 years old); 83.7% were women. The most frequent types of vegetarianism in our sample were ovo-lacto (45.5%) and vegan (41.7%), and the median time of vegetarianism was 5.3 years. The consumption of sugar-sweetened beverages (≥2x/day) and ultra-processed food (≥3x/day) was 21.0% and 16.0%, respectively, and regarding the different vegetarianism types, vegans showed the lowest frequency of excessive daily sugar-sweetened beverages and ultra-processed food consumption. In the multivariable analysis, consumption of ultra-processed food ≥3x/day (2.33 [1.36–4.03]), male sex (1.73 [1.01–2.96]), age ≥35 years (2.03 [1.23–3.36]) and not preparing one’s food (1.67 [0.95–2.94]) were independently associated with overweight.
Conclusion
Although vegetarianism is frequently associated with a healthier diet and, consequently, prevention of poor health outcomes, this study found that the excessive consumption of sugar-sweetened beverages and ultra-processed food was associated with overweight.
Keywords: Diet, vegetarian. Food consumption. Obesity. Overweight.
R E S U M O
Objetivo
Avaliar o consumo de alimentos ultraprocessados e de bebidas açucaradas entre indivíduos vegetarianos e identificar sua associação com o excesso de peso.
Métodos
Estudo transversal com método amostral por conveniência, sendo os dados coletados por meio de questionário virtual entre 24/8/2015 e 8/10/2015. A amostra foi composta por indivíduos vegetarianos de ambos os sexos com idade >16 anos. Estudou-se a frequência de consumo de alimentos ultraprocessados e bebidas açucaradas, avaliados por meio de questionário de frequência alimentar, sendo categorizados em função do consumo semanal e diário e do tipo de prática vegetariana. A associação entre excesso de peso e consumo excessivo de alimentos ultraprocessados foi realizada por meio de regressão logística múltipla (RC [IC95%]).
Resultados
Participaram desta pesquisa 503 indivíduos (29,8±8,5 anos), com predominância do sexo feminino (83,7%). As principais práticas vegetarianas observadas foram a ovolactovegetariana (45,5%) e a vegana (41,7%), sendo a mediana de tempo de adesão ao vegetarianismo de 5,3 anos. Observou-se que o consumo de bebidas açucaradas
(≥2x/dia) e alimentos ultraprocessados (≥3x/dia) foi, respectivamente, 21,0% e 16,0%; em relação aos outros
grupos, os veganos apresentaram consumo inferior de alimentos ultraprocessados e bebidas açucaradas. No
modelo múltiplo, identificou-se que consumo ≥3x/dia de alimentos ultraprocessados (2,33 [1,36–4,03]), sexo
masculino (1,73 [1,01–2,96]), idade ≥35 anos (2,03 [1,23–3,36]) e não preparar as refeições em casa (1,67
[0,95–2,94]) se associaram independentemente com excesso de peso.
Conclusão
Embora o vegetarianismo seja frequentemente associado à alimentação saudável e, consequentemente, à pre-venção de desfechos desfavoráveis a saúde, este estudo identificou frequência elevada do consumo diário excessivo de bebidas açucaradas e alimentos ultraprocessados e que este padrão de consumo se associou ao excesso de peso.
Palavras-chave: Dieta vegetariana. Consumo de alimentos. Obesidade. Sobrepeso.
I N T R O D U C T I O N
Although there are no population-level estimates – based on probabilistic sampling surveys – of the number of vegetarians in Brazil, interviews conducted by the Instituto Brasileiro de Opinião Pública e Estatística (IBOPE, Brazilian
Revista de Nutrição Rev. Nutri., Campinas, 30(4):431-441, jul./ago., 2017
ULTRA-PROCESSED FOOD CONSUMPTION AMONG VEGETARIANS 433 https://doi.org/10.1590/1678-98652017000400003
Brazil – had the largest number of vegetarians (n=792 thousand); however, Fortaleza (CE) (Northeast region) had a higher frequency of vegetarians (14%) [1].
Therefore, as this group gains greater representation in the population, it is important to evaluate their health and nutritional status because they are characterized by a specific eating pattern related to the restriction of animal food intake [2].
Given these characteristics, research conducted with vegetarians has mostly focused on micronutrient deficiencies, especially regarding vitamin B12; however, few studies have analyzed their food patterns related to the consumption of Sugar-Sweetened Beverages (SSB), Ultra-Processed Food (UPF) and ingredients such as simple sugars and sodium.
It is reasonable to consider that this lack of attention originates from the conceptual model related to the vegetarian diet [3], which evidence shows has positive effects on health outcomes, i.e., metabolic syndrome [4] and mortality [5]. However, the assumption that solely being a vegetarian results in a healthy dietary pattern is problematic.
Adherence to this lifestyle is driven by many reasons other than health, including animal ethics, rights and welfare, environmental concerns and religion [2,6]. However, in general, the characteristics of UPF, SSB and other high-energy, -fat, -carbohydrate and -sodium foods and ingredients [7] do not violate vegetarians’
diet restrictions [8].
Consequently, considering the context of nutrition transition, which has indicated a significant increase in the consumption of UPF and SSB [9], without proper orientation, vegetarians are at risk of developing an eating pattern that is potentially harmful to their health.
Given this background, this study analyzed the UPF and SSB intake patterns among different types of vegetarianism to test whether the hypothesis regarding the “implicit”
quality of vegetarians’ diet is true; this analysis presents new information about vegetarians’ eating habits, as to the authors’ knowledge, there are no studies on this topic in Brazil. Finally, we investigated the association between excessive UPF intake and overweight, adjusting for potential confounders.
M E T H O D S
This was a cross-sectional study that applied a convenience sampling method because data were collected using an online questionnaire – developed on the Google Forms platform (<https://www.google.com/ forms/about/>) – that was made available to the target population through social networks (Facebook, Twitter and WhatsApp groups) from 8/24/2015 to 10/8/2015.
Eligibility criteria was defined as individuals of both sexes aged >16 years old who self-identified as a vegetarian, independent of the type of vegetarianism (vegan, lacto vegetarian, ovo vegetarian and lacto-ovo vegetarian).
The outcome variables – UPF and SSB intake – were collected using a Food Frequency Questionnaire (FFQ) developed from the new Dietary Guidelines for the Brazilian Population [7] and the FFQ from both “Pesquisa de Orçamentos Familiares de 2008/2009” (POF, Consumers Expenditure Survey) [10] and “Pesquisa Nacional de Demografia e Saúde da Criança e da Mulher de 2006/2007” (PNDS, National Survey on Demography and Health of Women and Children) [11].
Daily consumption of UPF and SSB was calculated by dividing the sum of the weekly consumption of each food available in the FFQ by seven (the number of weekdays). The category “<1x/day” should be interpreted as individuals who presented sporadic consumption of UPF and SSB.
history of vegetarianism and self-reported anthropometrics (to calculate Body Mass Index [BMI]). Overweight among adults (16-59 years) and the elderly (≥60 years) was defined as BMI ≥25kg/m² and ≥27kg/m², respectively [12].
Sample size was calculated by the method of Fleiss et al. [13] with continuity correction performed at OpenEpi [14] to detect an Odds Ratio (OR), of at least 1.8, with a two-tailed significance level (α) of 5%, 80% power (1-β) and a prevalence of overweight in the unexposed group (UPF <3x/day) of 25% [15]. Setting these parameters resulted in a sample size of 458 persons.
The answers obtained from the online questionnaire were automatically organized into Microsoft Excel format. We then imported the database to Stata/IC 12.0 (StataCorp., College Station, Texas, United States), which was used to organize and analyze all variables.
Initially, extensive descriptive analyses were conducted to identify the best approach to analyzing food consumption variables. Thus, we chose to present data as relative frequencies of consumption of UPF and SSB according to the type of vegetarianism; comparisons between proportions were conducted by Pearson’s Chi-squared test, considering an α=0.05.
We performed simple and multiple logistic regression analysis to test the association between overweight and excessive intake of UPF, adjusting for potential confounders. As UPF consumption includes SSB (except for 100% fruit juice), we selected the former as an independent variable in the multivariable analysis; furthermore, when both were introduced in the same model, SSB intake did not maintain its association with overweight (p=0.652), with only UPF intake remaining statistically significant. Thus, the association between SSB and overweight was presented only in the univariate analysis.
For the multiple logistic regression analysis, we considered eligible only the variables
that presented p<0.20 in the univariate analysis, and the introduction of variables into the model was performed using the stepwise forward method. Following technical recommendations, the estimates were interpreted according to their 95% Confidence Interval (95%CI), which is related to the p-value [16]. The estimates were presented as odds ratios with their respective 95%CI (OR [95%CI]).
This research was submitted and approved by an Ethics Committee in Human Research (CAAE 45685715.0.0000.5493). The Consent Form was shown on the home screen of the online questionnaire, and thus the participant could only access the next page after reading and expressing his/her agreement. Additionally, the answers were only saved after the participants had completed the whole questionnaire, allowing them to stop participating at any time.
R E S U L T S
In total, 503 individuals answered the questionnaire; their characteristics are presented in Table 1. The most frequent type of vegetarianism in our sample was ovo-lacto vegetarians (45.5%) and vegans (41.7%). The majority of the participants were women (83.7%), and the median time as a vegetarian was 3.5 years. Additionally, 82.3% reported that their main reason for adhering to a vegetarian diet was animal ethics, rights and welfare; only 1.6% indicated that they had become a vegetarian for health reasons.
Revista de Nutrição Rev. Nutri., Campinas, 30(4):431-441, jul./ago., 2017
ULTRA-PROCESSED FOOD CONSUMPTION AMONG VEGETARIANS 435 https://doi.org/10.1590/1678-98652017000400003
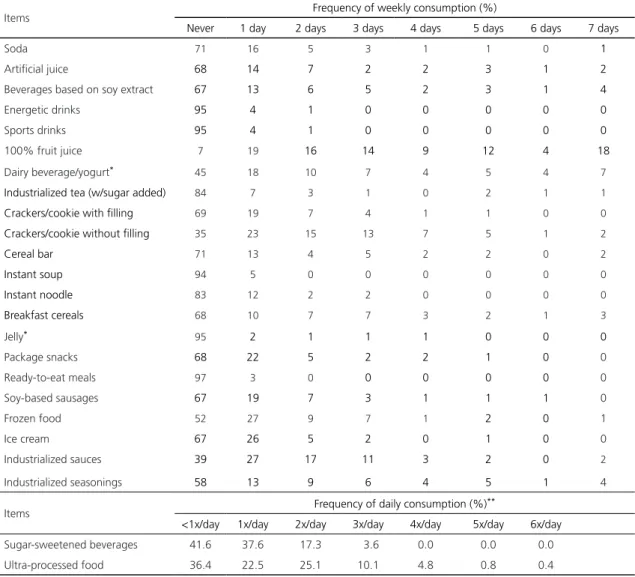
Tables 2, 3 and 4 show the results of the FFQ (by food item and grouped as UFP and SSB), which indicated that 60% of the participants ate UPF and SSB at least once a day. Furthermore, the frequency of excessive daily intake of UPF (≥3x/day) and SSB (≥3x/day) was 16% and 20%, respectively.
Additionally, we analyzed the frequency of excessive intake of UPF and SSB according to region, merging the South and Southeast (SS; more economically developed regions) and the North, Northeast and Midwest (NNM). In this analysis, we found no association regarding the consumption of UPF (SS=16.7%; NNM=12.1% [c²=0.892; gL=1; p=0.345]) or SSB (SS=21.3%; NNM=18.2% [c²=0.333; gL=1; p=0.564]).
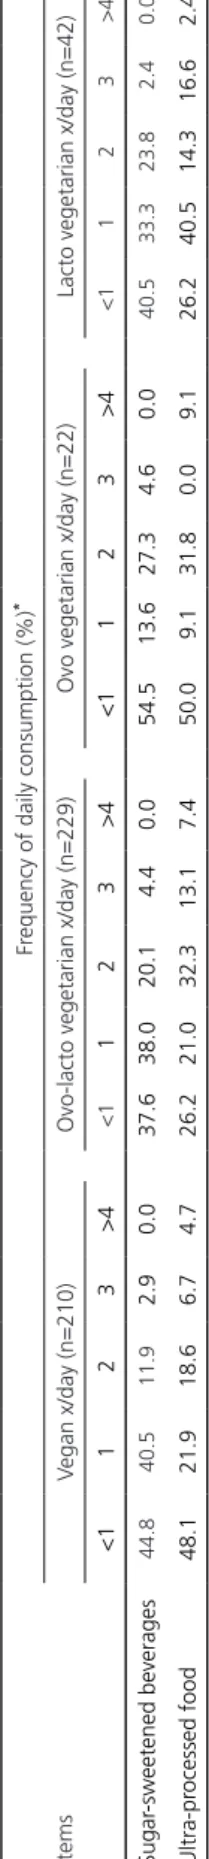
In Tables 3 and 4, consumption frequency was stratified by types of vegetarianism. We found that vegans presented lower daily frequency of UPF and SSB intake than the other vegetarian groups that include animal products in their diets (UPF: vegans=11.4%; other groups=19.5% [c²=5.832; gL=1; p=0.016]; SSB: vegans=14.8%; other groups=25.3% [c²=8.156; gL=1; p=0.004]).
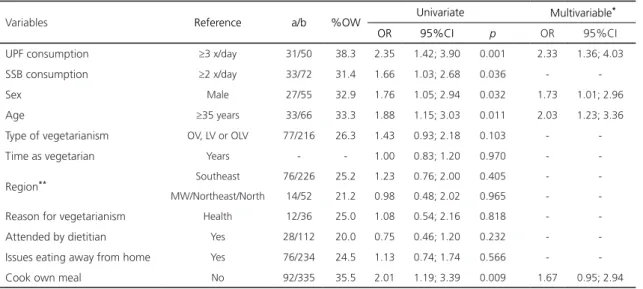
Finally, in Table 5, we present the factors associated with overweight among vegetarians. In the multivariable model, UPF consumption ≥3x/day (2.33 [1.36; 4.03]), male sex (1.73 [1.01; 2.96]), age ≥35 years (2.03 [1.23; 3.36]) and not cooking one’s own meal (1.67 [0.95; 2.94]) were independently associated with overweight in our sample.
D I S C U S S I O N
This research aimed to evaluate the consumption patterns of UPF and SSB among different types of vegetarians through an online survey. Despite its limitations, this was the first Brazilian study with vegetarians to shift the focus from nutrient deficiencies to the specific intake of UPF and SSB.
It is interesting to note that studies that overcome the paradigm of nutritional
Characteristics N=503* Mean (SD) or %
Sex (%)
Male 82 16.3
Female 421 83.7
Age (years) 492 29.8 (8.5)
Region (%)
South 135 26.8
Southeast 302 60.0
Midwest 27 5.4
Northeast 35 7.0
North 4 0.8
BMI (kg/m²) 23.3 (4.8)
Nutrition status* (%)
Underweight 33 6.6
Normal 351 69.7
Overweight 90 17.8
Obesity 29 5.7
Type of vegetarianism (%)
Ovo vegetarian 22 4.3
Ovo-lacto vegetarian 229 45.5
Lacto vegetarian 42 8.3
Vegan 210 41.7
Characteristics n* Median (IQR) or %
Weight post-vegetarianism (%)
Gained weight 74 14.7
Maintained weight 271 53.9
Lost weight 158 31.4
Time as vegetarian (years) 3.5 (1.5–8.0)
Reason for vegetarianism (%)
Animals ethics, rights and
welfare 414 82.3
Environmental concerns 48 9.5
Religion 21 4.2
Health 8 1.6
Other 12 2.4
Cook his/her own meal (%)
Yes 427 84.9
No 76 15.1
Attended by dietitian (%)
Yes 140 27.8
No 363 72.2
Issues eating away from home (%)
Yes 310 61.6
No 193 38.4
Table 1. Characteristics of the study participants – ultra-processed food and sugar-sweetened beverage consumption among Brazilian vegetarians survey (2015).
Note: *Based on body mass index.
SD: Standard Deviation; IQR: Interquartile Range; BMI: Body Mass
Items Frequency of weekly consumption (%)
Never 1 day 2 days 3 days 4 days 5 days 6 days 7 days
Soda 71 16 5 3 1 1 0 1
Artificial juice 68 14 7 2 2 3 1 2
Beverages based on soy extract 67 13 6 5 2 3 1 4
Energetic drinks 95 4 1 0 0 0 0 0
Sports drinks 95 4 1 0 0 0 0 0
100% fruit juice 7 19 16 14 9 12 4 18
Dairy beverage/yogurt* 45 18 10 7 4 5 4 7
Industrialized tea (w/sugar added) 84 7 3 1 0 2 1 1
Crackers/cookie with filling 69 19 7 4 1 1 0 0
Crackers/cookie without filling 35 23 15 13 7 5 1 2
Cereal bar 71 13 4 5 2 2 0 2
Instant soup 94 5 0 0 0 0 0 0
Instant noodle 83 12 2 2 0 0 0 0
Breakfast cereals 68 10 7 7 3 2 1 3
Jelly* 95 2 1 1 1 0 0 0
Package snacks 68 22 5 2 2 1 0 0
Ready-to-eat meals 97 3 0 0 0 0 0 0
Soy-based sausages 67 19 7 3 1 1 1 0
Frozen food 52 27 9 7 1 2 0 1
Ice cream 67 26 5 2 0 1 0 0
Industrialized sauces 39 27 17 11 3 2 0 2
Industrialized seasonings 58 13 9 6 4 5 1 4
Items Frequency of daily consumption (%)
**
<1x/day 1x/day 2x/day 3x/day 4x/day 5x/day 6x/day
Sugar-sweetened beverages 41.6 37.6 17.3 3.6 0.0 0.0 0.0
Ultra-processed food 36.4 22.5 25.1 10.1 4.8 0.8 0.4
Table 2. Consumption of ultra-processed food and sugar-sweetened beverage among vegetarians (N=503) – ultra-processed food and sugar-sweetened beverage consumption among Brazilian vegetarians survey (2015).
Note: *Percentage calculated excluding the group of vegans (n=293); **The sum of the weekly consumption of each food available in the Food Frequency Questionaries’ divided by seven.
deficiencies and manage to analyze the protective effect of vegetarian diets on health outcomes are based on the assumption that subjects “naturally” have a healthier eating pattern than omnivores. We believe that this assumption is due to a deductive reasoning process; namely, as omnivores who eat higher amounts of fruits, vegetables, whole grains and nuts (Mediterranean pattern) perform better on metabolic risk markers, this relationship must also be true for vegetarians, since these foods are not restricted and would be the most
available food option. Therefore, regarding food habits, despite their other behaviors, the choice to practice vegetarianism – by itself – has been assumed to be an intrinsic protective factor to cardiovascular disease [4,5,8,15].
Revista de Nutrição
Rev
. Nutri., Campinas, 30(4):431-441, jul./ago., 2017
UL
TRA-PROCESSED FOOD CONSUMPTION AMONG VEGET
ARIANS
437
https://doi.org/10.1590/1678-98652017000400003
Items
Frequency of weekly consumption (%)
Vegan (n=210) Ovo-lacto vegetarian (n=229) Ovo vegetarian (n=22) Lacto vegetarian (n=42)
Never to 2 times
3 to 4 times
5 to 7 times
Never to 2 times
3 to 4 times
5 to 7 times
Never to 2 times
3 to 4 times
5 to 7 times
Never to 2 times
3 to 4 times
5 to 7 times
Soda 93.3 2.8 3.8 91.2 4.8 3.9 100.0 0.0 0.0 97.6 2.3 0.0
Artificial juice 92.8 2.8 4.7 87.7 5.2 6.9 86.3 4.5 9.0 78.5 9.5 11.9
Beverages based on soy extract 83.8 7.1 9.0 88.2 6.1 5.2 72.7 4.5 22.7 88.0 7.1 4.7
Energetic drinks 99.0 0.9 0.0 100.0 0.0 0.0 100.0 0.0 0.0 100.0 0.0 0.0
Sports drinks 99.5 0.0 0.4 100.0 0.0 0.0 100.0 0.0 0.0 100.0 0.0 0.0
100% fruit juice 36.1 20.4 43.3 48.9 22.2 28.8 40.9 31.8 27.2 33.3 35.7 30.9
Dairy beverage/yogurt 96.6 1.4 1.9 68.9 11.7 19.2 86.3 9.0 4.5 85.7 9.5 4.7
Industrialized tea (w/sugar added) 94.7 0.9 4.2 93.0 2.1 4.8 95.4 4.5 0.0 95.2 2.3 2.3
Crackers/cookie with filling 93.8 5.2 0.9 96.9 3.0 0.0 100.0 0.0 0.0 92.8 4.7 2.3
Crackers/cookie without filling 76.1 19.0 4.7 68.5 21.8 9.6 68.1 22.7 9.0 76.1 14.2 9.5
Cereal bar 90.9 5.7 3.3 84.7 9.6 5.6 86.3 13.6 0.0 97.6 0.0 2.3
Instant soup 100.0 0.0 0.0 98.2 1.3 0.4 100.0 0.0 0.0 100.0 0.0 0.0
Instant noodle 96.1 2.3 1.4 97.8 2.1 0.0 95.4 4.5 0.0 97.6 2.3 0.0
Breakfast cereals 84.7 9.0 6.1 86.4 9.1 4.3 63.6 22.7 13.6 85.7 9.5 4.7
Jelly 100.0 0.0 0.0 97.3 1.7 0.8 100.0 0.0 0.0 100.0 0.0 0.0
Package snacks 95.7 3.3 0.9 96.5 2.6 0.8 95.4 4.5 0.0 90.4 9.5 0.0
Ready-to-eat meals 100.0 0.0 0.0 99.5 0.4 0.0 100.0 0.0 0.0 100.0 0.0 0.0
Soy-based sausages 93.3 4.7 1.9 92.5 4.8 2.6 94.4 4.5 0.0 97.6 2.3 0.0
Frozen food 93.3 5.2 1.4 82.9 12.2 4.8 95.4 0.0 4.5 90.4 9.5 0.0
Ice cream 98.5 0.9 0.4 96.0 2.1 1.7 95.4 4.5 0.0 100.0 0.0 0.0
Industrialized sauces 84.2 11.9 3.8 81.6 14.8 3.4 77.2 18.1 4.5 80.9 19.0 0.0
Industrialized seasonings 81.7 10.0 7.1 76.8 10.0 13.1 90.9 4.5 4.5 80.9 14.2 4.7
T ab le 4 . C o n su m p ti o n o f u lt ra -p ro ce ss e d f o o d a n d s u g a r-sw e e te n e d b e ve ra g e a cc o rd in
g to t
yp e s o f v e g e ta ri a n is m ( N = 5 0 3
) – u
lt ra -p ro ce ss e d f o o d a n d s u g a r-sw e e te n e d b e ve ra g e c o n su m p ti o n am o n g B ra zi lian v e g e tar ian s s u rv ey ( 2 0 1 5 ). Items Fr
equency of daily consumption (%)
*
V
egan x/day (n=210)
Ovo-lacto vegetarian x/day (n=229)
Ovo vegetarian x/day (n=22)
Lacto vegetarian x/day (n=42)
<1 1 2 3 >4 <1 1 2 3 >4 <1 1 2 3 >4 <1 1 2 3 >4 Sugar -sweetened beverages 44.8 40.5 11.9 2.9 0.0 37.6 38.0 20.1 4.4 0.0 54.5 13.6 27.3 4.6 0.0 40.5 33.3 23.8 2.4 0.0 Ultra-pr ocessed food 48.1 21.9 18.6 6.7 4.7 26.2 21.0 32.3 13.1 7.4 50.0 9.1 31.8 0.0 9.1 26.2 40.5 14.3 16.6 2.4 N o te : *T h e s u m o f t h e w e e k ly c o n su m p ti o n o f e a ch f o o d a va ila b le i n t h e F o o d F re q u e n cy Q u e st io n n a ir e d iv id e d b y s e ve n .
when the individual became overweight, and the decision to be a vegetarian could have been a therapeutic one; however, more than 80% of the study population reported “animal ethics, rights and welfare” and not “health” as their main reason for becoming a vegetarian.
On the other hand, when after examining the association of UPF with overweight as well as the prevalence of overweight among individuals who reported weight maintenance (50.0%) or weight gain (15.9%) after practicing vegetarianism, UPF consumption pattern could be a cause of overweight. Moreover, disregarding conjectures related to the causal pathway, the maintenance of this condition among vegetarians could have been mediated by non-healthy eating patterns. This assertion is supported by the fact that the multiple logistic regression model was adjusted by time as a vegetarian, and no inverse association with overweight was established.
Furthermore, we performed a multinomial regression analysis using “weight post-vegetarianism” as the outcome variable (Table 1) and excessive UPF intake as the explanatory variable, adjusting the model for sex, age, time as a vegetarian and preparation of own meals at home. In this analysis, which used the index category of “maintained weight”, UPF consumption was associated with weight gain post-vegetarianism (2.0 [1.06; 3.77 95%IC]), further strengthening the argument regarding its harmful effect on body weight among vegetarians. No variables were associated within the category “lost weight”.
Revista de Nutrição Rev. Nutri., Campinas, 30(4):431-441, jul./ago., 2017
ULTRA-PROCESSED FOOD CONSUMPTION AMONG VEGETARIANS 439 https://doi.org/10.1590/1678-98652017000400003
and healthy diet. Instead, they should proceed with a thorough assessment of eating habits and behavior, given the complexity in managing the nutritional requirements of these individuals, both regarding micronutrients deficiencies and excessive consumption of UPF and SSB.
From this perspective, we also found that not cooking one’s meals was associated with overweight, which corresponds with the findings of Gorgulho et al. [18] regarding the fact that adults who eat away from home present worse eating patterns. Their study showed that 24% of residents from the São Paulo (SP) metropolitan area ate at least one meal away from home/day, while in our sample, the prevalence was 15%.
National data from the 2002/2003 POF indicated that the overall prevalence of eating away from home was even greater (35.1%) [19]. Another publication using the same dataset showed that such behavior was associated with overweight and obesity in men, but not women, independent of age and income; regarding the consumption of UPF and SSB away from home, the authors observed that in general, overweight
men ate almost twice as much as overweight women [20].
Nevertheless, it is important to consider that eating away from home does not necessarily result in a worst eating pattern. As shown by Hoffman [21], using data from the 2008/2009 POF, eating away from home was negatively associated with overweight and obesity; however, when the logistic regression coefficient was exponentiated, the effect size was low, suggesting that the statistically significant association was due to the large sample size.
We also highlight in Hoffman’s [21] paper that the average daily consumption of sugars, lipids, sodium and cholesterol was higher among individuals who ate away from home than in individuals who ate exclusively at home. Therefore, despite consuming a slightly higher amount of vegetables (+0.101g/100kcal; p<0.05), people who ate away from home tended to present a less healthy eating pattern, which corroborates our hypothesis regarding the relationship between UPF and SSB intake and overweight.
Table 5. Factors associated with overweight among vegetarians – ultra-processed food and sugar-sweetened beverage consumption among Brazilian vegetarians survey (2015).
Variables Reference a/b %OW Univariate Multivariable
*
OR 95%CI p OR 95%CI UPF consumption ≥3 x/day 31/50 38.3 2.35 1.42; 3.90 0.001 2.33 1.36; 4.03 SSB consumption ≥2 x/day 33/72 31.4 1.66 1.03; 2.68 0.036 -
-Sex Male 27/55 32.9 1.76 1.05; 2.94 0.032 1.73 1.01; 2.96
Age ≥35 years 33/66 33.3 1.88 1.15; 3.03 0.011 2.03 1.23; 3.36 Type of vegetarianism OV, LV or OLV 77/216 26.3 1.43 0.93; 2.18 0.103 -
-Time as vegetarian Years - - 1.00 0.83; 1.20 0.970 -
-Region** Southeast 76/226 25.2 1.23 0.76; 2.00 0.405 - -MW/Northeast/North 14/52 21.2 0.98 0.48; 2.02 0.965 -
-Reason for vegetarianism Health 12/36 25.0 1.08 0.54; 2.16 0.818 - -Attended by dietitian Yes 28/112 20.0 0.75 0.46; 1.20 0.232 - -Issues eating away from home Yes 76/234 24.5 1.13 0.74; 1.74 0.566 - -Cook own meal No 92/335 35.5 2.01 1.19; 3.39 0.009 1.67 0.95; 2.94
Note: *Adjusted for time as vegetarian (years); **Index category=South. Prevalence of overweight (BMI ≥25kg/m² [16–59 years] and ≥27kg/m² [≥60 years]). N= 492. a/b: Number of individuals exposed with outcome/number of individuals exposed without outcome.
%OW: Percent Overweight; OR: Odds Ratio; 95%CI: 95% Confidence Interval; UPF: Ultra-Processed Food; SSB: Sugar-Sweetened Beverage;
Therefore, on this topic, we can state that although eating away from home is not synonymous with unhealthy meals or eating at fast-food restaurants, these environments may lead to consumption of unhealthy meals, especially among those who are not interested in improving their eating patterns [18,20,21]. Another fact that cannot be ignored is that in our study, 61.6% of the vegetarians reported having issues eating away from home.
Finally, we found that the age group of those ≥35 years (up to 63 years) was associated with overweight among vegetarians, and this finding can be considered consistent with the arguments raised to date, as this is an economically active part of society. Furthermore, this result could be a reaction to what occurs within the Brazilian population, as the overweight prevalence increases as the age group strata become older, regardless of sex, as shown in the 2008/2009 POF [22].
In addition to the issues related to the cross-sectional design and the limitations of FFQs, we note the absence of variables describing the sample’s economic, educational and lifestyle (i.e., level of physical activity/ sedentariness) characteristics, which could improve the understanding of the association between consumption of UPF and overweight among vegetarians as potential confounders.
Regarding the external validity of our results, it is important to consider that 86.6% of our sample was from the South and Southeast regions (the most developed regions in Brazil) and that the sampling process was designed for hypothesis testing and not for geographical representativeness.
One aspect of this research that is worth to highlight was raising relevant questions and concerns to the clinical practice and academic research about the quality of vegetarians’
diets. Furthermore, because of the increasing number of vegetarians, future national surveys should scale for this group when developing questionnaires – i.e., POF, PNDS, Pesquisa
Na-cional de Saúde (National Health Survey), Vigi-lância de Fatores de Risco e Proteção para Doenças Crônicas por Inquérito Telefônico (Surveillance of Protective and Risk Factors for Chronic Diseases by Telephone Survey), Pesquisa Nacional por Amostra de Domicílios (National Household Sample Survey).
As a methodological contribution, previous publications have reported problems identifying and selecting vegetarians for research; therefore, this study provides an efficient approach to overcoming this limitation.
C O N C L U S I O N
Although vegetarianism is frequently associated with healthier diets and, consequently, with the prevention of poor health outcomes, this study identified 1) a high frequency of excessive daily consumption of UPF and SSB and 2) that this eating pattern was associated with overweight and obesity.
Therefore, we stress the need to progress beyond the paradigm of traditional nutritional deficiencies (iron and cyanocobalamin) in nutritional counseling or surveillance of vegetarian individuals and to offer at least the same attention to the consumption of UFP and SSB. Additionally, we found that male sex, age group ≥35 years and not cooking one’s own meals were factors associated with overweight among vegetarians.
This research adds to the body of evidence indicating the harmful effects related to excessive UPF and SSB consumption on human health and endorses the need for regulatory proposals through public health policies that effectively promote reduction of this type of intake.
A C K N O W L E D G E M E N T S
Revista de Nutrição Rev. Nutri., Campinas, 30(4):431-441, jul./ago., 2017
ULTRA-PROCESSED FOOD CONSUMPTION AMONG VEGETARIANS 441 https://doi.org/10.1590/1678-98652017000400003
C O N T R I B UT O R S
JAC SILVEIRA study conception and design, statistical analysis and interpretation, drafting of the manuscript and final approval of the submitted version. SS MENESES, PT QUINTANA, VS SANTOS study conception, data collection, drafting of the manuscript and final approval of the submitted version.
R E F E R E N C E S
1. Instituto Brasileiro de Opinião Pública. IBOPE 2012: 15,2 milhões de brasileiros são vegetarianos. São Paulo: IBOPE; 2012 [acesso 2016 ago 3]. Dispo-nível em: https://vista-se.com.br/ibope-2012-152-milhoes-de-brasileiros-sao-vegetarianos
2. Ruby MB. Vegetarianism: A blossoming field of study. Appetite. 2012;1(58):141-50. https://doi. org/10.1016/j.appet.2011.09.019
3. Haddad EH, Sabaté J, Whitten CG. Vegetarian food guide pyramid: A conceptual framework. Am J Clin Nutr. 1999;70(3):615S-9S.
4. Sabaté J, Wien M. A perspective on vegetarian dietary patterns and risk of metabolic syndrome. Br J Nutr. 2015;113(S2):S136-43. https://doi. org/10.1017/S0007114514004139
5. Orlich MJ, Singh PN, Sabaté J, Jaceldo-Siegl K, Fan J, Knutsen S, et al. Vegetarian dietary patterns and mortality in Adventist Health Study 2. JAMA. 2013;173(13):1230-8. https://doi.org/10.1001/ jamainternmed.2013.6473
6. Abonizio J. Conflitos à mesa: vegetarianos, consumo e identidade. Rev Bras Ciênc Soc. 2016;31(90):115. https://doi.org/10.17666/3190115-136/2016
7. Ministério da Saúde (Brasil). Secretaria de Atenção à Saúde. Guia alimentar para a população bra-sileira. 2ª ed. Brasília: Ministério da Saúde; 2014.
8. Dominique Ashen M. Vegetarian diets in cardiovascular prevention. Curr Treat Options Cardiovasc Med. 2013;15(6):735-45. https://doi. org/10.1007/s11936-013-0266-1
9. Martins APB, Levy RB, Claro RM, Moubarac JC, Monteiro CA. Increased contribution of ultra-processed food products in the Brazilian diet (1987-2009). Rev Saúde Pública. 2013;47(4):1-10. https:// doi.org/10.1590/S0034-8910.2013047004968
10. Instituto Brasileiro de Geografia e Estatística. Pesquisa de orçamentos familiares: 2008-2009. Análise do consumo alimentar pessoal no Brasil. Rio de Janeiro: IBGE; 2011.
11. Ministério da Saúde (Brasil). Pesquisa Nacional de demografia e saúde da criança e da mulher: PNDS 2006. Brasilia: Ministério da Saúde; 2009.
12. Ministério da Saúde (Brasil). Protocolos do Sistema de Vigilância Alimentar e Nutricional – SISVAN na assistência à saúde. Série B. Textos Básicos de Saúde. Brasília: Ministério da Saúde; 2008.
13. Fleiss JL, Tytun A, Ury HK. A Simple Approximation for calculating sample sizes for comparing independent proportions. Biometrics. 1980;36(2):343-6.
14. Dean A, Sullivan K, Soe M. OpenEpi: Open source epidemiologic statistics for public health. Version 3.0.1. Atlanta (GA): OpenEpi; 2013 [cited 2016 Aug 3]. Available from: www.openepi.com
15. Teixeira RDCMDA, Molina MDCB, Flor DS, Zandonade E, Mill JG. Estado nutricional e estilo de vida em vegetarianos e onívoros – Grande Vitória – ES. Rev Bras Epidemiol. 2006;9(1):131-43. https:// doi.org/10.1590/S1415-790X2006000100016
16. Gardner MJ, Altman DG. Confidence intervals rather than P values: Estimation rather than hypothesis testing. Br Med J. 1986;292(6522):746-50.
17. Marlow HJ, Hayes WK, Soret S, Carter RL, Schwab ER, Sabaté J. Diet and the environment: Does what you eat matter? Am J Clin Nutr. 2009;89(5):1699S-703S. https://doi.org/10.3945/ ajcn.2009.26736Z
18. Gorgulho BM, Fisberg RM, Marchioni DML. Away-from-home meals: Prevalence and characteristics in a metropolis. Rev Nutr. 2014;27(6):703-13. https:// doi.org/10.1590/1415-52732014000600005
19. Bezerra IN, Sichieri R. Características e gastos com alimentação fora do domicílio no Brasil. Rev Saúde Pública. 2010;44(2):221-9. https://doi.org/10.1590/ S0 034-89102010000200001
20. Bezerra IN, Sichieri R. Eating out of home and obesity: A Brazilian nationwide survey. Public Health Nutr. 2009;12(11):2037-43. https://doi.org/10. 1017/S1368980009005710
21. Hoffman R. Comparando a alimentação dentro e fora do domicílio, no Brasil, em 2008-2009. Segur Aliment Nutr. 2013;20(1):1-12.
22. Instituto Brasileiro de Geografia e Estatística. Pesquisa de orçamentos familiares: 2008-2009. Antropometria e estado nutricional de crianças, adolescentes e adultos no Brasil. Rio de Janeiro: IBICT; 2010.