Frequency of cholecystectomy and associated
sociodemographic and clinical risk factors
in the ELSA-Brasil study
Frequência de colecistectomia e fatores de risco sociodemográicos
e clínicos associados no estudo ELSA-Brasil
Kamila Rafaela Alves
I, Alessandra Carvalho Goulart
II, Roberto Marini Ladeira
III, Ilka Regina Souza de Oliveira
IV, Isabela Martins Benseñor
VCenter for Clinical and Epidemiological Research, University Hospital, Universidade de São Paulo (USP), São Paulo, SP, Brazil
ABSTRACT
CONTEXT AND OBJECTIVE: There are few data in the literature on the frequency of cholecystectomy in Brazil. The frequency of cholecystectomy and associated risk factors were evaluated in the Brazilian Longi-tudinal Study of Adult Health (ELSA-Brasil).
DESIGN AND SETTING: Cross-sectional study using baseline data on 5061 participants in São Paulo.
METHODS: The frequency of cholecystectomy and associated risk factors were evaluated over the irst two years of follow-up of the study and over the course of life. A multivariate regression analysis was pre-sented: odds ratio (OR) and 95% conidence interval (95% CI).
RESULTS: A total of 4716 individuals (93.2%) with information about cholecystectomy were included. After two years of follow-up, 56 had undergone surgery (1.2%: 1.7% of the women; 0.6% of the men). A total of 188 participants underwent cholecystectomy during their lifetime. The risk factors associated with surgery after the two-year follow-up period were female sex (OR, 2.85; 95% CI, 1.53–5.32), indigenous ethnicity (OR, 2.1; 95% CI, 2.28–15.85) and body mass index (BMI) (OR, 1.10; 95% CI, 1.01–1.19 per 1 kg/m2 increase).
The risk factors associated over the lifetime were age (OR, 1.03; 95% CI, 1.02–1.05 per one year increase), diabetes (OR, 1.92; 95% CI, 1.34–2.76) and previous bariatric surgery (OR, 5.37; 95% CI, 1.53–18.82). No as-sociation was found with parity or fertile age.
CONCLUSION: Female sex and high BMI remained as associated risk factors while parity and fertile age lost signiicance. New factors such as bariatric surgery and indigenous ethnicity have gained importance in this country.
RESUMO
CONTEXTO E OBJETIVO: Há escassez de dados na literatura sobre a frequência de colecistectomia no Brasil. Avaliou-se a frequência de colecistectomia e os fatores de risco associados no Estudo Longitudinal de Saúde do Adulto (ELSA-Brasil).
DESENHO E LOCAL: Estudo transversal com dados da linha de base de 5061 participantes em São Paulo.
MÉTODOS: Avaliou-se a frequência de colecistectomia e fatores de risco associados nos dois primeiros anos de seguimento do estudo e ao longo da vida. Apresentou-se regressão logística [razão de chances (RC); intervalo de coniança de 95% (IC 95%)] multivariada.
RESULTADOS: Um total de 4716 (93,2%) indivíduos com informação sobre colecistectomia foi incluído. Após 2 anos de seguimento, 56 participantes tinham sido operados (1,2%: 1,7% nas mulheres; 0,6% nos homens), totalizando 188 participantes com colecistectomia durante a vida. Os fatores de risco associados à cirurgia após dois dois anos de seguimento foram sexo feminino (RC, 2,85; IC 95%, 1,53-5,32), etnia indí-gena (RC, 2,1; IC 95%, 2,28-15,85) e índice de massa corpórea, IMC (RC, 1,10; IC 95%, 1,01-1,19 por aumento de 1 kg/m2); e, ao longo da vida: idade (RC, 1,03; IC 95%, 1,02-1,05 por um ano de aumento), diabetes (RC,
2,10; IC 95%, 1,34-2,76) e cirurgia bariátrica prévia (RC, 5.37; IC 95%, 1,53-18,82). Não se observou associação com paridade ou idade fértil.
CONCLUSÃO: Sexo feminino e IMC elevado permanecem sendo fatores de risco associados à colecistecto-mia, mas paridade e idade fértil perderam signiicância. Novos fatores de risco, como cirurgia bariátrica prévia e etnia indígena, ganharam relevância no país.
IBSc. Postgraduate Student, Department of
Medicine, Education and Health, Universidade de São Paulo (USP), São Paulo, SP, Brazil.
IIMD, PhD. Clinical Epidemiologist and Researcher,
Center for Clinical and Epidemiological Research, University Hospital, Universidade de São Paulo (USP), São Paulo, SP, Brazil.
IIIMD, PhD. Attending Physician at Hospital
Foundation of the State of Minas Gerais, Epidemiologist in the Municipal Health Department of Belo Horizonte, MG, Brazil and Director of the Longitudinal Study of Adult Health (Estudo Longitudinal de Saúde do Adulto, ELSA-Brasil), Belo Horizonte, MG, Brazil.
IVMD, PhD. Professor, Department of Radiology,
School of Medicine, Universidade de São Paulo (USP), São Paulo, SP, Brazil.
VMD, PhD. Professor, Department of Internal
Medicine, and Director of Center for Clinical and Epidemiological Research, University Hospital, Universidade de São Paulo (USP), São Paulo, SP, Brazil.
KEY WORDS: Cholecystectomy. Risk factors. Obesity.
Population characteristics. Brazil.
PALAVRAS-CHAVE: Colecistectomia. Fatores de risco. Obesidade.
INTRODUCTION
Gallstones have been recognized since antiquity, and have been
found in Egyptian mummies.1 Today, they are a frequent
prob-lem in developed countries, afecting 10 to 15% of the adult
pop-ulation in the United States,2 while in Europe, the prevalence
ranges from 5.9% to 21.9%.3 In Brazil,few studies have evaluated
the frequency of gallstones and associated risk factors. Coelho
et al.4 screened 1000 individuals in two shopping centers in the
city of Curitiba, Brazil, using ultrasound, and found that the fre-quency of gallstones was 6.4%. he direct and indirect costs of this ailment have been progressively increasing over recent years, as a consequence of increased numbers of surgical procedures in recent decades, and especially since the introduction of
laparo-scopic cholecystectomy in 1989.5,6
Multiple factors are responsible for cholelithiasis. Advancing age is one important risk factor for gallstones, and female sex is
also a known risk factor.2 Estrogen seems to play a critical role in
this increased risk, because pregnancy, high parity and estrogen
replacement therapy increase the risk of gallstones.7 Obesity is
another risk factor for gallstone development, likely caused
by increased hepatic secretion of cholesterol.1 he risk is
espe-cially high among women and increases linearly with increasing
body mass index.8 Ironically, rapid weight loss is also a risk factor
for gallstone development, such that gallstones occur in 25% to
30% of patients who undergo bariatric surgery.2 Although most
people with gallstones are asymptomatic, about 20% present
symptoms at some point and 7% require surgical intervention.9
he prevalence of cholecystectomy in the United States is higher among women than among men, and it varies widely
according to race.10 Maclure et al.8 in the Nurses’ Health Study
reported that the frequency of cholecystectomy was 0.49%,8
while Liu et al.11 reported a frequency of 1.3% in Taiwan. Except
for the study by Coelho et al.,4 in which a frequency of 2.9% was
reported from ultrasound screening of people in a shopping cen-ter in Curitiba, few studies on the epidemiology of cholecystec-tomy and associated risk factors have been conducted in Brazil.
OBJECTIVE
he aim of this study was to conduct a cross-sectional investiga-tion of the frequency of cholecystectomy and associated socio-demographic and clinical risk factors using data from all partici-pants in the ELSA-Brasil research center of São Paulo who had baseline information about previous cholecystectomy.
METHODS
Study design and population
he Brazilian Longitudinal Study of Adult Health (ELSA-Brasil) is a prospective cohort study designed to investigate the incidence
of cardiovascular diseases and diabetes, along with their biologi-cal and social determinants. he study originally included 15,105 subjects aged 35-74 years from six cities located in three diferent regions of Brazil: Belo Horizonte, Porto Alegre, Rio de Janeiro,
Salvador, São Paulo and Vitória.12-14 In our analysis, we included
baseline (cross-sectional) information from the irst exami-nation, which took place between August 2008 and December 2010. Only the participants evaluated at the São Paulo Research Center for whom data about cholecystectomy was available were included in this analysis.
Data were gathered from participants in two phases. he irst, which lasted for approximately one hour, consisted of obtaining informed consent and conducting the initial interview at the participant’s work site. he second comprised additional inter-views and examinations, lasted for approximately six hours and
was conducted at the study clinic.15 ELSA-Brasil was approved by
the Institutional Review Board at the University Hospital of the University of São Paulo, and all participants signed an informed consent statement.
Cholecystectomy information
Information about the previous cholecystectomy was obtained from the baseline study questionnaire, and was conirmed by means of an ultrasound evaluation that focused on screening for hepatic steatosis, which was also performed at baseline. As part of a multicenter protocol, all of the liver images were obtained in the same position in relation to four anatomical landmarks, one of which was viewing of the gallbladder. More details about the
liver ultrasound examination have been published elsewhere.16
Participants who did not report having had any previous chole-cystectomy or did not undergo hepatic ultrasound were excluded from the analysis.
Sociodemographic characteristics
We analyzed sociodemographic characteristics such as sex, age (years), self-reported race/skin color (white, mixed, black, East Asian or indigenous), years of schooling (< 11 years, 11–15 years or > 15) years, mean net family income (≤ US$ 1245, US$ 1246-3319 or ≥ US$ 3320), partner status (single or married) and
pre-vious history of bariatric surgery (yes or no).17 Local currency
[Brazilian reais (BRL)] was converted to U.S. dollars (USD) at a rate of BRL 2.00 = USD 1.00 in December 2008.
Anthropometric and blood pressure measurements
Anthropometric and blood pressure measurements were made on all participants. Weight, height and waist circumference
were measured following standard techniques.18 Body mass
index (BMI) was calculated as weight (in kilograms) divided by
waist circumference > 88 cm among women or > 102 cm among
men.19 Resting blood pressure was measured three times in a
seated position ater ive minutes of rest, using a validated oscil-lometric device. he averages of the second and third measure-ments were taken to be the systolic and diastolic blood pressures
in the analyses.20
Cardiovascular risk factors
Hypertension was deined as use of medication to treat hyperten-sion, or systolic blood pressure ≥ 140 mmHg, or diastolic blood pressure ≥ 90 mmHg. Diabetes was deined as a previous medical history of diabetes, or use of medication to treat diabetes, or fasting serum glucose ≥ 126 mg/dl, or two-hour oral glucose tolerance test ≥ 200 mg/dl, or HbA1c levels ≥ 6.5%. Dyslipidemia was deined as LDL-cholesterol > 130 mg/dl or current use of cholesterol-lower-ing medication. Patients were categorized accordcholesterol-lower-ing to smokcholesterol-lower-ing status and alcohol consumption as never, past or current users.
Psychiatric disorders
Mental diagnoses were assessed by trained interviewers using the validated Portuguese version of the Clinical Interview Schedule – Revised (CIS-R). he CIS-R is a structured interview for diagnos-ing and measurdiagnos-ing non-psychotic psychiatric morbidity in the com-munity. his short and straightforward questionnaire was developed
in 1992 by Lewis et al.21 to be used speciically within community
and primary care.Additionally, diagnoses of speciic disorders
were obtained by applying algorithms based on the International
Classiication of Diseases (ICD)-10 diagnostic criteria.22
Surveillance
Surveillance is being conducted through annual telephone inter-views, through a second examination four years ater the base-line assessment at the ELSA-Brasil research centers, and through linkage to national databases, such as the National Mortality Information System. Annual telephone calls are made to verify the overall state of the participants’ health, including new diag-noses, deaths, hospitalizations and emergency department vis-its over the irst two years of follow-up. All diagnoses noted in hospital discharge summaries or hospital records are recorded. Full hospital information is abstracted by trained personnel if the diagnoses include any ICD codes that relate to ELSA-Brasil
end-points.23 For this analysis, we used all information about
gallblad-der procedures from the irst two years of follow-up data.
Statistical analysis
Categorical variables are presented as proportions and were com-pared using the chi-square test. Continuous variables are pre-sented as means (with standard deviations) and were compared using one-way ANOVA with the Bonferroni post-hoc test.
A logistic regression model was built using sociodemo-graphic characteristics and cardiovascular risk factors as the independent variables, and cholecystectomy ater the baseline measurements as the dependent variable. Odds ratio were pre-sented as crude values, adjusted for age and sex, and with mul-tivariate adjustment. For sociodemographic risk factors, we did not present multivariate adjustment because the only
socio-demographic characteristics with P < 0.20 in Table 1 were age
and sex. For clinical variables, multivariate adjustment was done in accordance with sociodemographic and clinical characteristics
with P < 0.20 in Table 1, which were age, sex, body mass index,
waist measurement, hypertension, diabetes, dyslipidemia, major depressive disorders and previous bariatric surgery. Other logis-tic models were produced considering all cases of cholecystec-tomy (before and ater the baseline assessment).
A logistic regression model was also built using sociodemo-graphic characteristics and cardiovascular risk factors as the inde-pendent variables, and all lifetime cholecystectomy procedures as the dependent variable. For sociodemographic risk factors, mul-tivariate adjustment was done for other sociodemographic
char-acteristics with P < 0.20 in Table 1: age, sex, race, marital status
and having private health insurance. For clinical variables, multi-variate adjustment was done for all sociodemographic and
clini-cal risk factors with P < 0.20 in Table 1: age, sex, body mass index,
waist measurement, marital status, health insurance plan, hyper-tension, diabetes, dyslipidemia, smoking, alcohol intake, major depressive disorders and bariatric surgery.
he signiicant level was set at P < 0.05. All the analyses were performed using the SPSS sotware, version 22.0.
RESULTS
Overall, there were 5,061 participants (53.9% women) at the São Paulo research center. No information about previous cholecys-tectomy or liver imaging was available for 345 participants, and these were excluded from the analysis. Consequently, 4,716 par-ticipants remained in the study. here were 132 cases of chole-cystectomy before enrollment in ELSA-Brasil, 56 cases over the irst two years of follow-up and, thus, 188 cases over these indi-viduals’ lifetimes.
Cholecystectomy
No Yes
After baseline P-value
Yes
Lifetime P-value
n = 4528 (%) n = 56 (%) n = 188 (%)
Age* (years) 51 (9.0) 52 (9.4) 0.45 54 (9.6) 0.0001
Age strata (%)
35-44.9 1109 (24.7) 18 (13.6)
0.0001
31 (16.5)
0.0001
45-54.9 1882 (41.1) 53 (40.2) 76 (40.4)
55-64.9 1167 (25.5) 34 (25.8) 46 (24.5)
65-74 426 (9.3) 27 (20.6) 35 (18.6)
Female (%) 2442 (53.9) 43 (76.8) 0.001 136 (72.3) 0.0001
Body mass index* (kg/m2) 27 (4.9) 30 (6.4) 0.0001 29 (5.7) 0.0001
Waist circumference* (cm) 94 (13.1) 90 (12.7) 0.047 94 (13.3) 0.0001
Race (%)
White 2647 (59.2) 33 (62.3)
0.35
123 (67.6)
0.03
Mixed 976 (21.8) 9 (17.0) 31 (17)
Black 606 (13.6) 10 (18.9) 24 (13.2)
East Asian 195 (4.4) 0 (0.0) 1 (0.5)
Indigenous 46 (1.0) 1 (1.8) 3 (1.6)
Education (years) (%)
< 11 701 (15.5) 7 (12.5)
0.57
32 (17)
0.77
11 to 15 1795 (39.6) 26 (46.4) 76 (40.4)
> 15 2032 (44.9) 23 (41.1) 80 (42.6)
Mean family income (US$) (%) BRL 2.00 = USD 1.00
≤ 1245 1414 (31.4) 16 (28.6)
0.90
53 (28.3)
0.63
≥ 1246 to 3319 1918 (42.6) 25 (44.6) 81 (43.3)
≥ 3320 1173 (26.0) 15 (26.8) 53 (28.3)
Not single (%) 3033 (67.0) 34 (60.7) 0.32 109 (58) 0.01
Health insurance (%) 1612 (35.6) 20 (35.7) 0.99 77 (41) 0.13
Hypertension (%) 1145 (31.9) 23 (41.1) 0.15 71 (37.8) 0.09
Diabetes (%) 909 (20.1) 16 (28.6) 0.12 65 (34.6) 0.0001
Dyslipidemia (%) 2555 (56.8) 27 (48.2) 0.20 89 (47.6) 0.01
Smoking (%)
Never 2390 (52.8) 33 (58.9)
0.31
92 (48.9)
0.09
Past 1394 (30.8) 18 (32.1) 72 (38.3)
Current 744 (16.4) 5 (8.9) 24 (12.8)
Alcohol intake (%)
Never 530 (11.7) 8 (14.3) 0.84 32 (17)
0.09
Past 920 (20.3) 11 (19.6) 37 (19.7)
Current 3076 (68) 36 (66.1) 119 (63.3)
Physical activity (%)
Mild 3431 (78.6) 44 (83)
0.71
148 (82.7)
0.35
Moderate 577 (13.2) 6 (11.3) 21 (11.7)
Vigorous 358 (8.2) 3 (5.7) 10 (5.6)
Depressive disorder (%) 189 (4.2) 5 (8.9) 0.08 13 (6.9) 0.07
Previous bariatric surgery (%) 11 (0.2) 1 (1.8) 0.03 4 (2.1) 0.0001
Female participants only Previous pregnancy (%)
No 495 (20.3) 5 (11.6)
0.16 20 (14.7) 0.11
Yes 1945 (79.7) 38 (88.4) 116 (85.3)
Parity (%)
0 128 (6.6) 3 (7.9)
0.41
3 (2.6)
0.20
1–3 1578 (81.1) 33 (86.8) 96 (82.8)
≥ 4 240 (12.3) 2 (5.3) 17 (14.7)
Fertile age category (%)
≤ 49 years 1134 (46.5) 20 (46.5)
0.99 54 (39.7) 0.12
> 49 years 1305 (53.5) 23 (53.5) 82 (60.3)
Table 1. Sociodemographic and clinical characteristics of participants according to cholecystectomy during the irst two years of follow-up
Table 1 compares several sociodemographic and clinical
risk factors among participants who underwent cholecystec-tomy over the irst two years of follow-up, in relation to partici-pants who did not. Additionally, it also includes a comparison of all participants who underwent cholecystectomy at any point during their lifetimes (before or ater the baseline) with those who did not.
Participants who underwent cholecystectomy ater the base-line were more likely to be women and have higher BMI and waist measurement values, along with higher frequency of pre-vious bariatric surgery, compared with participants who did not
undergo surgery (Table 1). In the analysis that included lifetime
cases of cholecystectomy (before and ater baseline assessment), patients who underwent surgery were older and had higher BMI. he proportions of white and indigenous individuals and of singles and diabetics were higher, while the proportion of the patients with dyslipidemia was lower than the proportion who did not undergo cholecystectomy.
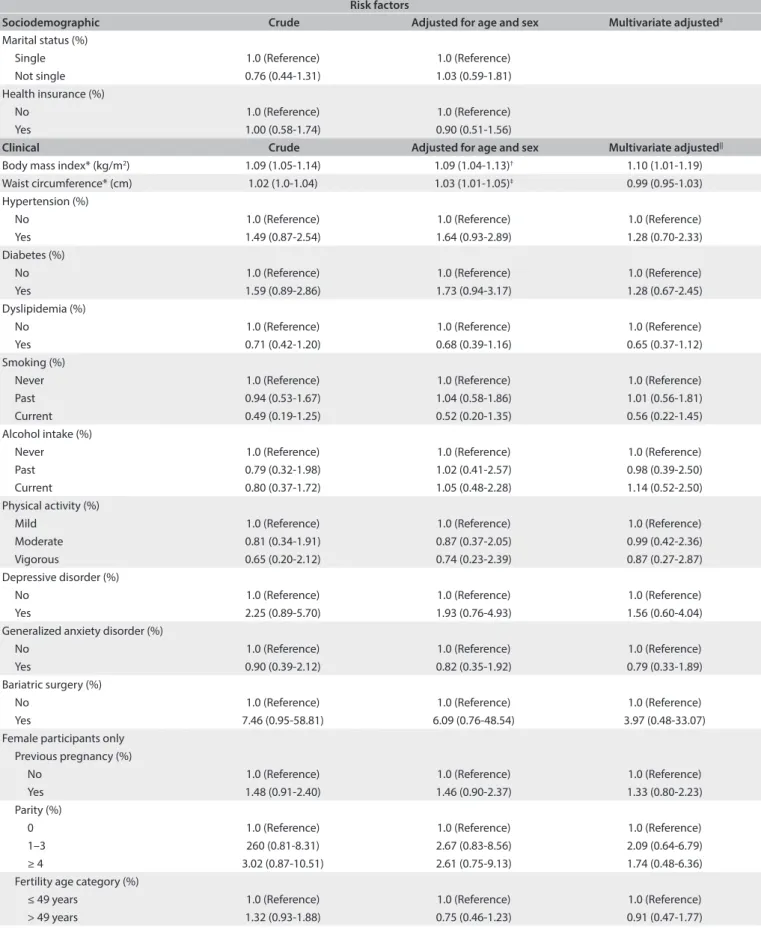
Table 2 presents logistic models for sociodemographic and
clinical risk factors for all participants who underwent chole-cystectomy during the irst two years of follow-up. Ater mul-tivariate adjustment, we found that there were positive associa-tions with female sex (OR, 2.85; 95% conidence interval, 95%
CI, 1.53-5.32) and indigenous ethnicity (OR, 2.10; 95% CI, 2.28-15.85). We also detected a positive OR of 1.10 (95% CI, 1.01-1.19)
per 1 kg/m2 increase in BMI, which remained signiicant ater
multivariate adjustment.
Table 3 shows the same associations, taking into
consid-eration all the participants who underwent cholecystectomy (before and ater the baseline, combined). Ater multivariate adjustment, we found that there were positive associations with age (for each one year increase in age: OR, 1.03; 95% CI, 1.02-1.05), female sex (OR, 2.35; 95% CI, 1.65-3.33), diabetes (OR, 1.92; 95% CI, 1.34-2.76) and previous bariatric surgery (OR, 5.37; 95% CI, 1.53-18.82), which remained signiicant ater multivar-iate adjustment. East Asian ethnicity (OR, 0.09; 95% CI, 0.01-0.65) and dyslipidemia (OR, 0.62; 95% CI, 0.45-0.85) were pro-tective factors against cholecystectomy. We did not ind that previous pregnancy, parity or the age stratum from 35 to 49 years (stratum of fertile age) showed any association with cholecystec-tomy in this subset of the ELSA-Brasil participants.
Table 4 describes the frequencies of elective and laparoscopic
surgery according to sex. Most surgeries were laparoscopic and performed as elective procedures for women and as an emer-gency for men. However, these diferences about the number of elective surgery according to sex were not statistically signiicant.
Risk factors
Sociodemographic Crude Adjusted for age and sex Multivariate adjusted‡
Age* (years) 1.01 (0.98-1.04) 1.01 (0.98-1.04)†
Age strata (%)
35-44.9 1.0 (Reference) 1.0 (Reference)†
45-54.9 1.04 (0.53-2.07) 1.04 (0.53-2.07)†
55-64.9 0.88 (0.40-1.93) 0.87 (0.40-1.92)†
65-74 1.61 (0.66-3.92) 1.81 (0.74-4.40)†
Sex (%)
Male 1.0 (Reference) 1.0 (Reference)
Female 2.83 (1.52-5.27) 2.85 (1.53-5.32)§
Race (%)
White 1.0 (Reference) 1.0 (Reference)
Mixed 0.74 (0.35-1.55) 0.81 (0.38-1.70)
Black 1.32 (0.65-2.70) 1.30 (0.63-2.65)
East Asian ---
---Indigenous 1.74 (0.23-13.02) 2.10 (2.28-15.85)
Education (years) (%)
< 11 1.0 (Reference) 1.0 (Reference)
11 to 15 1.45 (0.63-3.36) 1.40 (0.59-3.34)
> 15 1.13 (0.48-2.65) 1.00 (0.42-2.36)
Mean family income (US$) (%) BRL 2.00 = USD 1.00
≤ 1245 1.0 (Reference) 1.0 (Reference)
≥ 1246 to 3319 1.15 (0.61-2.17) 1.06 (0.56-1.99)
≥ 3320 1.13 (0.56-2.30) 1.04 (0.50-2.17)
Table 2. Odds ratio (OR) and 95% conidence intervals (95% CI) showing sociodemographic and clinical risk factors associated with cholecystectomy during the irst two years after baseline examination among ELSA-Brasil participants at the São Paulo research center
Risk factors
Sociodemographic Crude Adjusted for age and sex Multivariate adjusted‡
Marital status (%)
Single 1.0 (Reference) 1.0 (Reference)
Not single 0.76 (0.44-1.31) 1.03 (0.59-1.81)
Health insurance (%)
No 1.0 (Reference) 1.0 (Reference)
Yes 1.00 (0.58-1.74) 0.90 (0.51-1.56)
Clinical Crude Adjusted for age and sex Multivariate adjusted||
Body mass index* (kg/m2) 1.09 (1.05-1.14) 1.09 (1.04-1.13)† 1.10 (1.01-1.19)
Waist circumference* (cm) 1.02 (1.0-1.04) 1.03 (1.01-1.05)‡ 0.99 (0.95-1.03)
Hypertension (%)
No 1.0 (Reference) 1.0 (Reference) 1.0 (Reference)
Yes 1.49 (0.87-2.54) 1.64 (0.93-2.89) 1.28 (0.70-2.33)
Diabetes (%)
No 1.0 (Reference) 1.0 (Reference) 1.0 (Reference)
Yes 1.59 (0.89-2.86) 1.73 (0.94-3.17) 1.28 (0.67-2.45)
Dyslipidemia (%)
No 1.0 (Reference) 1.0 (Reference) 1.0 (Reference)
Yes 0.71 (0.42-1.20) 0.68 (0.39-1.16) 0.65 (0.37-1.12)
Smoking (%)
Never 1.0 (Reference) 1.0 (Reference) 1.0 (Reference)
Past 0.94 (0.53-1.67) 1.04 (0.58-1.86) 1.01 (0.56-1.81)
Current 0.49 (0.19-1.25) 0.52 (0.20-1.35) 0.56 (0.22-1.45)
Alcohol intake (%)
Never 1.0 (Reference) 1.0 (Reference) 1.0 (Reference)
Past 0.79 (0.32-1.98) 1.02 (0.41-2.57) 0.98 (0.39-2.50)
Current 0.80 (0.37-1.72) 1.05 (0.48-2.28) 1.14 (0.52-2.50)
Physical activity (%)
Mild 1.0 (Reference) 1.0 (Reference) 1.0 (Reference)
Moderate 0.81 (0.34-1.91) 0.87 (0.37-2.05) 0.99 (0.42-2.36)
Vigorous 0.65 (0.20-2.12) 0.74 (0.23-2.39) 0.87 (0.27-2.87)
Depressive disorder (%)
No 1.0 (Reference) 1.0 (Reference) 1.0 (Reference)
Yes 2.25 (0.89-5.70) 1.93 (0.76-4.93) 1.56 (0.60-4.04)
Generalized anxiety disorder (%)
No 1.0 (Reference) 1.0 (Reference) 1.0 (Reference)
Yes 0.90 (0.39-2.12) 0.82 (0.35-1.92) 0.79 (0.33-1.89)
Bariatric surgery (%)
No 1.0 (Reference) 1.0 (Reference) 1.0 (Reference)
Yes 7.46 (0.95-58.81) 6.09 (0.76-48.54) 3.97 (0.48-33.07)
Female participants only Previous pregnancy (%)
No 1.0 (Reference) 1.0 (Reference) 1.0 (Reference)
Yes 1.48 (0.91-2.40) 1.46 (0.90-2.37) 1.33 (0.80-2.23)
Parity (%)
0 1.0 (Reference) 1.0 (Reference) 1.0 (Reference)
1–3 260 (0.81-8.31) 2.67 (0.83-8.56) 2.09 (0.64-6.79)
≥ 4 3.02 (0.87-10.51) 2.61 (0.75-9.13) 1.74 (0.48-6.36)
Fertility age category (%)
≤ 49 years 1.0 (Reference) 1.0 (Reference) 1.0 (Reference)
> 49 years 1.32 (0.93-1.88) 0.75 (0.46-1.23) 0.91 (0.47-1.77)
*Mean (standard deviation); †Adjusted for sex; ‡Multivariate adjustment was not presented because only age and sex had P < 0.20; §Adjusted for age; ||Multivariate adjustment for age, sex, race, education, mean net family income, marital status, health insurance, BMI, waist circumference, hypertension,
diabetes, dyslipidemia, smoking, alcohol intake, physical activity, depressive disorder and bariatric surgery.
Risk factors
Sociodemographic Crude Adjusted for age and sex Multivariate adjusted||
Age* (years) 1.03 (1.02-1.05) 1.04 (1.02-1.05)† 1.03 (1.02-1.05)
Sex (%)
Male 1.0 (Reference) 1.0 (Reference) 1.0 (Reference)
Female 2.23 (1.61-3.09) 2.31 (1.67-3.20)§ 2.35 (1.65-3.33)
Race (%)
White 1.0 (Reference) 1.0 (Reference) 1.0 (Reference)
Mixed 0.68 (0.46-1.02) 0.78 (0.52-1.16) 0.80 (0.53-1.21)
Black 0.85 (0.55-1.33) 0.87 (0.56-1.36) 0.89 (0.56-1.41)
East Asian 0.11 (0.02-0.79) 0.09 (0.01-0.66) 0.09 (0.01-0.65)
Indigenous 1.40 (0.43-4.58) 1.58 (0.48-5.21) 1.63 (0.49-5.41)
Education (years) (%)
< 11 1.0 (Reference) 1.0 (Reference) 1.0 (Reference)
11 to 15 0.93 (0.61-1.42) 1.03 (0.66-1.60) 0.93 (0.59-1.47)
> 15 0.86 (0.57-1.31) 0.82 (0.53-1.25) 0.65 (0.39-1.08)
Mean family income (US$) (%) BRL 2.00 = USD 1.00
≤ 1245 1.0 (Reference) 1.0 (Reference) 1.0 (Reference)
≥ 1246 to 3319 1.13 (0.79-1.60) 1.05 (0.73-1.50) 1.05 (0.72-1.54)
≥ 3320 1.21 (0.82-1.78) 1.00 (0.64-1.43) 0.87 (0.53-1.44)
Marital status (%)
Single 1.0 (Reference) 1.0 (Reference) 1.0 (Reference)
Not single 0.68 (0.51-0.92) 0.89 (0.66-1.22) 0.93 (0.67-1.28)
Health insurance (%)
No 1.0 (Reference) 1.0 (Reference) 1.0 (Reference)
Yes 1.25 (0.93-1.69) 1.08 (0.80-1.46) 1.11 (0.80-1.53)
Clinical Crude Adjusted for age and sex Multivariate adjusted||
Body mass index* (kg/m2) 1.07 (1.05-1.10) 1.07 (1.04-1.10)† 1.04 (0.99-1.11)
Waist circumference* (cm) 1.02 (1.01-1.03) 1.03 (1.02-1.04)§ 1.01 (0.98-1.03)
Hypertension (%)
No 1.0 (Reference) 1.0 (Reference) 1.0 (Reference)
Yes 1.49 (0.87-2.54) 1.64 (0.93-2.89) 1.28 (0.70-2.33)
Diabetes (%)
No 1.0 (Reference) 1.0 (Reference) 1.0 (Reference)
Yes 2.10 (1.54-2.87) 2.05 (1.48-2.83) 1.92 (1.34-2.76)
Dyslipidemia (%)
No 1.0 (Reference) 1.0 (Reference) 1.0 (Reference)
Yes 0.69 (0.52-0.93) 0.61 (0.45-0.83) 0.62 (0.45-0.85)
Smoking (%)
Never 1.0 (Reference) 1.0 (Reference) 1.0 (Reference)
Past 1.34 (0.98-1.84) 1.41 (1.02-1.94) 1.38 (0.98-1.93)
Current 0.84 (0.53-1.32) 0.90 (0.57-1.42) 1.03 (0.64-1.66)
Alcohol intake (%)
Never 1.0 (Reference) 1.0 (Reference) 1.0 (Reference)
Past 0.67 (0.41-1.08) 0.85 (0.52-1.38) 0.75 (0.44-1.26)
Current 0.64 (0.43-0.96) 0.82 (0.54-1.23) 0.79 (0.51-1.22)
Physical activity (%)
Mild 1.0 (Reference) 1.0 (Reference) 1.0 (Reference)
Moderate 0.84 (0.53-1.34) 0.85 (0.53-1.35) 0.92 (0.56-1.50)
Vigorous 0.65 (0.34-1.24) 0.70 (0.37-1.35) 0.71 (0.35-1.42)
Depressive disorder (%)
No 1.0 (Reference) 1.0 (Reference) 1.0 (Reference)
Yes 1.71 (0.95-3.05) 1.58 (0.88-2.84) 1.18 (0.63-2.21)
Table 3. Odds ratio (OR) and 95% conidence intervals (95% CI) showing sociodemographic and clinical risk factors associated with lifetime occurrence of cholecystectomy among ELSA-Brasil participants at the São Paulo research center
DISCUSSION
In summary the prevalence of cholecystectomy in the baseline examination was 2.8% (3.6% among women and 1.8% among men). he frequency of cholecystectomy over the irst two years of follow-up was 1.2% (1.7% among women and 0.6% among men). he lifetime prevalence of cholecystectomy was 4% (5.3% among women and 2.4% among men) We found that female sex, indig-enous ethnicity and high BMI values were associated with cho-lecystectomy performed during the irst two years of follow-up. For lifetime cholecystectomy (cholecystectomy before and ater follow-up), positive associations were found with age, female sex, diabetes and bariatric surgery. East Asian ethnicity and dyslipid-emia were protective factors against cholecystectomy among the ELSA-Brasil participants. No association was found between cho-lecystectomy and previously known risk factors for women such as previous pregnancy, parity or age within the fertile stratum (35 to 49 years), with regard to either lifetime cholecystectomy or its occurrence during the irst two years of follow-up.
Some studies conducted in other countries have investigated the frequency of cholecystectomy in apparently healthy populations. A cross-sectional study in Taiwan evaluated 2,386 healthy adults and
reported that the prevalence of cholecystectomy was 1.3%.11 A
cross-sectional analysis within the German Study of Health in Pomerania (SHIP) cohort evaluated 4,202 subjects aged 20-79 years and found that the prevalence of previous cholecystectomy before enrollment in
the study cohort was 11.1%.24 In Italy, Barbara et al.25 evaluated 1,911
people aged 18 to 65 in the township of Sirmione and found that the prevalence of previous cholecystectomy was 4.1%. A German study with 2,147 participants aged 10 to 65 years found a prevalence of
3.9%.26 Only one Brazilian study evaluated the frequency of
chole-cystectomy, in a sample of 1,000 apparently healthy men (479) and
women (521), and it reported a frequency of 2.9%,4 i.e. similar to
the frequency of cholecystectomy in our sample before enrollment in ELSA-Brasil. he results from the present study were similar to those of this previous Brazilian study, but were higher than those of the Taiwan study and lower than the prevalence in Europe, especially compared with the SHIP study, which yielded signiicantly higher prevalence than the other studies. Considering the lifetime preva-lence of cholecystectomy, our results are similar to the European data, except for the SHIP study.
Although data on the prevalence of cholecystectomy world-wide is available, data on its incidence is very scarce. Maclure
et al.8 evaluated the incidence of cholecystectomy in women in
the Nurses’ Health Study and found 433 new cases in a 4-year
fol-low-up among 88,837 women aged 34 to 59 years.8 As we did not
yet have the estimate of person-years from the ELSA-Brasil sur-vey, in this present study we chose to use logistic models and the frequency of cholecystectomy over the irst two years of follow-up, rather than the Cox proportional hazards model, to calculate the incidence of cholecystectomy in the sample.
One important limitation in our analysis is that we did not have information about the presence of gallstones, since in the
Cholecystectomy Females
n = 43 (%)
Males
n = 13 (%) P-value
Elective 35 (81.4) 5 (38.5)
0.14
Emergency 8 (18.6) 8 (61.5)
Laparoscopic 42 (97.7) 11 (84.6)
0.07
Open 1 (2.3) 2 (15.4)
Table 4. Type of cholecystectomy during the irst two years of follow-up according to sex.
Risk factors
Clinical Crude Adjusted for age and sex Multivariate adjusted||
Bariatric surgery (%)
No 1.0 (Reference) 1.0 (Reference) 1.0 (Reference)
Yes 8.92 (2.82-28.29) 7.99 (2.46-25.93) 5.37 (1.53-18.82)
Female participants only Previous pregnancy (%)
No 1.0 (Reference) 1.0 (Reference) 1.0 (Reference)
Yes 1.48 (0.91-2.40) 1.46 (0.90-2.37) 1.33 (0.80-2.23)
Parity (%)
0 1.0 (Reference) 1.0 (Reference) 1.0 (Reference)
1–3 2.60 (0.81-8.31) 2.67 (0.83-8.56) 2.09 (0.64-6.79)
≥ 4 3.02 (0.87-10.51) 2.61 (0.75-9,13) 1.74 (0.48-6.36)
Fertility age category (%)
≤ 49 years 1.0 (Reference) 1.0 (Reference) 1.0 (Reference)
> 49 years 1.32 (0.93-1.88) 0.75 (0.46-1.23) 0.91 (0.47-1.77)
Table 3. Continues...
*Mean (standard deviation); †Adjusted for sex; ‡Multivariate adjustment for all sociodemographic variables; §Adjusted for age; ||Multivariate adjustment for age,
ELSA-Brasil survey, we did not perform complete ultrasound scans with decubitus changes in order to look for gallstones. Our main objective was to evaluate the presence of signs of fatty liver disease in the sample, and our protocol focused on including the gallbladder, whenever possible, as one anatomical landmark in the liver images acquired. In this way, we gathered information on whether the gallbladder was present or not when we acquired the image of the right liver lobe, in the same position for all par-ticipants who underwent ultrasound measurements.
As stated previously by Pedersen et al.,27 the prevalence of
cho-lecystectomy does not exactly relect the prevalence of gallstones. here are also other factors involved, such as increased frequency of symptomatic gallstones, better access to health services, avail-ability of ultrasound examination or a lowered clinical threshold for gallbladder surgery, which could afect this relationship.
Another limitation of the present study in relation to calculat-ing the incidence of cholecystectomy was that the length of follow-up was too short to evaluate the risk of new cases of cholecystec-tomy based on risk factors identiied at the baseline examination.
Our results showed that the main risk factors associated with cholecystectomy ater the baseline examination of this study were female sex, indigenous ethnicity and high BMI. On analyzing all the cases of cholecystectomy together, we also found associations with age, higher frequency of being diabetic and previous bariatric surgery.
Aging is associated with gallstones in all racial groups,28 and in
both sexes.25,29 Most studies also showed higher frequencies of
gall-stones and cholecystectomy among women than among men.25,29
Everhart et al.10 used data from the NHANES III study to evaluate
the frequencies of gallstones and surgery to treat gallstones among men and women according to race. hey found that among men, the frequency of surgery was around 25 to 35% of the total frequency of gallstones, while among women, this frequency was around 40 to 50%, and neither of these results was related to race. However in the same sample, among Mexican-Americans, more than 50% of the
women underwent surgery.10 A possible explanation for the
condi-tion that women are more afected by gallstones than men may be related to the use of estrogen. It has been demonstrated that parity is
an important risk factor for gallbladder disease.30
Interestingly, in our sample, we did not ind any relation-ship between cholecystectomy and previous pregnancy, parity or the fertile period (from 35 to 49 years of age among women). It is likely that these risk factors have lost their importance over recent years. Fertility rates are progressively declining in Brazil, especially in the state of São Paulo. It is possible that a progressive decline in fertility rates could decrease the impact of parity on gallbladder disease and cholecystectomy in this state. However,
Walcher et al.26 did not ind any association between parity and
cholecystectomy in Germany in 2005.
Even the association with age does not seem as important now as it once was. In relation to the lifetime prevalence of cholecys-
tectomy, there was a positive association, but if the analysis was restricted to the irst two years of follow-up, we found that there was no association between cholecystectomy and aging. However, it is possible that we did not have suicient statistical power because of the low number of cases.
Ethnicity is another very important risk factor. he high-est prevalence of cholelithiasis occurs among North American Indians, such that 73% of female Pima Indians over the age of
30 years are afected,31 with high rates among other American and
Canadian Indians.32 Although few studies have been published,
South American Indians have a similarly high prevalence of gall-bladder disease. In Chile, the native Mapuche Indians demon-strate this elevated occurrence: 49.4% among women and 12.6% among men (> 60% among women in their ities). he frequency is lower among Chilean Hispanics with lesser degrees of American
Indian admixture: 36.7% among women and 13.1% among men.33
he prevalence of gallstones among Mexican-Americans is also a direct function of the degree of Amerindian admixture. White
Americans have somewhat lower prevalence.10 his is the irst
Brazilian study to show an association between indigenous ethnic-ity and higher risk of cholecystectomy, thus showing that this high prevalence among Indians is also valid for Brazil. In our sample, we also observed that East Asian ethnicity was a protective factor against cholecystectomy. his is corroborated by the study by Liu
et al.11 in Taiwan, which found a very low prevalence of 1.3%.
It is interesting that presence of diabetes was also a signiicant factor when considering all the cases of cholecystectomy. here is no clear explanation in the literature for a higher frequency of gallstones among diabetics. However, gallbladder disease and
diabetes have a very important common risk factor, obesity,34 and
its efect is stronger among women than among men. Diabetes, abdominal obesity and gallstones appear to be linked through
metabolic syndrome.35,36 Liu et al.11 also reported an association
between cholecystectomy and type 2 diabetes.
In our study, dyslipidemia was protective against gallbladder surgery. his is probably because our deinition of dyslipidemia included LDL-cholesterol < 130 mg/dl and/or use of statins. Use of statins was described in a previous study as a protective factor
against cholelithiasis.37 Interestingly, we found that the
associa-tion between depressive disorders and cholecystectomy showed borderline signiicance (P = 0.08) among participants undergo-ing surgery ater baseline, and P = 0.07 for all participants who had cholecystectomy. It is possible that we did not have suicient statistical power for the analysis, but this can be investigated in the future with a longer follow-up period.
factor for cholesterol gallstone formation.1 Sludge and gallstones develop following bariatric surgery on extremely obese
individ-uals in as many as 25–35% of the cases,2 usually during the irst
six weeks ater surgery, when the weight loss is most profound.38
In the present study, laparoscopic surgery was the main method used for cholecystectomy and most of the operations were elective procedures. Laparoscopic cholecystectomy has been the current surgical standard for most diseases of the
gall-bladder over the past three decades.39,40 It was no surprise that
we found results similar to previous indings39,40 in a sample with
better access to health services than the general population in Brazil. A study at the University of Michigan Medical Center investigated 772 patients who underwent cholecystectomy and found that the frequency of laparoscopic surgery (77.8%) was
higher than that of open cholecystectomy (5.7%).41 A study using
the database of the Health Care Utilization Project — Nationwide Inpatient Sample (HCUP-NIS) analyzed 358,091 patients who underwent cholecystectomy procedures from 1999 to 2006. he authors of this study reported that laparoscopic surgery was per-formed more frequently than open cholecystectomy, and that there was a gradual increase in laparoscopic surgery across all
age groups (≥ 18 years) during this period.42
Our study has some strengths. It had a large sample of appar-ently healthy men and women with detailed information about the risk factors that may be associated with cholecystectomy. Only one Brazilian study evaluated the frequency of cholecys-tectomy worldwide assessed samples that did not have previous
complaints associated with gallbladder stones.4 Our study also
has some limitations. It was a cross-sectional analysis and there-fore only allowed assessment of associations, rather than causal-ity. We only had information about the frequency of cholecystec-tomy, without any information about cholelithiasis, unlike other studies that evaluated both of these factors.
CONCLUSIONS
In conclusion, the frequency of lifetime cholecystectomy was similar to values that have previously been published in stud-ies worldwide. As in other countrstud-ies, most of the surgerstud-ies were laparoscopic procedures. Female sex and high BMI values con-tinue to be risk factors, but others, such as parity and fertile age, lost signiicance, while new factors such as bariatric surgery and indigenous Brazilian ethnicity are gaining importance.
REFERENCES
1. Shafer EA. Epidemiology and risk factors for gallstone disease: has the paradigm changed in the 21st century? Curr Gastroenterol Rep. 2005;7(2):132-40.
2. Shafer EA. Gallstone disease: Epidemiology of gallbladder stone disease. Best Pract Res Clin Gastroenterol. 2006;20(6):981-96.
3. Aerts R, Penninckx F. The burden of gallstone disease in Europe. Aliment Pharmacol Ther. 2003;18 Suppl:49-53.
4. Coelho JC, Bonilha R, Pitaki SA, et al. Prevalence of gallstones in Brazilian population. Int Surg. 1999;84(1):25-8.
5. Kang JY, Ellis C, Majeed A, et al. Gallstones--an increasing problem: a study of hospital admissions in England between 1989/1990 and 1999/2000. Aliment Pharmacol Ther. 2003;17(4):561-9.
6. Nenner RP, Imperato PJ, Rosenberg C, Ronberg E. Increased cholecystectomy rates among Medicare patients after the introduction of laparoscopic cholecystectomy. J Community Health. 1994;19(6):409-15. 7. Maringhini A, Ciambra M, Baccelliere P, et al. Biliary sludge and
gallstones in pregnancy: incidence, risk factors, and natural history. Ann Intern Med. 1993;119(2):116-20.
8. Maclure KM, Hayes KC, Colditz GA, et al. Weight, diet, and the risk of symptomatic gallstones in middle-aged women. N Engl J Med. 1989;321(9):563-9.
9. Sandler RS, Everhart JE, Donowitz M, et al. The burden of selected digestive diseases in the United States. Gastroenterology. 2002;122(5):1500-11.
10. Everhart JE, Khare M, Hill M, Maurer KR. Prevalence and ethnic diferences in gallbladder disease in the United States. Gastroenterology. 1999;117(3):632-9.
11. Liu CM, Tung TH, Chou P, et al. Clinical correlation of gallstone disease in a Chinese population in Taiwan: experience at Cheng Hsin General Hospital. World J Gastroenterol. 2006;12(8):1281-6.
12. Aquino EML, Barreto SM, Bensenor IM, et al. Brazilian Longitudinal Study of Adult Health (ELSA-Brasil): objectives and design. Am J Epidemiol. 2012;175(4):315-24.
13. Lotufo PA. [Setting up the longitudinal study for adult health (ELSA-Brasil)]. Rev Saude Publica. 2013;47 Suppl 2:3-9.
14. Schmidt MI, Duncan BB, Mill JG, et al. Cohort Proile: Longitudinal Study of Adult Health (ELSA-Brasil). Int J Epidemiol. 2015;44(1):68-75. 15. Bensenor IM, Griep RH, Pinto KA, et al. Rotinas de organização de
exames e entrevistas no centro de investigação ELSA-Brasil [Routines of organization of clinical tests and interviews in the ELSA-Brasil investigation center]. Rev Saude Publica. 2013;47(suppl 2):37-47. 16. Goulart AC, Oliveira IR, Alencar AP, et al. Diagnostic accuracy of a
noninvasive hepatic ultrasound score for non-alcoholic fatty liver disease (NAFLD) in the Brazilian Longitudinal Study of Adult Health (ELSA-Brasil). Sao Paulo Med J. 2015;133(2):115-24.
17. Chor D, Alves MGM, Giatti L, et al. Questionario do ELSA-Brasil: desaios na elaboracao de instrumento multidimensional [Questionnaire development in ELSA-Brasil: challenges of a multidimensional instrument]. Rev Saude Publica. 2013;47(supl. 2):27-36.
18. Lohman TG, Roche AF, Martorell R. Anthropometric standardization reference manual. Champaign: Human Kinetics Publishers; 1988. 19. World Health Organization. Physical status: the use and interpretation
20. Mill JG, Pinto K, Griep RH, et al. Aferições e exames clínicos realizados nos participantes do ELSA-Brasil [Medical assessments and measurements in ELSA-Brasil]. Rev Saude Publica. 2013;47(supl. 2):54-62.
21. Lewis G, Pelosi AJ, Araya R, Dunn G. Measuring psychiatric disorder in the community: a standardized assessment for use by lay interviewers. Psychol Med. 1992;22(2):465-86.
22. World Health Organization. International Statistical Classification of Diseases and Related Health Problems. 10th Revision. Geneva:
World Health Organization; 2010. Available from: http://www.who. int/classifications/icd/ICD10Volume2_en_2010.pdf. Accessed in 2016 (Mar 3).
23. Barreto SM, Ladeira RM, Bastos MSCBO, et al. Estratégias de identiicação, investigação e classiicação de desfechos incidentes no ELSA-Brasil [ELSA-Brasil strategies for outcome identiication, investigation and ascertainment]. Rev Saude Publica. 2013;47(supl. 2):79-86.
24. Völzke H, Baumeister SE, Alte D, et al. Independent risk factors for gallstone formation in a region with high cholelithiasis prevalence. Digestion. 2005;7(2):97-105.
25. Barbara L, Sama C, Morselli-Labate AM, et al. A population study on the prevalence of gallstone disease: the Sirmione study. Hepatology. 1987;7(5):913-7.
26. Walcher T, Haenle MM, Kron M, et al. Pregnancy is not a risk factor for gallstone disease: results of a randomly selected population sample. World J Gastroenterol. 2005;11(43):6800-6.
27. Pedersen G, Hoem D, Andrén-Sandberg A. Inluence of laparoscopic cholecystectomy on the prevalence of operations for gallstones in Norway. Eur J Surg. 2002;168(8-9):464-9.
28. Chen CY, Lu CL, Huang YS, et al. Age is one of the risk factors in developing gallstone disease in Taiwan. Age Aging.1998;27(4):437-41. 29. The epidemiology of gallstone disease in Rome, Italy. Part I. Prevalence
data in men. The Rome Group for Epidemiology and Prevention of Cholelithiasis (GREPCO). Hepatology. 1988;8(4):904-6.
30. Attili F, Capocaccia L, Carulli N, et al. Factors associated with gallstone disease in the MICOL experience. Multicenter Italian Study on Epidemiology of Cholelithiasis. Hepatology. 1997;26(4):809-18. 31. Sampliner RE, Bennett PH, Comess LJ, Rose FA, Burch TA. Gallbladder
disease in pima indians. Demonstration of high prevalence and early onset by cholecystography. N Engl J Med. 1970;283(25):1358-64. 32. LaMont JT, Smith BF, Moore JR. Role of gallbladder mucin in
pathophysiology of gallstones. Hepatology. 1984;4(5 Suppl):51S-56S. 33. Miquel JF, Covarrubias C, Villaroel L, et al. Genetic epidemiology of
cholesterol cholelithiasis among Chilean Hispanics, Amerindians, and Maoris. Gastroenterology. 1998;115(4):937-46.
34. Friedman LS, Roberts MS, Brett AS, Marton KI. Management of asymptomatic gallstones in the diabetic patient. A decision analysis. Ann Intern Med. 1988;109(11):913-9.
35. Diehl AK, Stern MP, Ostrower VS, Friedman PC. Prevalence of clinical gallbladder disease in Mexican-American, Anglo, and black women. South Med J. 1980;73(4):438-41, 443.
36. Hanis CL, Hewett-Emmett D, Kubrusly LF, et al. An ultrasound survey of gallbladder disease among Mexican Americans in Starr County, Texas: frequencies and risk factors. Ethn Dis. 1993;3(1):32-43. 37. Tsai CJ, Leitzmann MF, Willett WC, Giovannucci EL. Statin use
and the risk of cholecystectomy in women. Gastroenterology. 2009;136(5):1593-600.
38. Yang H, Petersen GM, Roth MP, Schoenield LJ, Marks JW. Risk factors for gallstone formation during rapid loss of weight. Dig Dis Sci. 1992;37(6):912-8.
39. A prospective analysis of 1518 laparoscopic cholecystectomies. The Southern Surgeons Club. N Engl J Med. 1991;324(16):1073-8. 40. Keus F, de Jong JA, Gooszen HG, van Laarhoven CJ. Laparoscopic
versus open cholecystectomy for patients with symptomatic cholecystolithiasis. Cochrane Database Syst Rev. 2006;(4):CD006231. 41. To KB, Cherry-Bukowiec JR, Englesbe MJ, et al. Emergent versus
elective cholecystectomy: conversion rates and outcomes. Surg Infect (Larchmt). 2013;14(6):512-9.
42. Dua A, Aziz A, Desai SS, McMaster J, Kuy SR. National Trends in the Adoption of Laparoscopic Cholecystectomy over 7 Years in the United States and Impact of Laparoscopic Approaches Stratiied by Age. Minim Invasive Surg. 2014;2014:635461.
Acknowledgements: The authors wish to thank the ELSA-Brasil participants who agreed to collaborate in this study, as well as the ELSA-Brasil research team for their contribution
Sources of funding: The study was supported by the Brazilian Ministry of Health (Department of Science and Technology), Ministry of Science, Technology and Innovation, and National Council for Scientiic and Technological Development (CNPq)
Conlict of interests: None
Date of irst submission: December 3, 2015
Last received: February 6, 2016
Accepted: February 13, 2016
Address for correspondence: Isabela Martins Bensenor
Hospital Universitário — Universidade de São Paulo 3o andar — Centro de Pesquisa Clínica e Epidemiológica
Avenida Lineu Prestes, 2.565 São Paulo — São Paulo — Brazil CEP 05508-000