www.eerp.usp.br/rlae
Corresponding Author: Janete de Souza Urbanetto Av. Ipiranga, 6681, Prédio 12 Bairro: Partenon
CEP: 90619-900, Porto Alegre, RS, Brasil E-mail: [email protected]
Workplace stress in nursing workers from an emergency hospital: Job
Stress Scale analysis
1Janete de Souza Urbanetto
2Priscila Costa da Silva
3Eveline Hoffmeister
4Bianca Souza de Negri
3Bartira Ercília Pinheiro da Costa
5Carlos Eduardo Poli de Figueiredo
6This study identifies workplace stress according to the Job Stress Scale and associates it with
socio-demographic and occupational variables of nursing workers from an emergency hospital.
This is a cross-sectional study and data were collected through a questionnaire applied to 388
nursing professionals. Descriptive statistics were applied; univariate and multivariate analyses
were performed. The results indicate there is a significant association with being a nursing
technician or auxiliary, working in the position for more than 15 years, and having low social
support, with 3.84, 2.25 and 4.79 times more chances of being placed in the ‘high strain job’
quadrant. The study reveals that aspects related to the workplace should be monitored by
competent agencies in order to improve the quality of life of nursing workers.
Descriptors: Stress, Physiological; Occupational Health; Surveillance of the Workers Health;
Nursing.
1 Paper extracted from Doctoral Dissertation “Estresse no trabalho e hipertensão arterial em trabalhadores de enfermagem de um hospital de pronto
socorro”, presented to Faculdade de Enfermagem Fisioterapia e Nutrição, Pontifícia Universidade Católica do Rio Grande do Sul, Porto Alegre, RS, Brazil.
2 RN, Ph.D. in Health Sciences, Adjunct Professor, Faculdade de Enfermagem Fisioterapia e Nutrição, Pontifícia Universidade Católica do Rio Grande do Sul,
Porto Alegre, RS, Brazil. E-mail: [email protected].
3 Undergraduate student in Nursing, Faculdade de Enfermagem Fisioterapia e Nutrição, Pontifícia Universidade Católica do Rio Grande do Sul, Porto Alegre,
RS, Brazil. E-mail: Priscila - [email protected], Bianca - [email protected].
4 RN, Master’s student in Health Sciences, Faculdade de Enfermagem Fisioterapia e Nutrição, Pontifícia Universidade Católica do Rio Grande do Sul, Porto
Alegre, RS, Brazil. E-mail: [email protected].
5 Biologist, Ph.D. in Cellular and Molecular Biology, Adjunct Professor, Instituto de Pesquisas Biomédicas, Pontifícia Universidade Católica do Rio Grande do
Sul, Porto Alegre, RS, Brazil. E-mail: [email protected].
6 Physician, Ph.D. in Philosophy, Full Profesor, Faculdade de Medicina, Pontifícia Universidade Católica do Rio Grande do Sul, Porto Alegre, RS, Brasil. E-mail:
Estresse no trabalho da enfermagem em hospital de pronto-socorro: análise usando a Job Stress Scale
Trata-se de estudo cujo objetivo foi identiicar o estresse no trabalho, segundo a Job Stress Scale, e associá-lo aos aspectos sociodemográicos e laborais de trabalhadores de
enfermagem de um hospital de pronto-socorro. É estudo tipo transversal, cujos dados
foram coletados por meio de questionário, com 388 proissionais de enfermagem. A
análise foi realizada pela estatística descritiva, análise univariada e multivariada. Através
dos resultados identiicaram-se associação signiicativa com o cargo de técnico/auxiliar
de enfermagem, tempo no cargo superior a 15 anos e baixo apoio social, com chances
respectivas de 3,84, 2,25 e 4,79 maiores para o quadrante alto desgaste. Demonstra-se,
assim, que os aspectos relacionados ao ambiente de trabalho devem ser acompanhadas
pelos órgãos competentes no intuito de investir na qualidade de vida no trabalho da
enfermagem.
Descritores: Estresse Fisiológico; Saúde do Trabalhador; Vigilância em Saúde do
Trabalhador; Enfermagem.
Estrés en el trabajo de enfermería en hospital de emergencia: análisis usando la Job Stress Scale
Estudio que tuvo el objetivo identiicar el estrés en el trabajo, según la Job Stress Scale y asociarlo con aspectos sociodemográicos y laborales de trabajadores de enfermería de
un hospital de emergencia. Estudio de tipo transversal, cuyos datos fueron recolectados,
por medio de cuestionario, con 388 profesionales de enfermería. El análisis fue realizado
con la estadística descriptiva, análisis univariado y multivariado. Los resultados
identiicaron asociación signiicativa con el cargo de técnico/auxiliar de enfermería,
tiempo en el cargo superior a 15 años y bajo apoyo social, con chances respectivas de
3,84; 2,25 y 4,79 mayores para el cuadrante alto desgaste. El estudio demostró que los
aspectos relacionados al ambiente de trabajo deben ser acompañados por los órganos
competentes con la inalidad de invertir recursos en la calidad de vida en el trabajo de
la enfermería.
Descriptores: Estrés Fisiológico; Salud Laboral; Vigilancia de la Salud del Trabajador;
Enfermería.
Introduction
Workplace stress has been extensively studied
in recent years from different perspectives aiming to
identify its importance in the etiology of workers’ health
disorders(1-7). Among the models used to evaluate
occupational stress, as well as its implications on the
health of individuals, the Demand-Control Model stands
out(8-10). It assumes that occupational stress is a result
of imbalance between psychological demands and how
much control one has over his/her work, which can harm
the health of workers. Hence, the greater the demand
and the less control one has over his/her work, the
greater the risk an individual will become physically or
psychologically ill(9).
Control over work encompasses aspects related to
the use of intellectual skills (the extent to which the job
involves learning, repetitiveness, creativity, varied tasks,
and the development of individual special abilities) and
decision-making authority (individual ability to make
decisions over one’s own job, inluence held over a
group’s work, and managerial policies). Psychological
demand refers to psychological requirements faced
support in turn refers to issues related to relationships
established with co-workers and bosses(8-10).
The dimensions ‘psychological demand’ and
‘control over job’ gave origin to the four quadrants of
the Demand-Control Model: ‘high strain jobs’, ‘active
jobs’, ‘passive jobs’, and ‘low strain jobs’. The quadrants
‘low strain jobs’ and ‘active jobs’ are reported by the
author as the ones having the lowest association with
a risk of becoming sick, while the ‘high strain jobs’ and
‘passive jobs’ are those most associated with such a
risk(8-10).
Many studies have sought associations between
high strain jobs according to the Demand-Control
Model and health disorders. Hypertension(3,7), minor
psychological disorders(1-2) and musculoskeletal pain(5)
are among the main studied disorders; many of these
studies have found positive association between such
disorders and high strain.
Two studies involving public institutions, both
Brazilian(3) and international(11), which used the
Demand-Control Model, report the possibility that job stability
affects the perception of workers; requirements accruing
from the work process may be minimized given their
perception.
Even though studies addressing health disorders
in nursing workers have considerably developed in
recent years, the relationship of such disorders with
stressing factors in the workplace still requires greater
clariication. In this context, identifying the proile of
nursing professionals working in emergency hospital
services in relation to their perceptions concerning
psychological demands and control over their jobs can
support the planning and implementation of actions
toward a better quality of life and quality of life at work,
both on the part of nursing workers and managers of
health facilities.
In this context and following the line of investigation
of other studies, this study identiies occupational stress through the Job Stress Scale (JSS) and veriies its
association with socio-demographic and occupational
aspects of emergency service nursing workers.
Method
This cross-sectional study was conducted at a
hospital emergency service in the southern region of
Brazil. The studied population was composed of nursing
workers (nurses, nursing technicians and auxiliaries)
from the nursing service of this facility, totaling 606
workers. The target population was invited to voluntarily
participate through posters hung in care areas and in
meetings speciic to each ield.
A total of 185 workers were excluded from the
study. These comprised all temporary workers, those
working at the facility for less than one year, those on
leave (sick leave, maternity leave, personal problems,
etc.), or formally occupying a managerial position and
also those who worked in ields providing indirect care
to patients. Of the 421 workers who met the inclusion
criteria, 33 (7.8%) did not agree to participate in
the study. Therefore, the sample was composed of
388 (92.2%) nursing workers, in a non-probabilistic
convenience sample.
Data were collected through interviews and
questionnaires from February to June, 2010. To evaluate
occupational stress, the short version(9) of the
Demand-Control Model instrument was used, the Job Stress Scale,
which was translated and validated in Brazil(10). This version has 17 questions, ive to evaluate psychological
demand at work (scores ranging from 5 to 20), six
questions to evaluate control over job (scores from 6 to
24), and another six questions to evaluate social support
(scores ranging from 6 to 24)(8-10).
The demand-control quadrants were deined based
on analyses of the dimensions ‘psychological demand’
and ‘control over job’. Each dimension generated a score that resulted from the sum of scores obtained by each
of the questions and was then classiied as “low” or “high” after normal distribution was conirmed through averaging. Low demand (score ≤15) or high demand (score ≥16) was deined with an average score of 14.64 (±2.4). For dimension control, low (score ≤17) or high control (score ≥18) was deined with an average score
of 16.88 (±2.3).
Based on the demand and control dimensions
(low and high), the Demand-Control quadrants were
categorized into ‘high strain jobs’ (high psychological
demand and low control); ‘active jobs’ (high
psychological demand and high control); ‘passive jobs’ (low psychological demand and low control) and
‘low strain jobs’ (low psychological demand and high
control)(8-10).
Reliability was veriied by estimating internal
consistency in the global scale and its respective
dimensions using Cronbach’s alpha coeficient: the
psychological demand reached 0.649 and the control dimension reached 0.523. In the evaluation of sub-items
in the control dimension, Cronbach’s alpha presented
greater consistency for “decision-making authority”
Other variables were considered according to two
groups: reported socio-demographic variables (ethnicity,
age, education, income, marital status, and number of
children) and occupational variables (position, weekly
workload, time in the current position, sector, social
support). The scores of social support were deined
by average and standard deviation (18.16±3.0) and
classiied either as low social support (score ≤18) or high social support (score ≥19).
The results were descriptively analyzed through
central tendency measures (average or median) and
variability (standard deviation or interquartile amplitude)
as well as absolute and relative distribution (n-%).
Symmetry of continuous distributions was evaluated by
the Kolmogorov-Smirnov test. The Chi-square test was
used to compare proportions between categories of the
same variable (univariate analysis) taking into account
the theoretical distribution of homogeneity between
the compared categories. In the contingency tables in
which at least 25% of the cell values presented expected
frequency below 5, Fisher’s exact test was used, while in
situations in which at least one variable had polytomous
characteristics, the Monte Carlo simulation was used.
To identify related factors relevant to the
demand-control quadrants, the Multinomial Logistic Regression
model was used; Odds Ratio was used to evaluate and
directly estimate the probability of an event occurring
(demand-control quadrants)(12). All the variables with a minimum level of signiicance below 0.250 were
considered in the non-adjusted logistic regression.
In the selection of variables to be excluded from the
initial model, the likelihood ratio test (-2 log likelihood),
obtained through the Chi-square test, for comparisons
of the explicative variables and the dependent variable
(demand-control quadrants) was performed.
The low demand quadrant was considered to be
a reference group (lower risk of becoming ill) for the
logistic regression according to the model proposed by
Karasek and Theörell(9). Data were statistically analyzed
using the Statistical Package for Social Sciences® (SPSS)
version 17.0, Chicago, IL, USA. For decision criteria, level
of signiicance (α) was ixed at 5%. When probability was situated between 0.05 and 0.10, the level of signiicance
was considered the limit.
The research project was approved by the Ethics
Research Committee at the Pontiical Catholic University
of Rio Grande do Sul (PUCRS) (Protocol No.
OF.CEP-997/09) and the City Health Department (CEP 399
Protocol Nº 001.044987.09.9) and each participant
signed free and informed consent forms.
Results
This study’s sample (n=388) was initially evaluated
in relation to socio-demographic and occupational
aspects. The participants presented an average age of
48.3 years old (±7.2), with a minimum age of 29 years
old and a maximum of 68 years; ages between 49 to 59
years old (41.8%) were in the majority; 81.2% were
women; 58% had completed secondary school; and most
were married or lived in stable unions (56.4%). Monthly
income was not reported by 29 (7.4%) professionals;
of the 359 professionals who answered this variable,
50.6% (n=180) reported monthly per capita income up
to R$ 1,200.00*; 50% of the professionals had from two
to four family members.
In relation to occupational characteristics, the
sectors that had the largest number of workers were
Intensive Care Units (ICUs) with 39.4% (n=153), followed
by Surgical Centers with 14.4% (n=56), hospitalization
units with 23.5% (n=91), and emergency units with
22.7% (n=88). More than half of the professionals
(51.5%; n=200) reported they worked on the night shift
and most worked 12 hours per shift (75.3%; n=292).
In relation to their position, 14.9% (n=58) were
nurses and 85.1% (n=330) were nursing technicians
and auxiliaries. These professionals worked in these
positions between one and 37 years, with an average
of 15.9 years (±6.7); 54.6% of the participants worked
for 16 years or more in their position; 82.9% (n=322)
did not have an extra job. In relation to social support,
53.9% (n=209) of the professionals were classiied as
having low social support.
In relation to the psychological demand, answers
presented an average score of 14.6 (±2.4), which ranged
from 7 to 19; the number of professionals classiied as having low psychological demand was signiicantly
(p<0.001) higher.
An average score of 16.9 (±2.4) was obtained in
the dimension ‘control over work’, with minimum and
maximum scores of 8 and 22, respectively; the number
of professionals with low control was signiicantly high
(p=0.006).
Table 1 presents the dimensions ‘psychological
demand’ and ‘control’ (low and high) and the JSS
demand-control quadrants.
Job Stress Scale variables n (%)
Psychological Demand
Low Demand (↓D) 241 (62.1)
High Demand (↑D) 147 (37.9)
Control over job
Low Control (↓C) 221 (57.0)
High Control (↑C) 167 (43.0)
Demand-Control Quadrants (JSS)
Low strain (↓D ↑C) 103 (26.5)
Passive job (↓D ↓C) 138 (35.6)
Active job (↑D ↑C) 64 (16.5)
High Strain (↑D ↓C) 83 (21.4)
Table 1 – Frequency of psychological demand, control
over job and the JSS demand-control quadrants. Porto
Alegre, RS, Brazil, 2010
The socio-demographic proile of the nursing
workers classiied in the demand-control quadrants is
presented in Table 2. The variables gender, age, marital
status and per capita income were not statistically
associated with the demand-control quadrants.
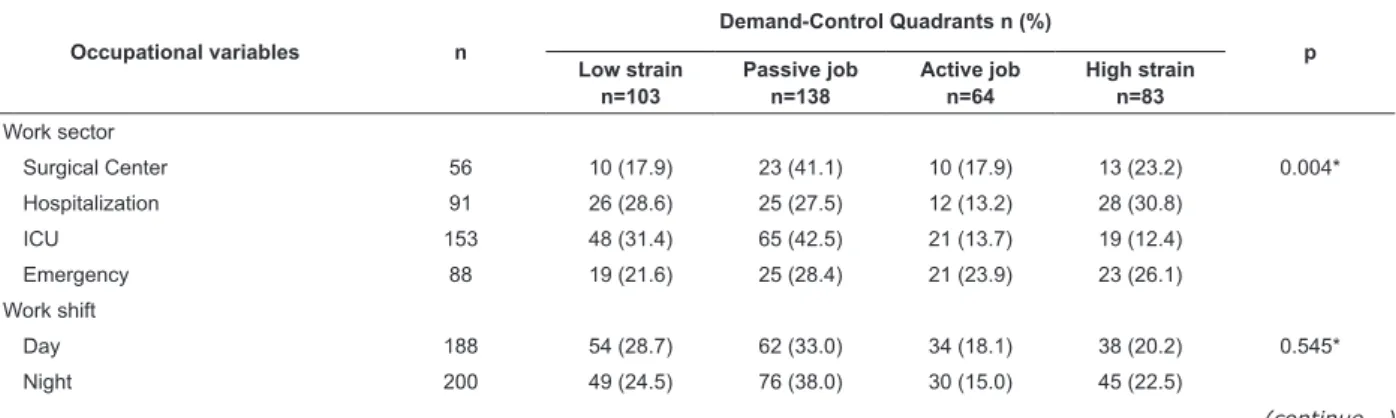
Table 3 presents the occupational proile of these workers and shows a statistically signiicant association
with work sector, position and social support. No
statistically signiicant differences were found for the
variables ‘time in the position’, ‘work shift’, and ‘extra
job’ (p>0.05).
Table 2 – Distribution of the socio-demographic variables according to the JSS demand-control quadrants. Porto
Alegre, RS, Brazil, 2010
Socio demographic variables n
Demand-Control Quadrants n (%)
p Low strain
n=103
Passive job n=138
Active job n=64
High strain n=83
Gender
Male 73 24 (32.9) 26 (35.6) 9 (12.3) 14 (19.2) 0.474*
Female 315 79 (25.1) 112 (35.6) 55 (17.5) 69 (21.9)
Age Range
From 29 to 40 years old 59 16(27.1) 21 (35.6) 9 (15.3) 13 (22.0) 0.654*
From 41 to 48 years old 153 32 (24.8) 39 (30.2) 26 (20.2) 32 (24.8)
From 49 to 59 years old 162 51 (28.5) 69 (38.5) 27 (15.1) 32 (17.9)
60 years old or older 14 4 (19.0) 9 (42.9) 2 (9.5) 6 (28.6)
Education
No bachelor’s degree 245 57 (23.3) 95 (38.8) 35 (14.3) 58 (23.7) 0.042*
Bachelor’s degree 143 46 (32.2) 43 (30.1) 29 (20.3) 25 (17.5)
Marital status
Married/stable union 219 62 (28.3) 78 (35.6) 37 (16.9) 42 (19.2) 0.617*
Single/separated/divorced/widowed 169 41 (24.3) 60 (35.5) 27 (16.0) 41 (24.3)
Per capita income
Up to R$ 1,200.00 180 43 (23.9) 70 (38.9) 25 (13.9) 42 (23.3) 0.163*
> R$ 1,200.00 179 54 (30.7) 53 (30.1) 33 (18.8) 38 (20.5)
* Pearson’s Chi-square.
Table 3 – Distribution of occupational variables according to the JSS demand-control quadrants. Porto Alegre, RS,
Brazil, 2010
Occupational variables n
Demand-Control Quadrants n (%)
p Low strain
n=103
Passive job n=138
Active job n=64
High strain n=83
Work sector
Surgical Center 56 10 (17.9) 23 (41.1) 10 (17.9) 13 (23.2) 0.004*
Hospitalization 91 26 (28.6) 25 (27.5) 12 (13.2) 28 (30.8)
ICU 153 48 (31.4) 65 (42.5) 21 (13.7) 19 (12.4)
Emergency 88 19 (21.6) 25 (28.4) 21 (23.9) 23 (26.1)
Work shift
Day 188 54 (28.7) 62 (33.0) 34 (18.1) 38 (20.2) 0.545*
Night 200 49 (24.5) 76 (38.0) 30 (15.0) 45 (22.5)
Table 3 – (continuation)
Occupational variables n
Demand-Control Quadrants n (%)
p Low strain
n=103
Passive job n=138
Active job n=64
High strain n=83
Workload
6 hours 96 27 (28.1) 34 (35.4) 17 (17.7) 18 (18.8) 0.885*
12 hours 192 76 (26.0) 104 (35.6) 47 (16.1) 65 (22.3)
Position
Nurse 58 25 (43.1) 8 (13.8) 20 (34.5) 5 (8.6) <0.001*
Technician/Auxiliary 330 78 (23.6) 130 (39.4) 44 (19.3) 78 (24.1)
Time in position
Up to 15 years old 176 55 (31.3) 66 (37.5) 23 (13.1) 32 (18.2) 0.076*
> 15 years 212 48 (22.6) 72 (34.0) 41 (64.1) 51 (61.4)
Another job
No 66 80 (24.8) 116 (36.0) 56 (17.4) 70 (21.7) 0.361*
Yes 322 23 (34.8) 22 (33.3) 8 (12.1) 13 (19.7)
Social support `
Low 209 44 (21.5) 67 (32.1) 36 (17.2) 61 (29.2) <0.001*
High 179 59 (32.4) 71 (39.7) 28 (15.6) 22 (12.3)
* Pearson’s Chi-square test.
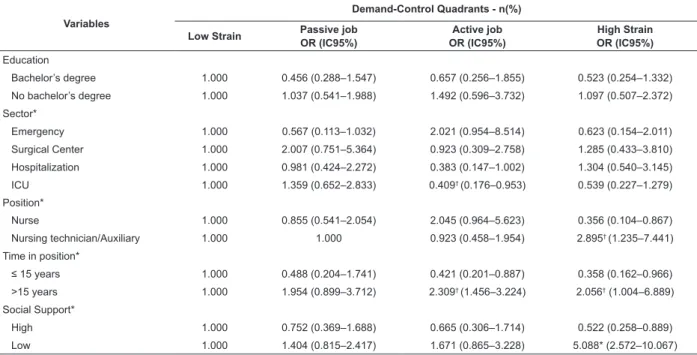
The application of adjusted and non-adjusted
logistic regression is presented in Tables 4 and 5. Table
5 presents the variables that most reliably represent
the association with demand-control quadrants.
Holding the low demand quadrant as a reference,
being a nursing auxiliary or technician, working in
the position for more than 15 years, and having low
social support were positively associated and indicated
increased chances of an individual to be classiied in the
high strain quadrant. A nursing technician or auxiliary
had a greater chance of belonging to the passive job
quadrant while workers with more than 15 years in
the position had a greater chance of belonging to the
active job quadrant; workers from hospitalization units
or ICUs had a lower risk of belonging to the active job
quadrant.
Table 4 – Association of demand-control quadrants and co-variables generated in raw regression taking low strain as
reference. Porto Alegre, RS, Brazil, 2010
Variables
Demand-Control Quadrants - n(%)
Low Strain Passive job OR (IC95%)
Active job OR (IC95%)
High Strain OR (IC95%) Education
Bachelor’s degree 1.000 0.456 (0.288–1.547) 0.657 (0.256–1.855) 0.523 (0.254–1.332)
No bachelor’s degree 1.000 1.037 (0.541–1.988) 1.492 (0.596–3.732) 1.097 (0.507–2.372)
Sector*
Emergency 1.000 0.567 (0.113–1.032) 2.021 (0.954–8.514) 0.623 (0.154–2.011)
Surgical Center 1.000 2.007 (0.751–5.364) 0.923 (0.309–2.758) 1.285 (0.433–3.810)
Hospitalization 1.000 0.981 (0.424–2.272) 0.383 (0.147–1.002) 1.304 (0.540–3.145)
ICU 1.000 1.359 (0.652–2.833) 0.409† (0.176–0.953) 0.539 (0.227–1.279)
Position*
Nurse 1.000 0.855 (0.541–2.054) 2.045 (0.964–5.623) 0.356 (0.104–0.867)
Nursing technician/Auxiliary 1.000 1.000 0.923 (0.458–1.954) 2.895† (1.235–7.441)
Time in position*
≤ 15 years 1.000 0.488 (0.204–1.741) 0.421 (0.201–0.887) 0.358 (0.162–0.966)
>15 years 1.000 1.954 (0.899–3.712) 2.309† (1.456–3.224) 2.056† (1.004–6.889)
Social Support*
High 1.000 0.752 (0.369–1.688) 0.665 (0.306–1.714) 0.522 (0.258–0.889)
Low 1.000 1.404 (0.815–2.417) 1.671 (0.865–3.228) 5.088* (2.572–10.067)
The Pseudo-R2 obtained in the application of the
raw logistic regression was 0.249 with “-2 log Likelihood”
of 605.149. The new regression in the adjusted model
presented an estimate of Pseudo-R2 of 0.328, that is, the inal model explained about 32.8% of variations
recorded by the variable ‘demand-control quadrants’.
Adequacy proved to be relevant with “-2 log Likelihood”
of 380.009, which indicates a more eficient model.
However, with this Pseudo-R2, the model does not
completely discriminate, leaving 67.2% of variations
explained by the model, which may indicate that there
are other factors not addressed in this study.
Table 5 – Association of the demand-control quadrants and co-variables generated in the adjusted regression, taking
low strain as the reference. Porto Alegre, RS, Brazil, 2010
Variations
Demand-Control Quadrants
Low Strain Passive job OR (IC95%)
Active job OR (IC95%)
High Strain OR (IC95%)
Sector*
Emergency 1.000 0.623 (0.288–1.154) 2.355 (1.551–6.225) 0.788 (0.301–2.223)
Surgical Center 1.000 1.980 (0.747–5.243) 0.898 (0.301–2.677) 1.235 (0.421–3.601)
Hospitalization 1.000 0.920 (0.400–2.113) 0.375* (0.144–0.979) 1.177 (0.495–2.797)
ICU 1.000 1.249 (0.607–2.568) 0.409† (0.178–0.940) 0.468 (0.201–1.093)
Position*
Nurse 1.000 0.489 (0.161–0.863) 0.698 (0.452–2.711) 0.418 (0.122–0.799)
Nursing auxiliary/technician 1.000 3.718* (1.987–7.611) 1.794 (0.874–3.124) 3.845† (1.745–8.665)
Time in position*
≤5 years 1.000 0.725 (0.401–2.021) 0.567 (0.118–1.007) 0.402 (0.216–0.804)
>15 years 1.000 1.813 (0.865–2.955) 2.127† (1.216–6.118) 2.254† (1.102–8.637)
Social Support*
High 1.000 0.825 (0.488–2.156) 0.504 (0.278–1.205) 0.417 (0.189–0.725)
Low 1.000 1.358 (0.794–2.322) 1.681 (0.877–3.222) 4.799* (2.456–9.377)
Estimates obtained by multivariate logistic regression analysis. *p<0.01; †p<0.05
Adjusted for education and per capita income
Discussion
Workplace stress in nursing workers from an
emergency hospital was evaluated in this study. The
results revealed that nursing technicians or auxiliaries,
individuals working for more than 15 years in the position,
and those with low social support, have a greater chance
of presenting high strain. Being a nursing technician or
auxiliary also results in a greater chance of belonging to
the passive job quadrant. Both quadrants represent a
greater risk of becoming ill.
In the analysis of the dimensions ‘psychological
demand’ and ‘control over work’, the studied group
presented a greater frequency in the passive job
quadrant (35.6%). This result suggests observation
and follow-up are required because, according to the
model, it may indicate loss of skills and interest related
to work on the part of workers(8-9). Combining with these workers those classiied as belonging to the high
strain quadrant (21.4%), we verify that a large number
of workers (57%) belong to quadrants that represent
a risk to health.
Four studies conducted in Brazil used the
Demand-Control Model in investigations addressing nursing
workers in hospital facilities. The percentages found in
the study conducted in a hospital in Bahia(1), Brazil were
lower for passive job and higher for high strain (28.4%
and 27.8% respectively), but similar if compared to
the sum of the two quadrants (56.2%). Another study
addressing nursing workers from critical units of a
hospital in Rio Grande do Sul(13), Brazil also found a
lower percentage for passive job and higher for high
strain (19.7% and 44.1% respectively); thus, 63.8% of
the workers was classiied in these quadrants.
A study conducted with nursing workers from a
public university hospital in the Midwest region of Rio
Grande do Sul(6) found a lower result for passive job and
similar to this study for high strain (29.9% and 21.2%
respectively), that is, 51.1% of the workers belonged to
quadrants that presented risk to health. The other study
addressing nursing workers from a city hospital in Rio
lower frequency of workers in the passive job and high
strain (16.6% and 17.9% respectively), or only 34.5%
of the workers belonged to quadrants that represent risk
to health.
Two international studies addressing nursing
workers also report important results. One of them,
conducted in a Korean hospital, reported a lower
percentage for passive job and higher percentage for
high strain (26.1% and 29.2% respectively), totaling
55.3% of workers in these quadrants(14). The other study
reports a greater concentration of nurses in the passive
job and high strain quadrants (32.1% and 25.8%
respectively)(15).
Another study reports that the low psychological
demand identiied among nursing workers was similar to
that found among nursing technicians and auxiliaries(6).
Such results are surprising, since the general context of
the nursing job imposes an intense job pace(16), often
generated by the excessive demand of hospitalized
patients(17). The low psychological demand of the studied
workers is linked to the fact that there are psychological
conditions such as the time to perform tasks, fewer urgent
situations, or little need to reorganize their jobs. Such a
fact may be related to aspects such as continuity of job
(nurses are present for 24 hours) and teamwork (46.1%
of the professionals reported high social support).
There was a concentration of workers in the low
control quadrant, probably because only 14.9% of the
workers were nurses. A study evaluating the dimension
‘control according to position’, revealed that 75.3%
of nurses had high control over job and 62.3% of the
nursing technicians and auxiliaries had low control(6). Low
control over job is of concern because it characterizes
a job process highly repetitive with limited autonomy
and few opportunities to learn new things. This aspect
may demotivate workers and generate low self-esteem,
which according to the authors of the Demand-Control
Model, are developments that are very harmful to
workers’ health.
Socio-demographic characteristics were not
statistically associated with the demand-control
quadrants, with the exception of the variable ‘education’.
While professionals who were college graduates
signiicantly associated with the active job and low strain
quadrants, those who did not have a bachelor’s degree
were signiicantly associated with passive jobs and high
strain. Being a nurse was also associated with the low
risk quadrants, which may be related to the educational
level previously mentioned, since this position requires
higher education.
Other studies found a positive association between
educational level and the quadrants, while nursing
professionals who it into the passive job and high strain
quadrants were mainly individuals with no bachelor’s
degrees(1,18).
The occupational characteristics statistically
associated with the demand-control quadrants were
sector (not conirmed in the logistic regression),
position, time in position, and social support. In relation
to sector, the high strain quadrant most frequently
concentrated professionals working in the hospitalization
and emergency sectors. The hospitalization unit being
classiied as high strain was a surprise, because ICUs and
the emergency sectors are usually the ones associated
with occupational stress(19-20). Another study reported
representativeness of data in ICU in the high strain
(53.0%) and passive job (51.8%) quadrants(1).
Characteristics related to work that place
hospitalization units in the same quadrant as ICUs need
to be investigated in this speciic hospital. An element to
take into account is that the number of patients cared for
by a health provider in a hospitalization unit is usually
higher than is the case in ICUs. The latter has its own
regulations concerning the maximum number of patients
to be cared for by nurses and nursing technicians and
auxiliaries.
The indings related to position corroborate the
organization of nursing work, in which actions are
distributed according to a hierarchy and complexity of
care. Nurses are responsible for planning, controlling
and evaluating the work process and manual activities
of greater complexity while nursing technicians or
auxiliaries are responsible for manual activities of lower
complexity and those prescribed by nurses(21). This fact
may explain the concentration of nurses in quadrants
that do not present harm to health (low strain and active
job) and the concentration of nursing auxiliaries and
technicians in quadrants that represent risk to health
(high strain and passive job). These data were also
found in other studies(1,6).
Working in the same position more than 15 years
was associated with the quadrant high strain, with a
2.25 times greater chance when compared to the low
strain quadrant. This fact is extremely relevant because
there are a high number of professionals working in
public facilities who remain in their positions until
they retire. Even though this study does not provide
evidence for an association between age and
demand-control quadrants, other studies associate old age
professionals working for 12 years or more in the same
position and the passive job quadrant(22). Professionals
working for more than 15 years in the same position
also presented greater chances of being classiied in the
active job quadrant, while the sectors that presented
the lower chances of being classiied as active job were
hospitalization and ICUs.
In this study, low social support presented
statistically signiicant association with the quadrant
high strain (with 4.80 times more chance than for the
low strain quadrant). It may indicate that people with
low levels of social interaction with colleagues and
bosses tend to develop health disorders as reported in
the Demand-Control Model(10). These results were also
found in another study, in which professionals in the
high strain quadrant reported low social support(1).
Relationships established in the workplace
characterize an extremely vulnerable aspect in the
context of nursing work. Relationships of subordination
(nursing technicians and auxiliaries in relation to nurses)
often include dificult and conlictive interactions since
knowledge of the work process is easily developed in
practice but responsibilities are rigidly deined in the
formalization of positions.
Conclusions
This study found associations of stress, based on the
JSS, with occupational aspects in nursing professionals
working in an emergency hospital service. Information
concerning occupational stress related to position, time
in position, and social support can be used to seek
proactive actions to minimize occupational stress and
the impact it has on the health of workers. This study
indicates factors that represent a risk to the health
of workers and can serve as a theoretical basis in the
search for preventive interventions.
Even though the model does not explain the
variations and aspects related to the object of study, this
study does present contributions relevant to nursing,
since occupational characteristics were more relevant in
the association with occupational stress, showing that
aspects related to the workplace should be monitored
by health institutions and competent bodies aiming to
invest in the quality of life of nursing workers.
Further research of a follow-up design is needed
to validate the relationship between the dimensions
‘psychological demand’ and ‘control over work’ and
occupational aspects and the health of workers. Because
this was a cross-sectional study, evidence concerning the
effective risk of health disorders of the studied workers
were limited.
Acknowledgements
We thank the managers and nursing professionals
at the studied hospital for their support that enabled this
study, Tânia S. Bosi de Souza Magnago for her attention
and clariication and also Cátia Daiane Souza Silveira for
her assistance in the data collection process.
References
1. Araújo TM, Aquino E, Menezes G, Santos CO, Aguiar L.
Aspectos psicossociais do trabalho e distúrbios psíquicos
entre trabalhadoras de enfermagem. Rev Saúde Pública.
2003;37(4):424-33.
2. Silva JLL. Estresse e transtornos mentais comuns
em trabalhadores de enfermagem [dissertação]. Rio de
Janeiro (RJ): Universidade Federal do Estado do Rio de
Janeiro; 2007. 174 p.
3. Alves MGM, Chor D, Faerstein E, Werneck GL, Lopes
CS. Estresse no trabalho e hipertensão arterial em
mulheres no Estudo Pró-Saúde. Rev Saúde Pública.
2009;43(5):893-6.
4. Schmidt DRC, Dantas RAS, Marziale MHP, Laus
AM. Estresse ocupacional entre profissionais de
enfermagem do bloco cirúrgico. Texto Contexto Enferm.
2009;18(2):330-7.
5. Magnago TSBS, Lisboa MTL, Griep RH. Trabalho
da enfermagem e distúrbio musculoesquelético:
revisão das pesquisas sobre o tema. Esc Anna Nery.
2008;12(3):560-5.
6. Magnago TSBS, Lisboa MTL, Griep RH, Zeitoune RCG,
Tavares JP. Working conditions of nurses: evaluation
based on the demand-control model. Acta Paul Enferm.
2010;23(6):811-7.
7. Juarez-Garcia A. Factores psicosociales laborales
relacionados con la tensión arterial y sintomas
cardiovasculares en personal de enfermeria en México.
Salud Pública México. 2007;49(2):109-17.
8. Karasek RA. Job demands, job decision latitude, and
mental strain: implications for job redesign. Adm Sci Q.
1979;24:285-308.
9. Karasek R, Theorell T. Healthy work: stress,
productivity and the reconstruction of working life. New
York: Basic Books; 1990.
10. Alves MGM, Chor D, Faerstein E, Lopes CS, Werneck
GL. Versão resumida da “Job Stress Scale”: adaptação para
11. Lallukka T, Lahelma E, Rahkonen O, Roos E, Laaksonen
E, Martikainen P, et al. Associations of job strain and
working overtime with adverse health behaviors and
obesity: evidence from the Whitehall II Study, Helsinki
Health Study, and the Japanese Civil Servants Study.
Soc Sci Med. 2008;66(8):1681-98.
12. Hosmer DW, Lemeshow S. Applied logistic regression.
2nd ed. New York: John Wiley; 2000.
13. Amaral TR. Dimensões psicossociais do trabalho
da enfermagem e os distúrbios psíquicos menores em
unidades críticas [dissertação]. Florianópolis (SC):
Universidade Federal de Santa Catarina – Programa de
Pós-graduação em Enfermagem; 2006. 114 p.
14. Ha M, Park J. Shiftwork and metabolic risk
factors of cardiovascular disease. J Occup Health.
2005;47(2):89-95.
15. Lee S, Colditz G, Berkman L, Kawachi I. A prospective
study of job strain and coronary heart disease in US
women. Int J Epidemiol. 2002;31(6):1147-53.
16. Gonzales RMB. Sofrimento na práxis da enfermagem:
real ou deslocado em seu sentido? Florianópolis (SC):
UFSC; 2000. 183 p.
17. O’Dwyer GO, Oliveira SP, Seta MH. Avaliação dos
serviços hospitalares de emergência do programa
QualiSUS. Ciênc Saúde Colet. 2009;14(5):1881-90.
18. Aboa-Éboulé C, Brisson C, Maunsell E, Mâsse B,
Bourbonnais R, Vézina M, et al. Job strain and risk of
acute recurrent coronary heart disease events. JAMA.
2007;298(14):1652-60.
19. Cavalheiro AM, Moura DF Junior, Lopes AC. Stress in
nurses working in intensive care units. Rev. Latino-Am.
Enfermagem. 2008;16(1):29-35.
20. Batista KM, Bianchi ERF. Stress among emergency
unit nurses. Rev. Latino-Am. Enfermagem.
2006;14(4):534-9.
21. Lei n. 7.498, de 25 de junho de 1986 (BR). Conselho
Federal de Enfermagem. Dispõe sobre a regulamentação
do exercício da Enfermagem e dá outras providências.
Diário Oficial da União. Seção I-fls. 9.273 a 9.275
[periódico na internet]. [acesso 1 maio 2011]. 26 de
junho de 1986. Disponível em: http://www.portalcofen. gov.br/sitenovo/node/4161.
22. Alves MGM. Pressão no trabalho: estresse no
trabalho e hipertensão arterial em mulheres no Estudo
Pró-Saúde [tese de doutorado]. Rio de Janeiro (RJ):
Fundação Oswaldo Cruz – Escola Nacional de Saúde
Pública; 2004. 259 p.
Received: Nov. 22nd 2010