ISSN 0104-6632 Printed in Brazil
www.abeq.org.br/bjche
Vol. 26, No. 01, pp. 33 - 43, January - March, 2009
Brazilian Journal
of Chemical
Engineering
EXPERIMENTAL AND THEORETICAL STUDY OF
POOL BOILING HEAT TRANSFER TO AMINE
SOLUTIONS
S. M. Peyghambarzadeh
1*,
M. Jamialahmadi
2, S. A. Alavi Fazel
3and S. Azizi
41Islamic Azad University, Mahshahr Branch, Fax: + (98) 1512225952, Phone: + (98) 9123241450, Mahshahr, Iran.
E-mail: [email protected]
2Petroleum University of Technology, Phone: + (98) 9163113373, Ahvaz, Iran, E-mail: [email protected]
3Islamic Azad University, Science and Research Branch, Phone: + (98) 9166137305, Tehran, Iran.
E-mail: [email protected] 4 Islamic Azad University, Mahshahr Branch,
Phone: + (98) 9113552866, Mahshahr, Iran. E-mail: [email protected]
(Submitted: March 3, 2008 ; Revised: June 20, 2008 ; Accepted: July 9, 2008)
Abstract- In this investigation, a large number of experiments have been performed to measure the nucleate boiling heat transfer coefficients of water/diethanolamine (DEA) and water/monoethanolamine (MEA) binary solutions. Based on these experimental data, effects of physical properties such as surface tension and viscosity of mixtures on nucleate boiling heat transfer coefficients and also on bubble dynamics have been discussed. Meanwhile, some photographs have also been selected which illustrate the behaviours of bubbles near the heat transfer surface. In this article, a new correlation has been developed on the basis of the correlation of Stephan and Körner which is known as a successful correlation for the prediction of nucleate boiling heat transfer coefficients of mixtures. Comparison of the prediction of this new correlation with experimental data indicates that this modification can significantly improve the performance of the Stephan and Körner correlation.
Keywords: Nucleate pool boiling; Amine solutions; Bubble; New correlation.
INTRODUCTION
Nucleate boiling has been utilized extensively in industry because it is one of the most efficient modes of heat transfer, particularly in high-energy-density systems such as nuclear reactors, power plants, electronics packaging and the like. Scientific research into boiling and the industrial usage spans over several past decades. Starting from the pioneering paper of Nukiyama (1934), widespread data have accumulated from experimental studies dealing with a diverse array of conditions. Heat transfer in boiling is one of the most challenging
fields of contemporary heat transfer research. Despite extensive research, a complete understanding of boiling is still lacking, even for many simple cases. This may be due to the fact that, in addition to the thermo-physical properties of the fluid, many parameters such as surface condition, mass transfer effect, presence of impurities and deposition of foreign materials on the heat transfer surface are inherent factors that influence bubble generation (Jamialahmadi et al, 2008).
inorganic mixtures, which has considerable practical significance. Nucleate pool boiling of liquid mixtures finds many applications in chemical and petrochemical process industries, principally the processes involving the boiling of multicomponent liquid mixtures. Recent interest in these as working fluids in thermal power plants and refrigeration systems is growing because of their potential to reduce available energy loss in heat exchanges (Fujita and Bai, 1997).
EXPERIMENTAL APPARATUS, PROCEDURE AND CHEMICALS
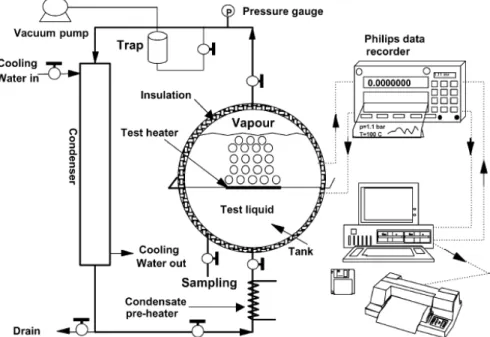
The complete pool boiling apparatus is shown in Figure 1. The apparatus consists of a cylindrical stainless steel tank containing 38 liters of test liquid and a vertical condenser to condense the evaporated liquid with tap water and recycle it to the pool. The test section is mounted horizontally within the tank and can be observed and photographed through observation glasses at both sides of the tank. Tank and condenser are heavily insulated to reduce heat losses to the ambient air. The temperature in the tank is regulated by an electronic temperature controller and a variable electrical transformer in conjunction with a band heater covering the complete cylindrical outside surface. The pressure in the apparatus is monitored continuously and a pressure relief valve is installed for safety reasons. Boiling occurs at the outside of a cylindrical stainless steel test heater with a diameter of 10.67 mm, and a heated length of 99.1 mm. The test heater consists of an internally heated
stainless steel sheathed rod and four stainless steel sheathed thermocouples with an outside diameter of 0.25 mm are embedded along the circumference of the heater close to the heating surface. A PC-based data acquisition system was used to measure temperatures and heat flux. The power supplied to the test heater could be calculated from the measured current and voltage drop.
The average of five readings was used to determine the difference between wall and bulk temperature for each thermocouple. The heat transfer coefficient, h, is calculated from Equation (1):
(
s b av.)
Q h
T T
= − (1)
Initially, test section and tank were cleaned and the system connected to a vacuum pump. Once the pressure of the system reached approximately 10 KPa, the test solution was introduced. Following this, the tank band heater was switched on and the temperature of the system allowed to rise. Once the system was de-aerated it was left at the desired pressure and the corresponding saturation temperature for about three hours to obtain a homogenous condition throughout. Then, the power was supplied to the test heater (rod heater) and kept at a predetermined value. Data acquisition system, and camera or video equipment were simultaneously switched-on to record temperatures, heat flux and visual information. Some runs were repeated later to check the reproducibility of the experiments, which proved to be excellent.
Table 1: Some important physical properties of chemicals used in the experiments
Boiling Point (K)
Liquid density (kg/m3)
Surface tension (N/m)
Thermal conductivity
(W/m.K)
Heat capacity (J/kg.K)
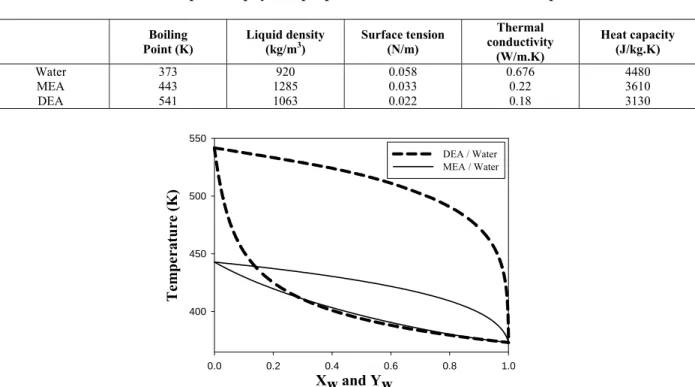
Water 373 920 0.058 0.676 4480 MEA 443 1285 0.033 0.22 3610 DEA 541 1063 0.022 0.18 3130
Xw and Yw
0.0 0.2 0.4 0.6 0.8 1.0
Te
m
p
e
ratu
re
(
K
)
400 450 500 550
DEA / Water MEA / Water
Figure 2: Bubble point and dew point curves for MEA/water and DEA/water solutions
In this investigation, MEA and DEA individually with distilled water were used as test fluids. MEA was obtained from Razi Chemical Complex in Mahshahr in a purity greater than 99% by weight and DEA was obtained from Bidboland gas refinery (the first natural gas refinery in Iran) in the purity of 85% by weight. It should be noted that these two chemicals were manufactured at the Arak Petrochemical Complex in Iran. MEA and DEA are colourless liquids which have a slightly ammonia-like odour. Some of the physical properties of pure water, MEA and DEA are shown in Table 1. These physical properties are evaluated with the aid of Aspen Plus software at atmospheric pressure and boiling point temperatures of each component. Figure 2 shows vapour-liquid equilibrium curves for MEA/water and DEA/water solutions. These were obtained using Non-random two liquids (NRTL) equation with ideal gas and Henry’s law which is known to estimate the activity coefficients of non-ideal multicomponent mixtures with good accuracy.
RESULTS AND DISCUSSION
Results for Distilled Water
Distilled water was used to check the accuracy of the experimental results and the calibration of the system for two reasons:
a) The physical properties of distilled water are well known with high accuracy.
b) Boiling heat transfer coefficient had been investigated by several investigators over a wide range of heat fluxes and system pressures with the highly accurate Gorenflo Standard Pool Boiling Apparatus (Gorenflo, 2001). All these researches agree that the Gorenflo correlation predicts the nucleate pool boiling heat transfer coefficient of distilled water with an absolute, mean and average error of less than 6%.
suggested by Gorenflo (2001). Figure 3 shows that the experimental results are in good agreement with the values predicted by this correlation.
Results for Binary Solutions
Boiling heat transfer coefficients for binary mixtures of MEA/water and DEA/water were obtained for various solution concentrations including: 3, 8, 15, 25, 36, 56, 70 and 84 wt% of less volatile components. According to the literature,
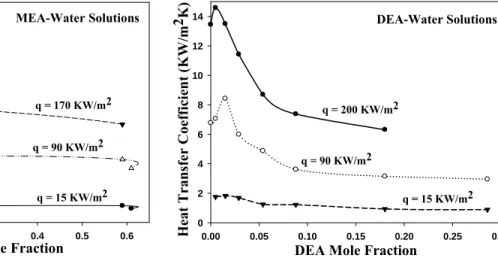
boiling curves of the liquid mixtures are found to shift to the right hand side, indicating the reduction of heat transfer compared to pure fluids (Fujita and Tsutsui, 2002, Jamialahmadi et al, 2004, Diao et al, 2006 and Zhao et al, 2008). Figure 4 and Figure 5 display the dependency of boiling heat transfer coefficient on composition at three different constant heat fluxes for MEA/water and DEA/water binary solutions, respectively. It is observed that the boiling heat transfer coefficient of liquid mixtures is less in compare to pure liquids.
Heat Flux (KW/m2)
5 6 7 8 910 20 30 40 50 60 708090100 200 300
h
(K
W/
m
2.K
)
2 3 4 5 6 7 8 9 20
1 10
Experimental Data
Prediction of Gorenflo Correlation
Figure 3: Pool boiling heat transfer coefficients of distilled water
MEA Mole Fraction
0.0 0.1 0.2 0.3 0.4 0.5 0.6
H
eat
Tr
an
sf
er
C
oe
ffi
ci
en
t
(K
W/
m
2K
)
0 2 4 6 8 10 12 14 16
MEA-Water Solutions
q = 170 KW/m2
q = 90 KW/m2
q = 15 KW/m2
DEA Mole Fraction
0.00 0.05 0.10 0.15 0.20 0.25 0.30
H
eat Tr
an
sfe
r
C
o
ef
fi
ci
en
t (K
W/
m
2K
)
0 2 4 6 8 10 12
14 DEA-Water Solutions
q = 15 KW/m2 q = 90 KW/m2
q = 200 KW/m2
Figure 4: Heat transfer coefficient of MEA/water binary mixtures against MEA mole fraction at
three different heat fluxes
Figure 5: Heat transfer coefficient of DEA/water binary mixtures against DEA mole fraction at
In the boiling of pure liquids, the liquid and vapour compositions in the liquid bulk and the vapour inside the bubble are the same and, consequently, the entire boiling process is heat transfer controlled. In contrast, during to the boiling of a multicomponent solution, the vapour-liquid phase equilibrium characteristics of the mixture allow the vapour and liquid phases to be at different compositions. Hence, as a liquid mixture evaporates on the heating surface, the vapour contains more of the light component(s). Therefore, the micro-layer is depleted in the light component(s) and enriched in heavy component(s). This results in mass diffusion of the light component(s) from the vapour to the micro-layer. Since the rate of mass diffusion is much slower than heat diffusion, mass transfer of the light component(s) to the bubble interface becomes the limiting process and a portion of the driving force is utilized in overcoming the mass transfer resistance. Therefore, to obtain a given heat flux, an additional temperature driving force is required for mixtures compared to pure liquids. Furthermore, since the light component evaporates first and the microlayer enriches in heavy component, the boiling point of the micro-layer liquid increases and, consequently, the boiling heat transfer coefficient could be reduced compared with pure water.
Figure 4 and Figure 5 also show that the addition of amine to distilled water usually causes deterioration in the heat transfer. In some cases, however, an improvement of heat transfer compared with pure water boiling under same conditions is observed in the range of low amine concentration. Such a case has also been observed by Wen et al (2006) for flow boiling of R-600a and R-290 refrigerants-oil mixtures. In their experiments, the heat transfer coefficient increased as the oil concentration increased up to 1% and then decreased with each increase in oil concentration. Reduction of surface tension by the addition of the second component could be responsible for such boiling behaviour of mixtures, but no theoretical background supporting this idea has been offered so far (Mitrovic, 1998). Thus, the composition is an important factor affecting the heat transfer process during the boiling of binary - and multicomponent - mixtures. As the composition varies, a number of physical properties characterizing the mixture also change, such as the surface tension and viscosity of the boiling mixture. Even for the same mixture composition, heat transfer reduction is not uniform for heat flux variations, with larger reductions occurring at higher heat fluxes, as can be seen in Figure 4 and Figure 5. These two characteristics regarding the influence of composition and heat flux on
heat transfer reduction were also observed more or less in other kinds of two-component mixtures investigated in the past. This could be related to non-linear variation in the mixture physical properties with composition (Vinayak Rao and Balakrishnan, 2004).
Effect of Bubble Dynamic
Bubble behaviours near the heated surface have to be studied with more attention. Our experimental apparatus incorporated the facility to take photographs of the heated surface during bubble generation. These photographs can be useful in understanding bubble behaviour near the heated surface. As can be seen in Figure 4, an extraordinary event occurs in the boiling of MEA/water binary solutions, which results in the enhancement of the heat transfer coefficient at 3 and 15 wt% MEA compared with pure water. Similar behaviour was also observed at 3 and 8 wt% DEA in DEA/water binary solutions, as shown in Figure 5.
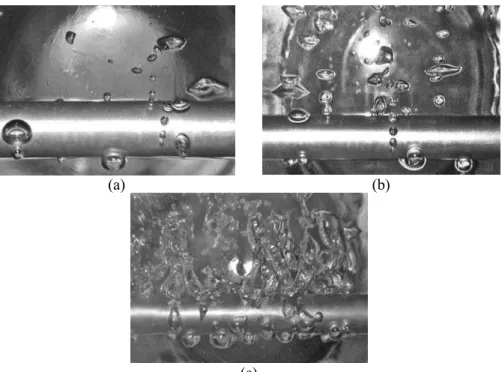
Figure 6 shows the appearance of the heat transfer surface during pool boiling of MEA solutions at different heat fluxes. At pure water or MEA concentrations of 8 wt%, especially at high heat fluxes, large hemispherical bubbles were observed and few nucleation sites are active on the heat transfer surface. Therefore, the heat transfer coefficients were lower than those of 3 and 15 wt% MEA. At MEA concentrations of 3 and 15 wt%, the large bubbles disappeared and many small, rigid bubbles were formed. Formation of these small bubbles and their subsequent release into the surrounding liquid increases convection currents around the heater and consequently the heat transfer coefficient increases. Furthermore, this heat transfer coefficient enhancement can also be explained in terms of the accumulation of amine in the cavities of the boiling surface. This excess layer reduces the surface energy between the liquid and the heat transfer surface, causing the activation of more nucleation sites and therefore a higher heat transfer coefficient.
(a) (b)
(c)
Figure 6: Comparison of bubble appearance in MEA/water solutions at different heat fluxes. (a) at 32 kW/m2 (b) at 100 kW/m2 (c) at 230 kW/m2
EFFECT OF PHYSICAL PROPERTIES
Effect of Surface Tension
Apparently, the addition of a small amount of MEA and DEA to water reduces the surface tension of the solution. Therefore, coalescence of small embryos into larger bubbles is inhibited, bubble frequency is increased, dryout on the heated surface is reduced, and the critical heat flux condition is delayed (Hahne and Grigull, 1977). Meléndez and Reyes (2006) measured the interfacial energies effects on pool boiling for combinations of aqueous ethanol mixtures and a surfactant (sodium lauryl– sulfate) and concluded that, under proper conditions, the transport of minute concentrations of a surface active substance in a pure substance, or the lower vapor-pressure substance in a binary mixture, modifies the interfacial energy and the boiling characteristics significantly. Effect of the addition of MEA and DEA to water on the surface tension of mixture has been presented in Figure 7. Since this graph has been plotted at real bulk temperatures of mixtures which are measured during the experiments, small fluctuations appear due to the strong temperature dependence of surface tension.
Effect of Viscosity
The effect of viscosity on the various phenomena related to the boiling such as bubble formation,
bubble growth and detachment, rising velocity from the heat transfer surface, and consequently the heat transfer coefficient that is related to these phenomena, has been little investigated. Most of the experiments published in the literature are concerned with fluids whose viscosity is essentially not higher than that of water. Although several relationships indeed include a viscosity term, research works verifying these relationships for highly viscous solutions are lacking. Equation (2) is one of the relations which indicates an influence of viscosity on heat transfer coefficient. The wide range of viscosity exponents (ranging from 0 to -1.4) in heat transfer relationships for pool boiling may be explained by the small range of fluid viscosities investigated up to now (Hahne and Grigull, 1977).
m n
h=const.q μ (2)
MEA and DEA wt.%
0.0 0.2 0.4 0.6 0.8
S
u
rfac
e Te
n
si
on
(N
/m
)
0.039 0.042 0.045 0.048 0.051 0.054 0.057 0.060
MEA DEA
MEA and DEA wt.%
0.0 0.2 0.4 0.6 0.8
V
is
cos
it
y (c
P
)
0.3 0.4 0.5 0.6 0.7 0.8 0.9
MEA DEA
Figure 7: Surface tension vs. concentration for MEA/water and DEA/water mixtures at real
bulk temperatures
Figure 8: Viscosity vs. concentration for MEA/water and DEA/water mixtures at
real bulk temperatures
DEVELOPMENT OF A NEW CORRELATION
Due to the very complex nature of binary mixture boiling phenomena, there is no generally accepted theoretical model for predicting the heat transfer coefficient of a mixture with satisfactory accuracy at present (Diao et al, 2006). Based on experimental and theoretical studies, Stephan and Kern (2004) evaluated heat and mass transfer phenomena in nucleate boiling of pure substances and binary mixtures. In a binary mixture, the phase equilibrium temperature is influenced by the strong gradient of concentration and thus the micro-scale heat transfer is significantly reduced.
Stephan and Körner (1969) have suggested a simple method whereby heat transfer coefficients in binary systems may be computed from data for the pure components. The method is illustrated in Figure 9. The upper part of this diagram represents an equilibrium diagram for the system A-B and shows the mole fraction of component B in the vapour phase (y) plotted against the mole fraction of component B in the liquid phase (x) for a constant pressure. The lower part of diagram shows the difference in temperature between the heating surface Tw and the bubble point Tsat(x) corresponding to a liquid composition (x). The curve of (Tw- Tsat(x)) passes through a maximum, corresponding to the maximum value of (y-x). The value of (Tw- Tsat(x)) may be expressed as;
(
Tw−T (x)sat)
= Δ + Δ = ΔTI TE T 1I(
+ Θ)
(3)in which ∆TI is the ideal value of the temperature difference and is evaluated from the values of ∆Tsat
for the two pure components A and B calculated for the same pressure and heat flux as the mixture. These wall superheat values will be denoted ∆TA and ∆TB, respectively. Then ∆TI is given by
(
)
I A B
T 1 x T x T
Δ = − Δ + Δ (4)
Stephan and Körner (1969) found that Θ in Equation (3) could be correlated against the value of (y-x). Thus:
(
)
A y x
Θ = − (5)
“A” was found to vary with pressure, and over the pressure range of 1-10 bar the following expression was used:
(
)
0
A=A 0.88 012P+ (6)
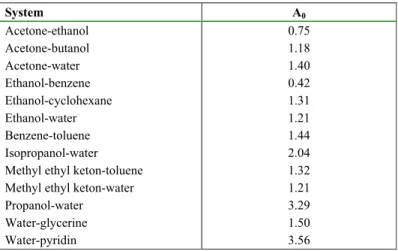
where “P” is the system pressure in bar and A0 is a constant dependent on the particular binary system studied. Values of A0 are given in Table 2 for some common systems. A value of A0 of 1.53 was recommended when no experimental data for the system under consideration are available. This method is not reliable if one of the components is strongly surface active (Stephan and Kern, 2004).
parameter, the following procedures have to be performed.
(
)(
)
id 0
h 1
h =1 A+ y−x 0.88 0.12P+ (7)
In the experiments selected for the development of a new model, total pressure was maintained constant at 1 bar. So, the value of (0.88+0.12P) is equal to unity. Thus:
(
)
id
0 h
1 A y x
h − = − (8)
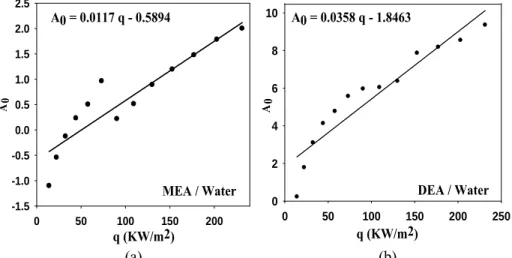
Now, if we plot the left hand side term in Equation (8) against (y-x) for each heat flux, the slopes of the lines, which are fitted by the aid of linear regression, give A0 for each heat flux, as shown in Figure 10 for MEA/water and DEA/water solutions. Since the value of A0 in the Stephan and Körner correlation (1969) varies with heat flux, we can find this dependency by means of plotting A0 against the heat flux and fitting a line to these points. This is shown in Figure 11 for MEA/water and DEA/water binary mixtures and the subsequent equations were found for A0.
Mole fraction in liquid (x)
0 1
Tw
-T
sa
t
(x
)
M
o
le
fr
a
cti
o
n
i
n
v
a
p
o
r (y
)
(y-x)
TE
TI TB
TA Δ
Δ
Δ Δ
Figure 9: The evaluation of boiling heat transfer coefficients for binary systems.
Table 2: Values of A0 for use in Equations (5) and (6) (Stephan and Kern, 2004)
System A0
Acetone-ethanol 0.75 Acetone-butanol 1.18 Acetone-water 1.40 Ethanol-benzene 0.42 Ethanol-cyclohexane 1.31 Ethanol-water 1.21 Benzene-toluene 1.44
Isopropanol-water 2.04
Methyl ethyl keton-toluene 1.32
Methyl ethyl keton-water 1.21
(yw-xw)
0.0 0.1 0.2 0.3 0.4 0.5 0.6
(
h
/
hid
) -
1
-0.8 -0.4 0.0 0.4 0.8 1.2
q4 = 150000 W/m2
q3 = 90000 W/m2
q2 = 30000 W/m2
q1 =14000 W/m2
(yw-xw)
0.0 0.1 0.2 0.3
( h
/
hid
) -
1
0.0 0.5 1.0 1.5 2.0 2.5
q1 =14000 W/m2 q4 = 150000 W/m2
q3 = 90000 W/m2
q2 = 30000 W/m2
(a) (b)
Figure 10: Plotting (h / hid) - 1 against (yw-xw) in order to find A0 in Stephan and Körner correlation, a) for MEA/water solutions, b) for DEA/water solutions
q (KW/m2)
0 50 100 150 200 250
A0
0 2 4 6 8 10
A0 = 0.0358 q - 1.8463
DEA / Water
q (KW/m2)
0 50 100 150 200
A0
-1.5 -1.0 -0.5 0.0 0.5 1.0 1.5 2.0 2.5
A0 = 0.0117 q - 0.5894
MEA / Water
(a) (b)
Figure 11: Variation of A0 in the Stephan and Körner correlation with heat flux a) MEA/water solutions b) DEA/water solutions
Therefore, in the case of MEA/water binary mixtures, the correlation of Stephan and Körner modifies to the following form:
(
)(
)( )
id
h 1
h =1+ 0.0117q 0.5894 0.88 0.12P y x− + − (9)
And for DEA/water binary mixtures this correlation changes as follow:
(
)(
)(
)
id
h 1
h =1+ 0.0358q 1.8463 0.88 0.12P y x− + − (10)
Thus, in the new correlation “A” is function of pressure and heat flux simultaneously.
COMPARISION OF RESULTS
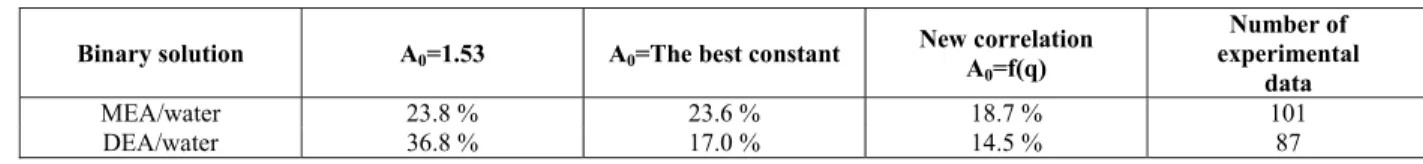
Table 3: RMS errors produced by different modifications to the Stephan and Körner correlation to predict the nucleate boiling heat transfer coefficient of mixtures
Binary solution A0=1.53 A0=The best constant
New correlation A0=f(q)
Number of experimental
data
MEA/water 23.8 % 23.6 % 18.7 % 101
DEA/water 36.8 % 17.0 % 14.5 % 87
0.5 2 n
exp,i cal,i Rms
exp,i i 1
h h
1 E
n = h
⎛ ⎛ − ⎞ ⎞
⎜ ⎟
=⎜ ⎜⎜ ⎟⎟ ⎟
⎝ ⎠
⎝
∑
⎠(11)
Data in Table 3 indicate that, when A0=1.53, the error is greater than in the other cases. It was recommended by Stephan and Körner (1969) to apply this case when no experimental data are available, but in the presence of experimental data, if A0 is considered to be a function of heat flux, the respective error is smaller than the case in which A0 is constant for each binary. It is found that A0=1.25 is the best value that minimizes predictive error for MEA/water mixtures and A0=7.1 is the best value for DEA/water mixtures. These two values can be added to Table 2 for this pair of binary mixtures.
CONCLUSION
The heat transfer to liquid mixtures of water/DEA and water/MEA was investigated over a wide range of heat flux and concentration under saturated pool boiling condition. The following conclusions were obtained:
1. It is concluded that the heat transfer coefficient enhancement occurred at low concentrations of amine solutions due to the accumulation of amine in the cavities of boiling surface. Apparently, the excess layer reduces the surface energy between the liquid and the heat transfer surface causing the activation of more nucleation sites and consequently bringing about higher heat transfer coefficients.
2. As a liquid mixture evaporates on the heating surface, the vapour contains more amounts of the light component(s). Therefore, the micro-layer is depleted in the light component(s) and enriched in heavy component(s). This results in mass diffusion of the light component(s) from the bulk to the micro-layer. Since the rate of mass diffusion is much slower than heat diffusion, mass transfer of the light component(s) to the bubble interface becomes the limiting process and a portion of the driving force is utilized in overcoming the mass transfer resistance. Besides, by evaporating light component(s), the
boiling point of the micro-layer liquid increases and, consequently, these two parameters lead to the degradation of boiling heat transfer coefficients of binary mixtures compared with pure water.
3. Analysis of images which were taken for the mechanism of bubble formation on the heat transfer surface indicates that, whenever the bubble detachment diameter is larger and the bubble frequency is higher, the heat transfer coefficient tends to be increased.
4. A new correlation was developed on the basis of the Stephan and Körner correlation to predict the nucleate boiling heat transfer coefficient of binary mixtures. In the Stephan and Körner correlation, the value of parameter “A” is dependent on pressure and the particular binary mixture, but in this new correlation the value of “A” should also be evaluated as a function of heat flux. It was shown that this modification can improve the performance of the Stephan and Körner correlation.
NOMENCLATURE
A Pressure dependent term in the Stephan and Körner correlation
A0 Constant in Stephan and Körner correlation E Error
h Heat transfer coefficient Wm-2K-1 n Number of experimental data
P Pressure bar
q Heat flux kWm-2
Q Heat flux Wm-2
T Temperature K
∆T Temperature difference K x Liquid phase mole fraction
y Vapor phase mole fraction
Superscripts and Subscripts
A Component A
av. Average
B Component B
cal. Calculated
E Excess
exp. Experimental
I Ideal
id. Ideal
Rms Root mean square
sat. Saturation
w Wall
Greek Letters
Θ a term in Equation (3)
REFERENCE
Diao, Y. H., Zhao, Y. H., Wang, Q.H., Visualization of bubble dynamics for pool boiling of binary refrigerant mixture Rll-Rll3, Chinese J. Chem. Eng., 14 (2) p. 149 (2006).
Fujita, Y., Bai, Q., Critical heat flux of binary mixtures in pool boiling and its correlation in terms of Marangoni number, Int. J. of Refrigerant, 20 (8), p. 616 (1997).
Fujita, Y., Tsutsui, M., Experimental investigation in pool boiling heat transfer of ternary mixture and heat transfer correlation, Experimental Thermal and Fluid Science, 26, p. 237 (2002).
Gorenflo, D., State of the art in pool boiling heat transfer of new refrigerants, Int. J. of Refrigeration, 24, p. 6 (2001).
Hahne, E., Grigull, U., “Heat transfer in boiling”, Hemisphere Publishing Corporation, (1977). Jamialahmadi, M., Helalizadeh, A.,
Muller-Steinhagen, H., Pool boiling heat transfer to electrolyte solutions, Int. J. of Heat and Mass
Transfer, 47, p. 729 (2004).
Jamialahmadi, M., Muller-Steinhagen, H., Abdollahi, H., Shariati, A., Experimental and theoretical studies on subcooled flow boiling of pure liquids and multicomponent mixtures, Int. J. of Heat and Mass Transfer, 51, p. 2482 (2008). Meléndez, E., Reyes, R., Interfacial energies of
aqueous mixtures and porous coverings for enhancing pool boiling heat transfer, Int. J. of Thermal Sciences, 45, p. 796 (2006).
Mitrovic, J., Nucleate boiling of refrigerant-oil mixtures: bubble equilibrium and oil enrichment at the interface of a growing vapour bubble, Int. J. of Heat and Mass Transfer, 41, p. 3451 (1998). Nukiyama, S., The maximum and minimum values
of the heat transmitted from metal to boiling water under atmospheric pressure, J. Jpn. Soc. Mech. Engrs, 37, p. 367 (1934).
Stephan, P., Kern, J., Evaluation of heat and mass transfer phenomena in nucleate boiling, Int. J. of Heat and Fluid Flow, 25, p. 140 (2004).
Stephan, K., Körner, M., Calculation of Heat Transfer in Evaporative Binary Liquid Mixtures, Chem. Ing. Tech., 41 (7), p. 409 (1969).
Vinayak Rao, G., Balakrishnan, A.R., Heat transfer in nucleate pool boiling of multicomponent mixtures, Experimental Thermal and Fluid Science, 29, p. 87 (2004).
Wen, M.-Y., Ho, C.-Y., Jang, J.-K., Boiling heat transfer of refrigerant R-600a/R-290-oil mixtures in the serpentine small-diameter U-tubes, Applied Thermal Engineering, 27, p. 2353 (2007).