Article
Printed in Brazil - ©2017 Sociedade Brasileira de Química0103 - 5053 $6.00+0.00*e-mail: [email protected]
Simultaneous Determination of Antimalarial Agents by LC-MS/MS and Its
Application to Evaluation of Fixed-Dose Tablets
Breno M. Marson, Raquel O. Vilhena, Flavia L. D. Pontes, Mário S. Piantavini and Roberto Pontarolo*
Departamento de Farmácia, Universidade Federal do Paraná, 81531-990 Curitiba-PR, Brazil
We developed and validated a liquid chromatography tandem mass spectrometry (LC-MS/MS) method to quantify the antimalarials artesunate (ARS) and mefloquine (MFQ) in fixed-dose tablets. The detection was performed by a triple-quadrupole mass spectrometer in multiple reaction monitoring (MRM) in positive ion mode via electrospray ionization. Chromatographic separation was achieved with an XBridge C18 column (50 × 2.1 mm, 5 µm), using isocratic elution (350 µL min-1) of water/acetonitrile/methanol (30:35:35, v/v/v) containing 0.1% formic acid. The
method was validated according to the International Conference of Harmonization (ICH) guidelines. The calibration curves obtained for ARS (400 to 600 ng mL-1) and MFQ (800 to 1200 ng mL-1)
showed good linearity (r2 > 0.99), precision (relative standard deviation (RSD): ARS < 2.0%; MFQ
< 1.9%), and accuracy (recoveries: ARS, 102.4-103.4%; MFQ, 97.4-101.6%), and were stable for 24 h at 8 °C. The method was successfully applied to commercial tablets, and recoveries of 98.7 ± 4.7% (ARS) and 105.6 ± 3.13% (MFQ). The method developed is a reliable alternative for public quality inspection control with the advantage of tandem mass specificity and speed.
Keywords: antimalarial, artesunate, LC-MS/MS, mefloquine, validation
Introduction
Malaria is an infectious disease caused by protozoan parasites of the genus Plasmodium.1 Several
Plasmodium species are known to infect humans, and
Plasmodium falciparum is considered the most dangerous species, since it is responsible for the most severe and fatal cases of malaria.2 Malaria is one of the most serious public
health concerns worldwide and 3.2 billion people remain at risk of being infected. In 2015, 214 million new cases of malaria and 438,000 deaths were reported.2
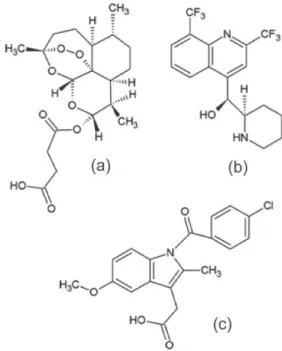
The treatment of malaria is based on targeting the lifecycle of the parasite. The World Health Organization (WHO) recommends artemisinin-based combination therapies (ACTs), such as artesunate (ARS) (C19H28O8;
384.42082 g mol-1) and mefloquine hydrochloride
(MFQ) (C17H16ClF6N2O; 414.77309 g mol-1) (Figure 1),
for the treatment of uncomplicated malaria, caused by
P. falciparum.2,3
ACTs combine two active drugs with different mechanisms of action in order to increase the spectrum of activity and effectiveness, and to prevent antimalarial
drug resistance. In an ACT, the immediate effect of an artemisinin derivative, which rapidly clears asexual blood-stage parasites and gametocytes, is combined with
a drug of a different class that has a longer half-life, thus eliminating residual parasites.4,5
One of the barriers in the fight against malaria is the increasing presence on the market of counterfeit drugs, which, in recent years, has led to the development of P. falciparum resistance to therapy.6 Antimalarials
are among the most widely administered drugs in tropical countries and have been particularly targeted by counterfeiters. The use of counterfeit drugs or substandard antimalarial drugs can cause increased morbidity, adverse effects, and mortality owing to excessive dose or presence of potentially toxic ingredients or pathogenic contaminants. Furthermore, counterfeits may contain sub-therapeutic amounts of active ingredients, which would favor the selection of resistant parasites, and thus, resistance to current antimalarial drugs.7 Hence, reliable alternatives for
public quality inspection control of antimalarial drugs may help to ensure treatment efficacy and avoid the development of resistance to antimalarial drugs.8
The design of analytical methods for quality control of pharmaceutical products should be an important research objective to ensure public health improvement. Despite the frequent use of fixed-dose combination tablets of ARS and MFQ, no method for their quality control has been described in the pharmacopoeias.9-12 Few methods for the simultaneous
quantification of drugs in pharmaceutical formulations have been published and include UV spectrophotometry,13,14
high-performance liquid chromatography (HPLC) with UV spectrophotometry detection,15,16 and high-performance thin
layer chromatography (HPTLC) with UV spectrophotometry detection.16,17
UV spectrophotometry is a simple and cost-effective analytical method; however, the presence of complex mixtures limits its use owing to the low specificity of the technique. ARS has UV maximum absorption at the beginning of the UV spectrum (200-220 nm), because of the absence of chromophores in its structure.15 In that
particular UV region, other formulation components such as preservatives and color coatings may have absorption, limiting its application to simple and specific mixtures. Additionally, counterfeit drugs may contain other chemicals not expected in the formulation.
Liquid chromatography-diode array detector (LC-DAD) methods have more advantages than UV spectrophotometry methods mainly because of the chromatographic separation of the mixture components. However, in some cases, the presence of impurities limits the chromatographic separation, making the method non-selective. It is important to note that the recommended fixed-dose ACTs contain 25 + 55 mg (pediatric) or 100 + 220 mg (adult) of ARS and MFQ, respectively.3 Considering this ratio concentration
and that MFQ has higher UV absorption than ARS, the UV signal absorption difference between MFQ and ARS can be substantial (up to 40 times). Therefore, in order to achieve good signal intensity for ARS, the MFQ signal intensity used can reach values near the upper limit of detection.18
Compared to the techniques described above, the use of liquid chromatography tandem mass spectrometry (LC-MS/MS) presents many advantages. The selectivity of tandem mass spectrometry is higher than that of UV detection even with the use of LC, and it is therefore more adequate for quality inspection control. To the best of our knowledge, no LC-MS/MS method for simultaneous determination of these drugs has been reported. Thus, the aim of the present study was to develop and validate a rapid and selective LC-MS/MS method for direct simultaneous determination of ARS and MFQ in antimalarial tablet formulations.
Experimental
Standards, chemicals reagents, and samples
The ARS standard (98.8%) was purchased from the Brazilian Pharmacopoeia (Brasília, DF, Brazil), the MFQ-hydrochloride standard (98.0%) was purchased from Sigma-Aldrich (St. Louis, MO, USA), and the internal standard (IS) indomethacin (99.4%) was purchased from Cspc Ouyi Pharma Co. Ltd. (Shijiazhuang, Hebei, China). HPLC-grade acetonitrile and methanol were purchased from Tedia (Fairfield, USA). Formic acid (99.0%) was purchased from Carlo Erba Reagenti (Rodano, Italy). Ammonium formate (97.0%) was purchased from Acros Organics (Fair Lawn, NJ, USA). Ultrapure water was obtained in-house by using a Milli-Q purification system from Millipore (Bedford, MA, USA). Fixed-dose combination tablets of ARS-MFQ were provided by Farmanguinhos/Fundação Oswaldo Cruz (Rio de Janeiro, RJ, Brazil) and contained 100 mg of ARS and 220 mg of MFQ (corresponding to 200 mg of MFQ base)
per tablet. The quantitative compositions of the excipients were not publicly available.
Stock and working standard solutions
Stock solutions (1 mg mL-1) of ARS, MFQ, and
IS were prepared by dissolving accurately weighed reference substances (with an analytical balance, accurate to ± 0.0001 g) in methanol and were stored at −40 °C.
(13 mm diameter, 0.22 µm pore size; Millipore Millex, Billerica, MA, USA) prior to injection.
Sample preparation
Ten tablets of the fixed-dose combination were crushed and an aliquot (equivalent to 25 mg of ARS and 50 mg of MFQ) was accurately weighed and transferred to a tube. Methanol (10 mL) was added to the tube and the samples were subjected to sonication for 5 min and subsequent centrifugation at 2,057 × g for 5 min. The supernatant was transferred to a 25 mL volumetric flask and this process was further repeated. The samples were spiked with the IS and the final volume was reached with methanol. One aliquot of 1 mL was diluted in water/acetonitrile/ methanol (2:1:1, v/v/v) containing 0.1% formic acid to obtain the following final concentrations: 100 ng mL-1 (IS),
500 ng mL-1 (ARS), and 1000 ng mL-1 (MFQ). The samples
were prepared under low light and filtered through a PVDF syringe filter (13 mm in diameter, 0.22 µm pore size; Millipore Millex, Billerica, MA, USA) prior to injection.
LC-MS/MS analysis
LC-MS/MS analyses were carried out in an Agilent 1200 HPLC Series (Agilent Technologies, Santa Clara, CA, USA), with a binary pump (G1312B), degasser (G1379B), thermostated column oven (G1316B), and CTC Sample Manager (Model 2777, Waters, Milford, MA, USA). The mass spectrometer coupled to the LC system was a triple quadrupole API 3200 system from Applied Biosystems MDS Sciex Instruments (Foster City, CA, USA) and was equipped with a syringe pump (Harvard Apparatus, Holliston, MA, USA). Chromatographic separation was performed on an XBridge C18 column (50 × 2.1 mm, 5 µm, Waters, Milford, MA, USA) coupled with an XBridge C18 guard column (10 × 2.1 mm, 5 µm, Waters, Milford, MA,
USA), maintained at 25 °C. The mobile phase consisted of water/acetonitrile/methanol (30:35:35, v/v/v) containing 0.1% formic acid. The isocratic flow rate was 350 µL min-1,
and the injection volume was 5 µL. The needle was washed
with 2 mL of acetonitrile/methanol (1:1, v/v) between each injection. The electrospray ionization (ESI) ion source was operated in positive ion mode with the following ion-source parameters: ion spray voltage, 5500 V; source temperature, 400 °C; nebulizer and auxiliary gas (nitrogen), 40 psi; collision activated dissociation gas (CAD), 10 psi; curtain gas (CUR), 10 psi. All analytes were evaluated in multiple reaction monitoring (MRM) mode, with a dwell time of 350 ms. Ion transitions and individual analytes parameters including the declustering potential (DP), entrance potential (EP), collision cell entrance potential (CEP), collision energy (CE), and cell exit potential (CXP) are shown in Table 1.
The high-purity nitrogen and zero-grade air used as the CUR, GS1 (nebulizer gas), GS2 (turbo gas), and CAD gases were produced using a high-purity nitrogen generator from PEAK Scientific (Chicago, IL, EUA). Data acquisition was performed with an MS Workstation using Analyst 1.4 software (MDS Sciex, Concord, Ontario, Canada).
Methodology parameters
Validation was performed in accordance with the analytical method validation guidelines of the Agência Nacional de Vigilância Sanitária (ANVISA) and the International Conference on Harmonization (ICH).19,20
Selectivity was evaluated by comparing the chromatograms of each analyte for the appearance of co-eluting peaks with the same selected transition and retention times. Additionally, selectivity was evaluated by comparing the slopes of two analytical curves. An analytical curve obtained with the standard solution was compared with another analytical curve obtained with the diluted samples spiked with the
Table 1. Summary of the monitored ions and the MS/MS operating conditions for artesunate, mefloquine, and the internal standard indometacin
Precursor ions (m/z)
Artesunate 407.0 [M + Na]+ Mefloquine 378.9 [M + H]+ Indometacin 357.9 [M + H]+
Fragment ions (m/z)
261.1a 407.0b 321.1a 271.1b 139.1a 111.1b
CE / eV 21.0 5.0 39.0 47.0 37.0 67.0
CXP / V 6.0 6.0 24.0 6.0 4.0 4.0
CEP / V 20.0 20.0 26.0 26.0 34.0 24.0
DP / V 36.0 36.0 51.0 51.0 36.0 36.0
EP / V 4.5 4.5 8.5 8.5 6.0 6.0
aFragment ion used for quantification; bfragment ion used for qualification; CE: collision energy; CXP: cell exit potential; CEP: collision cell entrance
analytes, at the same concentrations used to prepare the first curve. These curves were prepared in triplicate at concentrations of 400, 450, 500, 550, and 600 ng mL-1
(ARS), and 800, 900, 1000, 1100, and 1200 ng mL-1 (MFQ),
in the presence of 100 ng mL-1 (IS). The data was analyzed
with linear regression analysis and an analytical curve was obtained. The slopes obtained from both analytical curves were compared and analyzed using the Student’s t-test.
The matrix effect was evaluated by comparing the areas of the analytes obtained with spiked samples. The spiked samples with standard solutions were prepared as described in the selectivity study, in triplicate. The results of the comparison of the mean peak areas were expressed as percentages. Variations from 95 to 105% indicate the absence of a matrix effect. Accuracy was measured in triplicate using a recovery test. One sample was prepared at 50% of the target analyte concentration present in the tablet formulation as described in the Sample preparation section, and analyzed. The same sample was spiked with the standard solutions to obtain a concentration of 80, 100, and 120% of the target analyte concentration. The amounts of analytes recovered were calculated by subtracting the values of the analytes observed in the spiked samples from those obtained in the samples without standard addition. The percentage of recovery was calculated from the slope and the Y-intercept of the calibration curve.
Calibration curves were generated in triplicate at five different concentrations ranging from 80 to 120% of the target analyte concentration (ranges of 400-600 ng mL-1 for
ARS, 800-1200 ng mL-1 for MFQ, and all concentrations
contained 100 ng mL-1 IS). For each compound, a
calibration curve was generated to confirm the linear relationship between the analyte peak areas/IS peak areas and the analyte concentration/IS concentration. The slope, intercept, and coefficient of determination (r2) were
calculated as regression parameters by weighted (1/x) linear regression.
The repeatability and intermediate precision were determined by analyzing six samples at the target analyte concentration on two different days and the samples were prepared as described in the Sample preparation section. The repeatability measurements were conducted by the same researcher over a short period of time. The intermediate precision was determined by a second researcher, after two days. The results have been expressed as the relative standard deviation (RSD), and a Student’s t-test was performed to compare the results of the analytes in each assay.
Stability studies for ARS and MFQ included bench-top stability (at 25 °C for 6 h), and long-term stability (−40 °C
for 30 days) determination for the standard stock solutions; sample and standard solution stabilities were tested in the
Sample Manager (8 °C for 24 h). The Student’s t-test was performed to compare the results of freshly prepared sample and standard solutions with those obtained after storage at different conditions.
Results and Discussion
Method development
Analyte ionization was optimized by direct infusion of working standard solutions. The signal intensity was evaluated for each analyte by comparing the use of different mixtures of organic modifiers (acetonitrile, methanol, and water) containing different concentrations of additives (acetic acid, formic acid, and/or ammonium formate) for ion generation. Adequate signal intensity was observed for all compounds when acetonitrile/water plus 0.1% acetic acid and 5 mmol L-1 ammonium formate was used.
In the case of MFQ and IS, the generation of [M + H]+
ions was observed, while in the case of ARS, [M + NH4]+,
adduct ions were generated. This result was in accordance with what published in the literature indicating the use of ammonium adduct to quantify ARS.21-23 However, during
chromatographic optimization, no signal corresponding to the ARS [M + NH4]+ adduct ion was observed. According
to Grimalt et al.,24 sodium adducts are more stable than
ammonium adducts, owing to the strong interaction with the oxygen atoms present in the molecule. Hence, the generation of ARS [M + Na]+ adduct ion was evaluated.
The compositions of organic modifiers and additives were adjusted for better ionization and good signal stability. The results obtained for the ARS sodium adduct were satisfactory, the strongest signal intensity for all of the compounds was produced by a mixture of methanol/ acetonitrile/water (2:1:1, v/v/v) containing 0.1% formic acid. The methanol utilized as the organic modifier and present in the mobile phase contained traces of sodium that led to the formation of ARS sodium adduct ions.
Mass spectrometric parameters such as DP, EP, CEP, CE, and CXP were optimized for each analyte in positive ionization mode with automatic multiple reaction monitoring (MRM) and the two most intense fragments were selected. An exception to this was ARS, for which the precursor ion and one fragment ion were monitored because the fragments showed low signal intensity after MS/MS optimization (Table 1). Source parameters (CUR, CAD, ISV (ion spray voltage), GS1, GS2, and temperature) were optimized by flow-injection analysis (FIA), which coupled LC with MS/MS. The pump was operated at 200 µL min-1 using an isocratic
To identify the optimum chromatographic conditions, mobile phases with several combinations of acetonitrile, methanol, and water were tested. The initial experiments were conducted using a C18 column maintained at 25 °C, flow rate of 200 µL min-1, and an injection volume of
10 µL. With a mobile phase consisting of water/acetonitrile/ methanol (2:1:1, v/v/v) containing 0.1% formic acid, an extensive run time analysis was observed (> 15 min for ARS). Thus, several proportions of organic modifier were evaluated to achieve a shorter run time. In addition, the variations in the flow rate (range of 200-400 µL mL-1)
and column oven temperature (range of 25-35 °C) were investigated. The injection volume of the sample was adjusted to 5 µL for improvement of the chromatographic method. These results showed that the use of an isocratic mobile phase consisting of water/acetonitrile/methanol (30:35:35, v/v/v) containing 0.1% formic acid, eluted at 350 µL min-1, at a column oven temperature of 25 °C,
resulted in favorable peak shapes and shorter run time. Each chromatographic run was completed within 2 min. This method showed advantages over other previously published methods where the run time was 13 min, which is too long for the quantification of only two analytes.15
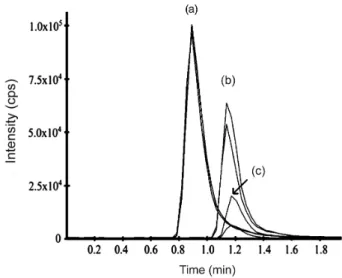
Furthermore, LC-MS/MS is not affected by the absence of good chromophore groups, which is the case for ARS. A representative chromatogram of the LC-MS/MS method is presented in Figure 2.
Method validation
Analytical figures of merit were assessed in order to evaluate the methodology developed here. For selectivity, as shown in Table 2, the slope comparison
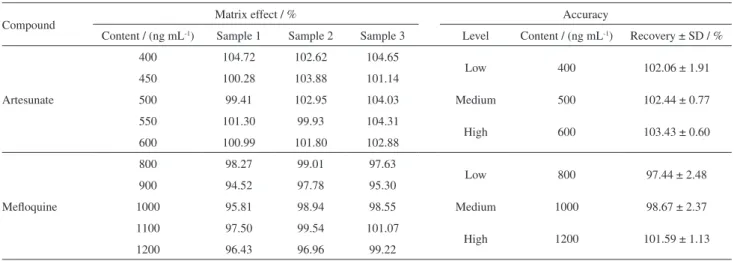
of both curves (standard solutions and spiked samples) showed no significant variation for all compounds (RSD < 5%; Student’s t-test, p > 0.05). Besides, no additional interferences were observed at the same retention time of the analytes of interest. Therefore, the selectivity of the developed method was found to be satisfactory. The matrix effect and accuracy data are shown in Table 3. The present method showed that there was no matrix effect when the results of the concentration levels were compared (95 to 105%). In order to determine accuracy, satisfactory values ranging from 95.9 to 104.9% were obtained for ARS and MFQ at all the concentrations tested. The calibration curves for ARS and MFQ were evaluated and both showed good linearity with a coefficient of determination (r2) > 0.99.
The individual linear equations and correlation coefficients
Table 2. Statistical comparison of the slopes of the analytical curves for the determination of selectivity
Compound Curve Slope Average ± SD Variance RSD / % p-valuea
Artesunate
standard
0.6594
0.6570 ± 0.0041 1.70 e-05
2.65 0.676
0.6524
0.6597
spiked sample
0.6327
0.6500 ± 0.0263 6.91 e-04
0.6365
0.6800
Mefloquine
standard
0.5321
0.5230 ± 0.0089 7.90 e-05
4.49 0.647
0.5215
0.5144
spiked sample
0.4920
0.5120 ± 0.0346 1.20 e-03
0.4930
0.5524
aStudent’s t-test at 95% confidence level. SD: standard deviation; RSD: relative standard deviation.
Figure 2. LC-MS/MS chromatogram of (a) artesunate at 500 ng mL-1
(m/z 407.0 > 261.1); (b) mefloquine at 1000 ng mL-1 (m/z 321.1 > 271.1);
were as follows: ARS, y = 0.6594x − 0.1889 (r2 = 0.9939);
MFQ, y = 0.5039x − 0.0978 (r2 = 0.9974). Additionally,
the variations in precision and accuracy at all of the concentrations tested were below 5% for both analytes.
The repeatability and intermediate precision are presented in Table 4. Both of the analytes RSD were < 2% and the comparison of the mean was statistically equivalent (Student’s t-test, p > 0.05), highlighting the precision of the method.
The stability tests were designed to take into consideration the anticipated conditions of handling real samples.25 The recovery results of ARS and MFQ standard
stock solutions were, respectively, 98.5 and 99.8% for long-term stability (−40 °C for 30 days), and 97.7 and
96.9% for bench-top stability (at 25 °C for 6 h). Analytical
samples and standards stored in the sample manager (8 °C for 24 h) showed recoveries of 98.1 and 98.8% for ARS and 98.1 and 100.5% for MFQ, respectively. Under the tested conditions, the results were not statistically different from the results of freshly prepared standard solutions (p > 0.05, Student’s t-test, 95% confidence level).
Sample analyses
The new method was successfully applied to determine ARS and MFQ in commercial samples containing 100 mg of ARS and 220 mg of MFQ (corresponding to 200 mg of MFQ base). The composition obtained with the newly described method, for the commercial tablets were 98.71 ± 4.72 mg for ARS and 211.20 ± 6.27 mg for MFQ
Table 3. Matrix effect and accuracy of artesunate and mefloquine
Compound Matrix effect / % Accuracy
Content / (ng mL-1) Sample 1 Sample 2 Sample 3 Level Content / (ng mL-1) Recovery ± SD / %
Artesunate
400 104.72 102.62 104.65
Low 400 102.06 ± 1.91
450 100.28 103.88 101.14
500 99.41 102.95 104.03 Medium 500 102.44 ± 0.77
550 101.30 99.93 104.31
High 600 103.43 ± 0.60
600 100.99 101.80 102.88
Mefloquine
800 98.27 99.01 97.63
Low 800 97.44 ± 2.48
900 94.52 97.78 95.30
1000 95.81 98.94 98.55 Medium 1000 98.67 ± 2.37
1100 97.50 99.54 101.07
High 1200 101.59 ± 1.13
1200 96.43 96.96 99.22
Table 4. Repeatability and intermediate precision for artesunate and mefloquine
Compound Sample
Precision
Repeatability Intermediate precision
Assay / % Average ± SD RSD (n = 6) / % Assay / % Average ± SD RSD (n = 12) / % pa
Artesunate
1 96.38
96.01 ± 1.84 1.91
98.68
97.97 ± 1.62 2.00 0.156
2 93.93 97.23
3 96.08 98.53
4 99.31 96.79
5 94.96 100.54
6 95.38 96.02
Mefloquine
1 101.36
100.29 ± 1.83 1.82
98.06
99.31 ± 1.97 1.89 0.695
2 97.08 96.46
3 99.31 102.24
4 102.17 100.21
5 100.88 99.80
6 100.95 99.10
base, corresponding to 98.7 and 105.6% of the declared content per tablet. The tablet content was in accordance with the Brazilian Pharmacopoeia.12
Conclusions
A rapid and sensitive LC-MS/MS method was developed for simultaneous quantitative determination of ARS and MFQ in fixed-dose tablets. The results of the validation study suggest that the LC-MS/MS method was selective, linear, precise, and accurate. Analysis of real samples demonstrated the applicability of the new method. Based on these results, the new LC-MS/MS method could significantly contribute to the quality control of pharmaceutical preparations containing these drugs and could be easily applied to routine analyses.
Acknowledgments
The authors thank CAPES for fellowships, and the Fundação Oswaldo Cruz for providing the raw material of ARS, MFQ, and ARS-MFQ fixed-dose combination tablets.
References
1. Shapiro, T. A.; Goldberg, D. D. In Goodman and Gilman’s The Pharmacological Basis of Therapeutics, 11th ed.; Brunton, L.
L.; Lazo, J. S.; Parker, K. L., eds.; McGraw-Hill: New York, 2006, p. 1021.
2. World Health Organization (WHO); World Malaria Report 2015; WHO: Geneva, Switzerland, 2015.
3. World Health Organization (WHO); Guidelines for the
Treatment of Malaria; WHO: Geneva, Switzerland, 2015.
4. Varotti, F. P.; Botelho, A. C. C.; Andrade, A. A.; de Paula, R. C.; Fagundes, E. M. S.; Valverde, A.; Mayer, L. M. U.; Mendonça, J. S.; Souza, M. V. N.; Boechat, N.; Krettli, A. U.; Antimicrob. Agents Chemother. 2008, 52, 3868.
5. Wilairatana, P.; Krudsood, S.; Treeprasertsuk, S.; Chalermrut, K.; Looareesuwan, S.; Arch. Med. Res. 2002, 33, 416. 6. White, N. J.; Olliaro, P. L.; Parasitol. Today1996, 12 (10), 399. 7. Newton, P. N.; Green, M. D.; Fernández, F. M.; Day, N. P. J.;
White, N. J.; Lancet Infect. Dis. 2006, 6, 602.
8. César, I. C.; Nogueira, F. H. A.; Pianetti, G. A.; J. Pharm. Biomed. Anal. 2008, 48, 951.
9. World Health Organization (WHO); The International
Pharmacopoeia, 5th ed.; WHO: Geneva, Switzerland, 2015.
10. European Pharmacopoeia, 6th ed.; Council of Europe:
Strasbourg, 2008.
11. The United States Pharmacopeia, USP 36; The United States Pharmacopeial Convention: Rockville, 2013.
12. Agência Nacional de Vigilância Sanitária (ANVISA);
Farmacopéia Brasileira, 5a ed.; Brasília, 2010.
13. Kalyankar, T. M.; Kakade, R. B.; Attar, M. S.; Kamble, A. R.;
J. Chem.2013, 2013, 1.
14. Sourabh, K.; Ajay, G.; Mukut, T.; Surendra, S. I.; Rajesh, R;
Int. J. Pharm. Res. Biosci. 2014, 3, 200.
15. Nogueira, F. H. A.; Reis, N. F. A.; Chellini, P. R.; César, I. C.; Pianetti, G. A.; Braz. J. Pharm. Sci. 2013, 49, 837.
16. Sandhya, S. M.; Shiji Kumar, P. S.; Meena, S.; Am. Chem. Sci. J. 2015, 7, 26.
17. Manikandan, K.; Lakshmi, K. S.; Geetha, Y.; Sowmiya, K.; Saranya, K.; J. Chem. Pharm. Sci. 2013, 6, 155.
18. ASTM E1657-98; Standard Practice for Testing Variable Wavelength Photometric Detectors Used in Liquid
Chromatography; ASTM International: West Conshohocken,
2011.
19. Agência Nacional de Vigilância Sanitária (ANVISA); Guia para
Validação de Métodos Analíticos e Bioanalíticos, Resolução
RE No. 899 de 29 de maio de 2003, Brasília, 2003.
20. ICH, International Conference on Harmonization of Technical Requirements for Registration of Pharmaceuticals for Human Use, Q2B(R1), Validation of Analytical Procedurs: Text and
Methodology; ICH: Geneve, 2005.
21. Hodel, E. M.; Zanolaru, B.; Mercier, T.; Biollaz, J.; Keiser, J.; Olliaro, P.; Genton, B.; Decosterd, L. A.; J. Chromatogr. B
2009, 877, 867.
22. Lindegardh, N.; Hanpithakpong, W.; Kamanikom, B.; Pattayaso, J.; White, N. J.; Day, N. P. J.; Bioanalysis2011, 3, 1613. 23. He, G.; Qi, H.; Wang, M.; Yang, J.; Wen, F.; Wang, W.; Qiao,
C.; Zhang, H.; J. Pharm. Biomed. Anal.2013, 83, 186. 24. Grimalt, S.; Pozo, O. J.; Marin, J. M.; Sancho, J. V.; Hernandez,
F.; J. Am. Soc. Mass Spectrom. 2005, 16, 1619.
25. Heaton, J.; Gray, N.; Cowan, D. A.; Plumb, R. S.; Legido-Quigley, C.; Smith, N. W.; J. Chromatogr. A 2012, 1228, 329.
Submitted: May 5, 2016