ISSN 0104-6632 Printed in Brazil
Brazilian Journal
of Chemical
Engineering
Vol. 21, No. 01, pp. 59 - 67, January - March 2004
EXPERIMENTAL STUDY AND SIMULATION OF
MASS DISTRIBUTION OF THE COVERING
LAYER OF SOYBEAN SEEDS COATED IN
A SPOUTED BED
C. R. Duarte, J. L.V. Neto, M. H. Lisboa, R. C. Santana, M. A. S. Barrozo
*and V. V. Murata
School of Chemical Engineering, Federal University of Uberlândia, Building K, Campus Santa Mônica, POB 593, 38400-902, Uberlândia - MG, Brazil.
Phone and Fax: (034) 3239-4292, E-mail: [email protected]
(Received: April 15, 2003 ; Accepted: July 30, 2003)
Abstract - In previous work, it was observed that the covering of soybean seeds with bacteria and micronutrients enhances vigorous growth of the plant thereby avoiding use of ammoniacal fertilizers. In the spouted bed covering can be done by pulverization of the coater slurry on the soybean seeds using a pneumatic atomizer. The optimum thickness of the cover allows the fundamental gaseous interchanges for germination and provides the ideal conditions for bacterium activity. The objective of this work was to study the influence of the process variables on thickness of the cover. A simulation of the mass distribution of seeds was obtained using a population balance model. Through the results obtained the operational conditions under which the coating layer distribution were determined has the greatest uniformity.
Keywords: population balance model, coating, soybean seeds, spouted bed.
INTRODUCTION
The coating technique can be used in covering the seeds of agricultural products, with the objective of achieving adherence of macro and micronutrients, inoculants (bacteria), fungicides to their surfaces or modifying their format and size with inert material. The use of spouted beds in the coating of soybean seeds with micronutrients and inoculants offers several advantages, mainly taking into account the characteristics and properties of soybeans (Lucas, 2000):
1) rational dosage of micronutrients;
2) decrease in the leaching of micronutrients; 3) reduction in fuel and labor expenses; 4) optimization of the use of nitrogen fertilizers.
The inoculation process permits nitrogen fixation, so some part of the soybeans needs can be obtained
from the air, minimizing the use of ammoniacal fertilizers. The process consists in adherence of the nitrogen-fixing Bradyrhizobium bacterium to the seed surface. The bacteria will adhere to the plant roots as a nodule and convert the nitrogen in air to meet the plant’s needs.
The inoculant is mixed with water and also with molybdenum and cobalt micronutrients, which are important in the process of nitrogen fixation as a consequence of the nodulation of roots, but are found at low concentrations in Brazilian soil. This slurry is used to coat the seeds and the result of the increased nitrogen fixation is more vigorous plants.
Figure 1 shows the presence of nodules on the roots of plants from seeds submitted to this process.
fissures of seeds and number of nodules on the roots was evaluated by Lucas (2000). The results proved the effectiveness of the use of the spouted bed for soybean seed inoculation.
Lucas (2000) showed that the final quality of the soybean seeds as well as the efficiency of the process is strongly related to the operational variables. However, it is important not only to evaluate the total amount of covering adhering to the seeds, but also to study the coating mass distribution on the soybean seeds.
Besides the total amount of coating on the seeds, the coating mass distribution is of primary importance. Layer thickness must assure germination of the seeds and also the bacteria activity. This means it must provide the ideal gaseous interchanges, the fixation of nitrogen and the correct concentration of micronutrients, because very thick layers impair germination of seeds by impeding gaseous interchanges, while very thin ones do not
assure the ideal activity of the bacterium in the process of nitrogen fixation and may not contain the ideal amount of micronutrients.
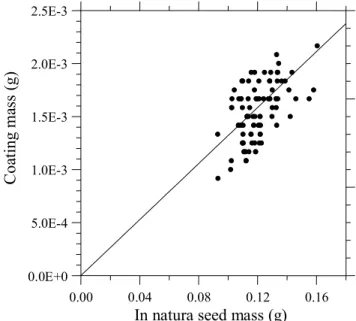
Liu and Lister (1992) observed relationship between coating mass and in natura seed mass in several types of seeds coated in a spouted bed (see Figure 2). They observed that two soybean seeds with the same mass in natura can with the have different coating masses. It is worth noting that the coating mass may be not proportional to the in natura seed mass.
The objective of this work was to identify the conditions under which the mass distribution of the coating layer has the greatest uniformity. In order to understand the influence of the main operational variables of the covering process, a simplified mathematical model based on population balance was developed. The model was validated with experimental values obtained by analysis using the image technique.
(a) (b)
Figure 1: Roots of soybean plants with inoculum (a) and without inoculum (b)
In natura seed mass (g)
0.00 0.04 0.08 0.12 0.16
0.0E+0 5.0E-4 1.0E-3 1.5E-3 2.0E-3 2.5E-3
C
o
a
t
i
n
g
m
as s (g
)
Coa
tin
g
ma
ss
(g
)
MATERIALS AND METHODS Materials
The Vencedora variety of soybeans used in the experiments has a germination rate of around 90%. The concentration of the coating slurry (CS) was 0.13 g solids/ml of slurry, with 95% micronutrients and 5% inoculum. The commercial product used as micronutrient was Nodulus (supplied by Bio-Soja Ltd.), which contains 1% cobalt and 10% molybdenum. The inoculum was Emerge Wettable Powder (supplied by Milenia Agrociências S/A), which contains Bradyrhizobium bacterium. Table 1 shows the properties of the soybean seeds used in this work.
Experimental Apparatus and Operational Conditions
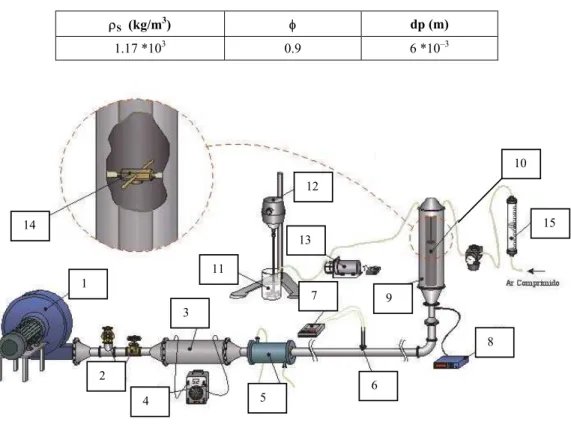
Figure 3 shows a scheme of the experimental
apparatus. Air was impelled by a 7.5 HP blower
(1), and its flow rate was adjusted by gate valves
and one bypass (2). The air was heated by
electrical resistances (3) connected to a voltage
variation device (4). Temperature was adjusted
by a double-pipe heat exchanger (5). A Pitot
tube (6) calibrated with a hot wire anemometer
was used to measure of the spouted air flow rate.
Pressure drop was measured with a micromanometer
(7). Air temperature was measured using a
constantan-copper thermocouple (8) located at the
inlet of the spouted bed (9). The spouted bed
was made of stainless steel with the following
dimensions: diameter of the cylindrical part,
0.21m; diameter of the base, 0.035 m and cone
angle 60
o. The spouted bed was equipped with a
glass window (10) for observation of the
atomization system. The slurry (11) was agitated
and heated by a plate (12) and it was fed into a
double-fluid atomizing nozzle (14) by a
peristaltic pump (13). The atomization air flow
rate was adjusted with a rotameter (15).
The spouted air temperature was not allowed to go above 39oC due to the presence of the bacterium. The initial seed mass was 2500g and the coating process time was 20min. At the end of this time, a random sample of 100 seeds was removed and the seeds individually weighed with and without coating.
Table 1: Physical properties of soybean seeds of the Vencedora variety
ρS (kg/m3) φ dp (m)
1.17 *103 0.9 6 *10–3
5
6 4
2 1
3 14
11
8 13
12
10
15
9 7
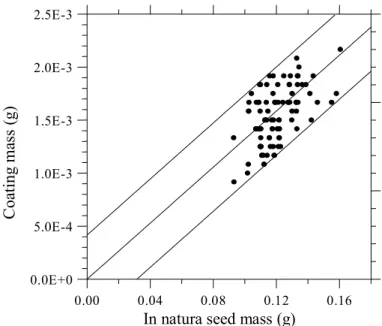
Determination of the Dispersion Index
The dispersion index (DI) is a dimensionless value related to the degree of uniformity of the seeds. It is defined as the slope of the straight lines parallel to the central line shown in Figure 4. These upper and lower lines intercept the respective outlier points of the central line.
Image Analysis
Coating thickness was calculated as the difference between the average diameter of the coated soybean (Figure 6) and the diameter of the soybean whose coating had been mechanically removed (Figure 7). The diameter was measured with the image analysis technique (Figure 5) using a digital photographic camera Sony /Mavica MVC-FD73 and software for image processing tasks (Global Lab - Image). The image was calibrated with a steel sphere with a diameter of 9.5 mm.
In natura seed mass (g)
0.00 0.04 0.08 0.12 0.16
0.0E+0 5.0E-4 1.0E-3 1.5E-3 2.0E-3 2.5E-3
C
o
at
in
g
m
as
s
(g
)
Figure 4: Graph of determination of the dispersion index
15cm
Placa de Vidro
transparente
Lâmpada
Câmera fotográfica
Suporte de aço
Papel seda
amarelo
Sementes
de soja
Superfície
plana de
vidro
15cm
Steel support
Yellow silk paper
Lamp Glass
plane surface Soybean
seeds
Transparent glass plate
Photographic camera
1.5 m
Figure 5: Apparatus used to capture the images
Efficiency and Thickness
The objective of this stage of this work was to verify the influence of the process variables on efficiency (η) and coating thickness (E). The variables studied were flow rates of the spouted air, atomization air and slurry. The values of these variables were defined by the central composed design technique.
Model Description
The general population balance equation given by Equation (1) comes from the continuity equation applied to a small element of arbitrary volume, R.
R R
d
dR (B D)dR
dt
∫
ψ =∫
− (1)where B and D are the appearance and disappearance rates of new particles respectively and ψ is a general density function distribution.
In this work ψ is the function distribution of seed mass, Nf(m), where the state coordinate is the mass of soybean seeds. So, using the treatment proposed by Liu and Lister (1992) and neglecting the agglomeration and fragmentation phenomena, Equation (1) can be rewritten as
(
Nf (m))
(
G(m)Nf (m))
D B 0t m
∂ ∂
+ +
∂ ∂ − = (2)
In coating soybean seeds the main mechanism is growth by layer, and thus Equation (2) can be reduced to
(
Nf (m))
(
G(m)Nf (m))
t m
∂ = − ∂
∂ ∂ (3)
According to Liu and Lister (1992), the growth rate can be given by
dm
G(m) Km
dt
= = (4)
where the proportionality coefficient K can be obtained for some time T from the following mass balance: max min m s s m
Nf (m)G(m)dm=Q C
∫
η (5)where Qs is the slurry flow rate, CS the slurry concentration,
η
the process efficiency, mmin the minimum value of seed mass and mmax the maximum value of raw soybean seed mass.The discretized form of Equation (5) (Liu and Lister, 1992, Hounslow et al., 1988) for mass-dependent growth is given by Equation (6):
(
)
i
i 1 i-1 i i i 1 i 1 i
dN 1
aG N bG N cG N
dt =m − + + + + (6)
where is the smallest value of mass in interval i and coefficients a, b, and c are solutions of the zero-, first- and second-order moments given by Equation (7)
i
m
(
)
( )
2(
)
( )
22r 2 2r
a , b , c
1 r
1 r r 1 1 r r 1
−
= = =
+
+ − + − (7)
where r is i 1
i
m m
+ , i.e., the ratio between the largest
and the smallest limit in each interval.
The growth rate in discretized form is given
by Equation (8):
s s i j j j 1
Q C
G i m
N m
∞
=
η =
∑
(8)where m is the mean value of mass in the discrete i interval i and Nj represents the total number of seeds in the interval. The efficiency of coating η as a function of the operational variables: spouted air flow rate, atomization air flow rate and slurry flow rate was obtained empirically by the response surface technique.
The model was solved using a specific code developed in Maple V®. This software was chosen because it enables the combination of symbolic and numerical tools, useful in the automatic generation of the equations and in the analytic and numeric solutions of the model.
3
RESULTS Dispersion Index
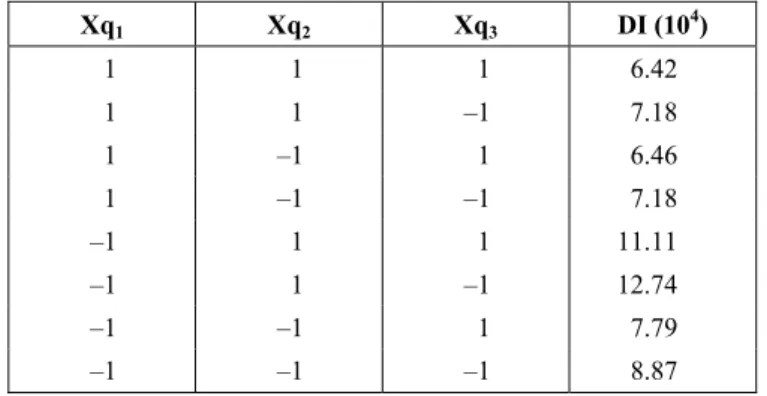
The operational conditions and spouted bed configuration able to minimize the dispersion index were obtained by a two levels factorial design technique (Box et al. 1978). The following qualitative variables were considered: use of internal tube (Xq1), radial location of the nozzle atomizer (Xq2) and size of seeds (Xq3). Table 2 shows the variables and their respective levels, where “sieves” 11 and 13 are commercial terms that correspond to seeds with medium diameters of 6.5 and 5.5 mm, respectively.
Table 3 contains the dispersion index values (DI) obtained from various experiments. The significance level of each variable (effect) is shown in Table 4. It can be observed that DI is influenced in the order Xq1, Xq3 and Xq2 and that there is an interaction between Xq1 and Xq2. The best condition (the highest degree of uniformity) was obtained with the use of the internal tube and with the radial position for the nozzle atomizer off center.
The minimization of coating nonuniformity when the internal tube is used in the spouted bed may be associated not only with the increased regularity in the time associated with each seed trajectory but also with the number of times that the seed follows this trajectory. The radial position of the nozzle atomizer off center (0.66R) atomizer avoids a greater elutriation of the atomized material. These conditions guarantee the lowest dispersion index and were used to determine both coating thickness and efficiency.
Efficiency and Thickness
Table 5 contains the experimental results on efficiency and coating thickness as well as the operational conditions for each experiment.
The empirical models obtained for efficiency and coating thickness, containing only parameters with significance levels lower than 5% with correlation coefficients of 94.2% and 98.3%, respectively, and with random independently distributed residues, are given by Equations (9) and (10):
1 2
2 2
1 3 1 3
= 77.96 5.142X + 1.720 X +6.150 X --3.598X -2.408X +2.385X X
η
(9)
1 2
2
1 1 2 1 3
E =0.0260.0028X + 0.0050X + 0.0047X --0.0011X -0.0018X X -0.0029X X
3
(10)
where X1, X2 and X3 are dimensionless variables given by Equations (11) to (13), related to the spouted air flow rate QSA (L/s), the atomization air flow rate QAT (L/s) and the slurry flow rate QS (L/s), respectively,
SA 1
Q 32.9
X
2.5 −
= (11)
AT 2
Q - 0.42 X
0.12
= (12)
S 3
Q 0.25 X
0.05
−
= (13)
Table 2: Qualitative variable levels
Variable Level = 1 Level = -1
Xq1 with internal tube without internal tube
Xq2 Nozzle at center Nozzle at 0.66R
Xq3 50% “Sieve” 11 and 50% “Sieve” 13 100% “Sieve”13
Table 3: Dispersion index results for different experimental conditions
Xq1 Xq2 Xq3 DI (104)
1 1 1 6.42
1 1 –1 7.18
1 –1 1 6.46
1 –1 –1 7.18
–1 1 1 11.11
–1 1 –1 12.74
–1 –1 1 7.79
Table 4: Results of the calculated effects of the dispersion index
Effect Value (104) Significance Level (103)
Xq1 –1.7 0.55
Xq2 0.9 3,40
Xq3 –0.5 15.00
Xq1Xq2 –0.9 3.30
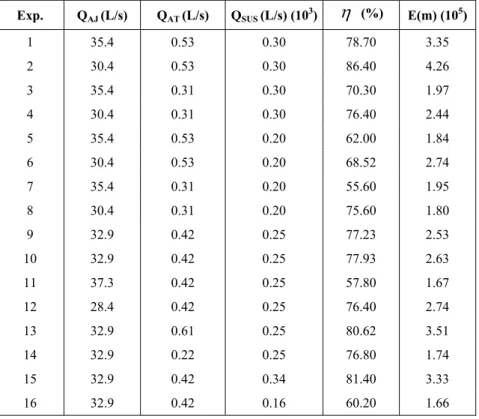
Table 5: Experimental values for efficiency (η) and coating thickness (E)
Exp. QAJ (L/s) QAT (L/s) QSUS (L/s) (103)
η
(%) E(m) (105)1 35.4 0.53 0.30 78.70 3.35
2 30.4 0.53 0.30 86.40 4.26
3 35.4 0.31 0.30 70.30 1.97
4 30.4 0.31 0.30 76.40 2.44
5 35.4 0.53 0.20 62.00 1.84
6 30.4 0.53 0.20 68.52 2.74
7 35.4 0.31 0.20 55.60 1.95
8 30.4 0.31 0.20 75.60 1.80
9 32.9 0.42 0.25 77.23 2.53
10 32.9 0.42 0.25 77.93 2.63
11 37.3 0.42 0.25 57.80 1.67
12 28.4 0.42 0.25 76.40 2.74
13 32.9 0.61 0.25 80.62 3.51
14 32.9 0.22 0.25 76.80 1.74
15 32.9 0.42 0.34 81.40 3.33
16 32.9 0.42 0.16 60.20 1.66
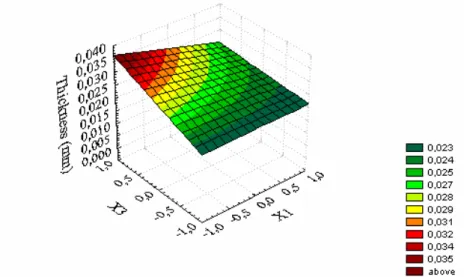
Response surfaces were obtained from equations 9 and 10. Figure 8 shows the response surface that relates coating thickness to the dimensionless variables X1 and X3. The value of the other variable (VAT) was fixed at the central point (X2=0). The greates thickness was obtained for the lowest spouted air flow rates (X1) and highest slurry flow rates (X3).
Figure 9 shows that thickness may increase with an increase in the atomization air flow rate (X2) or a decrease in the spouted air flow rate (X1), as a consequence of the elutriation process. The same analysis can be applied to the process efficiency curves.
Simulation Results
Figure 10 contains a comparison of simulated model results and the experimental data. This figure shows good agreement between the experimental and simulated mass distribution of seeds for two standard experiments, conducted at different slurry flow rates and with similar raw seed distributions and efficiency. It can be verified that the increase in the slurry flow rate causes an increase in the coating mass of the same seed.
Figure 8: Response surface for the coating thickness with X2 = 0
Figure 9: Response surface for the coating thickness with X3 = 0
Soybeen seed mass (g)
0.10 0.12 0.14 0.16
0.00 0.20 0.40 0.60 0.80 1.00
Vsus=12ml/min,T=20min.Experimental Vsus=12ml/min,T=20min.Simulado Vsus=18ml/min,T=20min.Simulado Vsus=18ml/min,T=20min.Experimental
f
(m
)
CONCLUSIONS
The lowest dispersion index and the most uniform distribution of coating thickness are consequences of the use of an internal tube in the spouted bed and of location of the nozzle in a radial position of 0.66R.
The simulation based on a population balance showed that the model was able to predict the mass of coated seeds in the spouted bed with an error of around 0.3%.
NOMENCLATURE
B rate of appearance of new particles for a range of state properties
CS concentration of solids in the coating
slurry, Kg/m3
D rate of disappearance of new particles f(m) normalized density function
G(m) growth rate, Kg/s
K growth rate constant, s-1
m mean mass, Kg
N total number of soybean seeds
QSA spouted air flow rate, L/s QAT atomization air flow rate, L/s
QS slurry flow rate, L/s
R region where the entity ψ is valid
t time, s
T total time of the experiment, s Vx, velocity in x, m/s Vy velocity in y, m/s Vz, velocity in z, m/s Xq1 codified spouted air flow rate
Xq2 codified atomization air flow rate
Xq3 codified slurry flow rate x,y and z - space coordinates, m
Greek Symbols
η process efficiency
ξ any state property
ψ general density function distribution
Subscripts
s solid (slurry ) SA spouted air AT atomization air
REFERENCES
Box, M.J., Hunter, W.G. and Hunter, J.S., Statistics for Experimenters. An Introduction to Design, Data Analysis, and Model Building; John Wiley and Sons, New York (1978).
Duarte, C. R. et al., The Use of the Population Balance Model in the Study of Coating of the Soybean Seeds in a Spouted Bed, Proceedings of the XXIX ENEMP (CD-ROM), São João Del Rei, MG (2001).
Freire, J.T. and Oliveira, W.P., Technological Aspects of the Processes of Particles Covering, Special Topics in Drying, UFSCar Graphic, São Carlos-SP, Brazil, Vol. 1, pp. 253-293 (1992). Hounslow, M.J., Ryall, R.L. and Marshall, V. R., A
Discretized Population Balance for Nucleation, Growth, and Aggregation, AIChE Journal, Vol. 34, pp. 1821-1832 (1988).
Hounslow, M.J. and Wynn, J.W, Short-Cut Models For Particulate Process, AIChE Journal, Vol. 17, pp. 505-516 (1993).
Liu, L.X. and Lister, J.D., Spouted Bed Seed Coating: The Effect of Process Variables on Maximum Coating Rate and Elutriation, Powder Technology, Vol. 74, pp. 215-230 (1993).
Liu, L.X. and Lister, J.D., Coating Mass Distribution from a Spouted Bed Seed Coater: Experimental and Modeling Studies, Powder Technology, Vol. 74, pp. 259-270 (1992).
Lucas, K.B.C., Soybean Inoculation and Covering with Micronutrients in a Spouted Bed, Master’s thesis, Federal University of Uberlândia, Uberlândia - MG (2000).