ISSN 0104-6632 Printed in Brazil
www.abeq.org.br/bjche
Vol. 25, No. 01, pp. 95 - 107, January - March, 2008
Brazilian Journal
of Chemical
Engineering
EXPERIMENTAL AND NUMERICAL STUDY
OF SPOUTED BED FLUID DYNAMICS
C. R. Duarte, V. V. Murata and M. A. S. Barrozo
*School of Chemical Engineering, Federal University of Uberlândia, Phone and Fax: +(55) (34) 3239-4292, Bloco K, Campus Santa Mônica, PO Box 593, 38400-902, Uberlândia - MG, Brazil.
E-mail: [email protected]
(Received: January 16, 2006 ; Accepted: November 19, 2007)
Abstract - Spouted beds, originally invented in Canada by Mathur and Gishler (1955) as an alternative to
fluidized beds for handling coarse particles, are now widely studied in a variety of physical operations, such as drying, coating and granulation. In this work the particle velocity, minimum spouting flow rate and characteristic fluid-dynamic curves of the spouted bed were obtained using a Eulerian granular multiphase
model. The computational work was significantly reduced for axisymmetric gas-solid flows. The
experimental data obtained in two spouted bed configurations, conical-cylindrical and two-dimensional, were compared with the simulated results, showing good agreement
Keywords: Spouted bed; Computational fluid dynamics; Eulerian granular multiphase model.
INTRODUCTION
Spouted beds are gas-particle contactors in which the gas is introduced through a single nozzle at the center of a conical or flat base. Spouted beds provide a means of good mixing and circulation for particles of a relatively large size and narrow size distribution. The spouted bed technique has been applied in many industrial processes, such as drying of granular materials, blending of polymer chips, coating of tablets and granulation of fertilizers and other materials (Mathur and Epstein, 1974). Knowledge of gas and particle dynamics in a spouted bed is important for evaluation of particle circulation rate and gas-solid contact efficiency (Shintaro et al., 2004).
Although have been extensively applied, the mechanisms of solid movement in spouted beds are still not completely understood. Knowledge of the solid flow pattern in spouted beds is of great interest in their design because the particle trajectories must meet the requirements of the process being carried out. Because of the large number of particles, it is
difficult to observe particle motion in the gas-solid phase, which flows continuously in spouted beds.
It is difficult to measure gas and particle dynamics without disturbing the flow field. In the literature on spouted beds, particle velocities are measured in half cylindrical beds with a front flat wall.
Particle circulation rate in cylindrical spouted beds was experimentally studied by several authors (Mathur and Gishler, 1955; Thorley et al., 1959; Chatterjee, 1970; Van Velzen et al., 1974; Lim and Mathur, 1978; Waldie and Wilkinson, 1986; Randelman et al., 1987; Kim and Cho, 1991; He et al. 1994). Mathur and Epstein (1974) calculated the solid flow along the spout in the cylindrical section of the bed from the velocity data at the wall obtained by Mathur and Gishler (1955) and Thorley et al. (1959). Volpicelli et al. (1967) proposed a model for calculating the solid cross-flow into the spout in the lower conical section at the base of cylindrical beds. Lefroy and Davidson (1969) and Morgan et al. (1985) calculated the solid circulation rate in cylindrical spouted beds with a flat bottom by means of mass and momentum conservation equations. Lefroy and Davidson (1969) also calculated the solid cross-flow by a mechanism of interparticle collisions at the interface.
Wang et al. (2005) studied the pressure-velocity hysteresis phenomenon in gas-solid conical spouted beds and identified that this phenomenon is primarily caused by different bed structures, resulting from different states of compression of particles in the vicinity surrounding the internal spout or cavity due to different interlocking behavior of particles in the upper vicinal packed-bed region in an ascending and descending process.
The jet spouted bed regime in the conical spouted bed was studied by San José et al (2005a). These authors concluded that gas interstitial velocity on the axis, decreases with longitudinal position on the axis, with this decrease being more pronounced as the solid density increases. In addition these velocity profiles are more pronounced than those for the conical spouted bed regime.
Bed voidage is another important topic that has been studied by researchers. Voidage in the annulus of spouted beds is usually assumed to be constant and the same as the loosely packed voidage of particulate material (Mathur and Gishler, 1955; Mathur and Epstein, 1974). On the other hand, recent studies have shown slight differences in voidage in different parts of the annulus.
San josé et al. (2005b) showed that bed voidage on the axis of the spout and fountain decreases with bed level and bed voidage in the fountain core decreases radially from the axis to the core-periphery interface. Bed voidage in the core at any radial position decreases as bed level in the fountain increases. In the descent zone of the fountain, the values of voidage are very similar for solids of different densities.
The numerical simulation technique and computational fluid dynamics (CFD) studies have
become popular in the field of gas-solid two-phase flow. Studies on fluidized beds and spouted beds can be mentioned as examples. Numerical simulation is a useful tool to obtain detailed information about flow phenomena without disturbing them.
CFD models can be divided into two groups, Lagrangian models and Eulerian models. In Lagrangian models, or discrete particle models, DEM, the two-dimensional motion of each individual particle is directly calculated from the forces acting on them, accounting for the interaction between the particle and the gas phase. The collision model implemented is based on the conservation laws for linear and angular momentum and requires, apart from geometrical factors, two empirical parameters: a restitution coefficient and a friction coefficient. The fluid dynamic model of the gas is based on the volume-averaged Navier–Stokes equations. The advantage of using this approach is that each particle trajectory as well as the system parameters is known exactly. The results often give physical insight into the nature of the law. However, because a large number of particle trajectories are needed in order to determine the average behavior of a system, the computational requirement is extremely high (Cheng et al., 2001).
In the multifluid CFD model, also referred to as Eulerian–Eulerian (EE), the gas and the solid phases are considered to be continuous and fully interpenetrating. Both phases are described in terms of separate sets of conservation equations with appropriate interaction terms representing the coupling between the phases (Chiesa et al., 2005).
There are a restricted number of works related to the fluid dynamic study of the spouted bed using a Eulerian multiphase model. However, recently Duarte et al. (2004) and Du et al. (2005) showed good results obtained using this model.
In this paper, the Eulerian multiphase model, which treats gas and particle as an interpenetrating continuum, was used in two spouted bed configurations: conical-cylindrical and two-dimensional. This numerical approach minimizes the computational cost, mainly for flows with a high concentration of particles, and also considers the effects of interaction between the two phases. Since the volume of one phase cannot be occupied by the other, the concept of phase volume fraction is introduced. These volume fractions are assumed to be continuous functions of space and time.
In the Eulerian multiphase model, the transport coefficients of the solid phase must account for gas-particle interactions and gas-particle-gas-particle collisions. The interphase momentum transfer between gas and solid phases is one of the dominant forces in the gas and solid phase momentum balances (Syamlal and O’ Brien, 1989; Gidaspow, 1994; Wen and Yu, 1966 , Taghipour et al., 2005).
Gómez and Milioli (2005) show that the pressure of the solids exerts considerable influence on the transient flow behavior and should not be disregarded in a project or study of circulating fluidized bed (CFB) systems. In order to consider the granular temperature effect, which is due to fluctuations in particle velocity caused by shear, dissipation by kinetic and collisional heat flow, dissipation due to inelastic collisions, production due to fluid turbulence or due to collisions with molecules, and dissipation due to interaction with the fluid, a model based on an analogy with the kinetic theory of dense gases was used.
It is expected that the momentum and energy transfer will be different according to granular regime. A mathematical model intended to describe this granular flow requires a comprehensive, unified stress tensor able to adequately describe stress within the flow for any of these regimes without imposing the predominance of one regime over the others. The effect of loss of energy due to the collision of particles was considered, so the restitution coefficient concept was introduced.
Experimental work was conducted in two spouted bed configurations: conical-cylindrical and two-dimensional. The experimental data were compared with the CFD simulated results.
DESCRIPTION OF THE MODEL
The Eulerian multiphase model allows modeling of multiple separate, yet interacting phases. The phases considered are gas and solid. The Eulerian approach is used for each phase, taking into account all possible intra and interphase combinations. The conservation equations can be derived by ensemble averaging the local instantaneous balances for each phase.
The mass conservation equations for fluid and solid phases are given as equation (1) and (3), respectively.
( )
f .( fv )f 0t
∂ α + ∇ α =
∂
G
(1)
where vf G
is the gas velocity. The gas volume, Vf, is
defined as
f f
V
V = α
∫
dV (2)( )
s .( sv )s 0t
∂ α + ∇ α = ∂
G
(3)
The conservation of the gas and solid momentum equation is given by equations (4) and (5), respectively:
(
)
(
)
(
)
(
)
(
)
f f f f f f f f
f f f f f q,f lift,f vm,f
fs f s
v . v v p
t
. g F F F
K v v
∂ α ρ + ∇ α ρ = −α ∇ +
∂
∇ τ + α ρ + α ρ + + +
+ −
G G G
G G G
G G G (4)
(
)
(
)
(
)
(
)
(
)
s s s s s s s s s
s s s s s q,s lift,s vm,s
sf s f
v . v v p p
t
. g F F F
K v v
∂ α ρ +∇ α ρ = −α ∇ − ∇ +
∂
∇ τ + α ρ + α ρ + + +
+ −
G G G
G G G
G
G G
(5)
where FGq , FGliftand Fvm G
are an external body force,
a lift force and a virtual mass force, respectively. The lift force and virtual mass force are given as:
(
) ( )
lift f s f s f
F = − ρ α0.5 v −v × ∇v
G G G G
(6)
s s f f
vm s f
d v d v
F 0.5
dt dt
= α ρ −
G G G
(7)
These lift forces act on a particle mainly due to velocity gradients in the primary-phase flow field. The virtual mass effect occurs when the solid phase accelerates relative to the gas phase. The inertia of the gas phase mass encountered by the accelerating particles exerts a virtual mass force on the particles. The lift and virtual mass force will be added to the right-hand side of the momentum equation for both phases (FGlift,f = −FGlift,sandFvm,f = −Fvm,s
G G
).
well studied and empirically correlated for a wide range of particle Reynolds numbers. However, when a single particle moves in a dispersed two-phase mixture, the drag is affected by the presence of other particles. Numerous correlations for calculating the momentum exchange coefficient of gas-solid systems have been reported in the literature, including those of Syamlal and O’ Brien (1989), Gidaspow (1994) and Wen and Yu (1966). The solid-phase momentum equation contains an additional term to account for momentum exchange due to particle-particle collisions. The absence of the stress term of the particle phase in the particulate momentum equation has resulting in different models adopting different closure methods, including the kinetic theory model (Taghipour, 2005).
The momentum exchange coefficient (Ksf)
between solid phase s and fluid phase f can be written in the following general form:
s s d sf
s
f
K =α ρ
τ (8)
The τsis the particulate relaxation time given as:
2 s s s
f
d 18
ρ τ =
µ (9)
where d is the diameter of particles in the solid s phase (s) and µf is the fluid viscosity.
The definition of f includes a drag function (d CD)
that is based on the relative Reynolds number (Res),
which is given by Equation (10).
(
s f)
s s
f
d v v
Re =ρ −
µ
G G
(10)
In this work the Gidaspow et al. (1992) model, which is a combination of the Wen and Yu (1966) and the Ergun (1952) equations, was used.
The solid-fluid exchange coefficient Ksf is as
follows:
forα >f 0.8:
s f
s f f 2.65
sf D f
s
v v
3
K C
4 d
−
α α ρ −
= α
G G
(11)
where
(
)
0.687D f s
f s
24
C 1 0.15 Re
Re
=α + α
(12)
forα ≤f 0.8:
s f
f s
s f f
sf 2
s f s
v v
(1 )
K 150 1.75
d d
ρ α −
α − α µ
= +
α
G G
(13)
Closure of the solid phase momentum equation (Eq. 5) requires a description of the solid phase stress. The granular kinetic theory derived by Lun et al. (1984)was adopted in this study. For the granular phase, it is clear that any mathematical model of a granular flow must account for the following effects:
in the dilute part of the flow, grains randomly fluctuate and have translation movement, this form of viscous dissipation and stress is referred to as kinetic,
at higher concentrations, in addition to the
previous dissipation form, grains can collide briefly giving rise to further dissipation and stress, referred to as collisional,
at very high concentrations (more than 50% in volume), grains start to endure long, sliding and rubbing contacts, which gives rise to a totally different form of dissipation and stress, referred to as frictional.
The basic governing idea in the granular kinetic theory is that the grains are in continuous and chaotic motion within the fluid. This chaotic random motion is seen at very low concentrations (due to friction between gas and particles, to gas turbulence, to variation in pressure in the fluid and so forth) or at higher concentrations (due to grain collisions). Using the analogy of the gas, a "temperature", θs, referred to as granular temperature, which is proportional to the mean quadratic velocity of the random motion of the grains, can be defined.
In the granular model the pressure exerted on the containing wall due to the presence of particles and the momentum transfer due to the streaming motion of the particles is calculated by solid pressure. The solid pressure model is used to represent the interparticle forces on particles settling on top of each other and ensure that the correct maximum packing limit of the settled layer is obeyed. The solid pressure equation is given as:
(
)
s2
s s s s s ss 0,ss s
p = α ρ θ + ρ2 1 e+ α g θ (14)
derived from the kinetic theory takes the following form:
(
)
(
)
(
)
(
)
s s s s s s s
s s s s s s fs
3
. v
2 t
p I : v . kθ θ
∂
ρ α θ + ∇ ρ α θ =
∂
− + τ ∇ + ∇ ∇θ − γ + φ
G
G (15)
where
(
−p Is + τ ∇)
: vGs= the generation of energy by thesolid stress tensor;
(
kθs∇θs)
= the diffusion of energy (kθsis thediffusion coefficient);
s
θ
γ = the collisional dissipation of energy;
fs
φ = the energy exchange between the fluid and
solid phases.
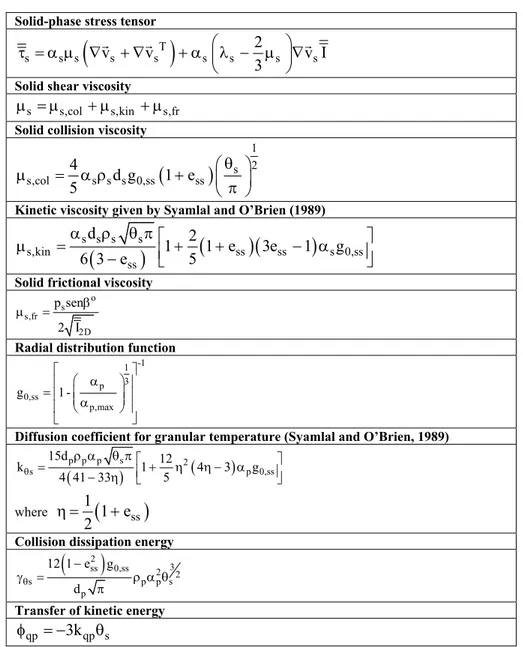
The constitutive equations required to close the governing equation are listed in Table 1.
Table 1: Constitutive Equation for Granular Formulation
Solid-phase stress tensor
(
T)
s s s s s s s s s
2
v v v I
3
τ = α µ ∇ + ∇ + α λ − µ ∇
G G G
Solid shear viscosity
s s,col s,kin s,fr
µ = µ + µ + µ Solid collision viscosity
(
)
1 2 s s,col s s s 0,ss ss
4
d g 1 e
5
θ
µ = α ρ +
π
Kinetic viscosity given by Syamlal and O’Brien (1989)
(
)
(
)(
)
s s s s
s,kin ss ss s 0,ss
ss
d 2
1 1 e 3e 1 g
6 3 e 5
α ρ θ π
µ = + + − α
−
Solid frictional viscosity
o s s,fr
2D p sen
2 I
β µ =
Radial distribution function
-1 1 3 p 0,ss
p,max g 1
-
α
= α
Diffusion coefficient for granular temperature (Syamlal and O’Brien, 1989)
(p p p )s 2( )
s p 0,ss
15d 12
k 1 4 3 g
4 41 33 5
θ = ρ α θ π − η + η η − α
where 1
(
1 ess)
2η = +
Collision dissipation energy
( )
23
ss 0,ss 2
2
s p p s
p 12 1 e g
d
θ
−
γ = ρ α θ
π
Transfer of kinetic energy
qp 3kqp s
METHODOLOGY
Operational Conditions
The conditions and geometries adopted in this study are shown in Table 2. The particle used was soybean seed with a density and a characteristic diameter of 1173 kg/m3 and 6.0 mm, respectively. The static bed porosity was 0.37. Under condition E2 the draft tube was not used. Under all the other conditions a spouted bed with a draft tube was used.
Under condition E1 experimental and simulated results were obtained for the two-dimension spouted bed with angle of the conical part the being 60º and the diameter of the cylindrical part being 0.250m. The two-dimensional spouted bed used under this condition is shown in Figure 1. The image analysis technique was adopted for determination of the experimental velocity profiles for the soybean seeds. Images of the particles in motion were recorded using a high-speed camera (minimum 250 frames/second and maximum 2000 frames/second).
The maximum speed of the camera (2000 frames/second) was used in the spout region. The quality of the images improved with the use of two 1500 W lamps fixed laterally and one fixed at the front of the bed.
In another stage of this work, the characteristic fluid-dynamic curves for pressure drop as a function of airflow rate were obtained for different bed heights of the cylindrical spouted bed, as described for condition E2 (Table 2). The experimental results obtained with the conventional spouted bed (Dc= 0.21 m and Dc/Di=6) were compared with the simulations.
In the sequence of this works, simulations conditions (E3, E4 and E5) of a cylindrical spouted bed with Dc/Di=5, 6 and 7 (Dc is the diameter of the cylindrical part and Di, diameter of the gas inlet) were conducted. These simulations were carried out for three different distances (40 mm, 50 mm and 60 mm) between the base of the bed and the draft tube. For these four conditions (E2, E3, E4 and E5), the diameter of the cylindrical part and conical angle were 0.210 m and 60º, respectively.
Figure 1: Two-dimensional spouted bed and its respective dimensions
Table 2: Conditions and geometries adopted in this study
Di Dc/Di He With a Draft Tube
E1 0.050 5 0.220 yes
E2 0.035 6
0.150 0.190 0.250
no
E3 0.042 5 0.147 yes
E4 0.035 6 0.150 yes
Simulation Conditions
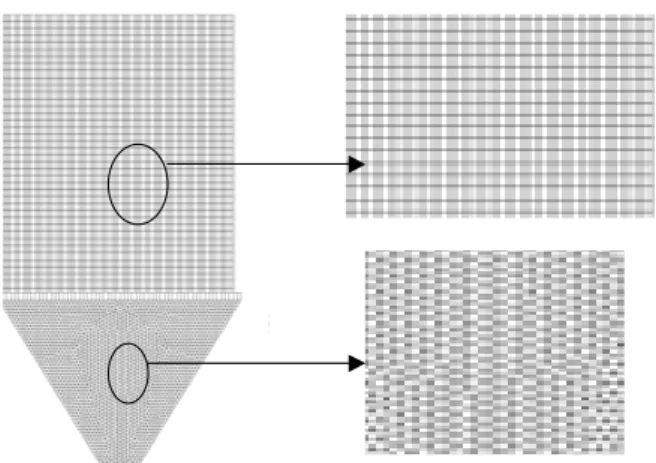
The typical aspects of the meshes adopted in each study can be seen in Figure 2. In the conical part unstructured meshes with triangular cells were used and in the cylindrical part structured meshes with rectangular cells were adopted. The meshes used in this work had an average of 8400 cells. The cell size, fixed as 10% above the particle diameter, was sufficient to accommodate an individual particle.
In the simulations the following conditions were adopted:
Restitution coefficients of particles was set at e = 0.9;
The finite volume discretization method was used.
A time step of 0.0001 s with 15 iterations per time step was chosen;
The relative error between two successive
iterations was of 10-3 for each scaled
residual component;
The pressure-velocity coupling was obtained
using the SIMPLE method;
The linearized equations were solved using a
block algebraic multigrid method;
Inlet velocity was used as the inlet boundary
condition;
Outlet pressure was used as the outlet boundary condition;
Figure 2: Typical mesh adopted in this work
RESULTS AND DISCUSSIONS
The results obtained for each condition will be presented according to the sequence given in Table 2.
Condition E1
As described previously, condition E1 refers to the study with soybean seeds in a two-dimensional spouted bed. The values of particle velocity obtained in the spout and annular regions are shown in Figures 3 and 4, respectively.
It can be observed in Figure 3 that particle velocity in the spout region decreases significantly with longitudinal position on the axis. Good agreement is observed between the simulated and experimental values in the two regions studied.
Condition E2
Important information in the study of a spouted bed is the characteristic fluid-dynamic curves (pressure drop as a function airflow rate). In
condition E2 simulations were carried out to
determine the characteristic fluid-dynamic curves of a conical-cylindrical spouted bed for different heights of the static bed, as described in Table 2.
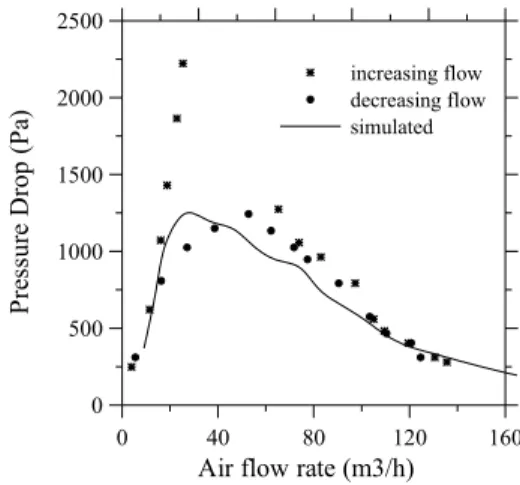
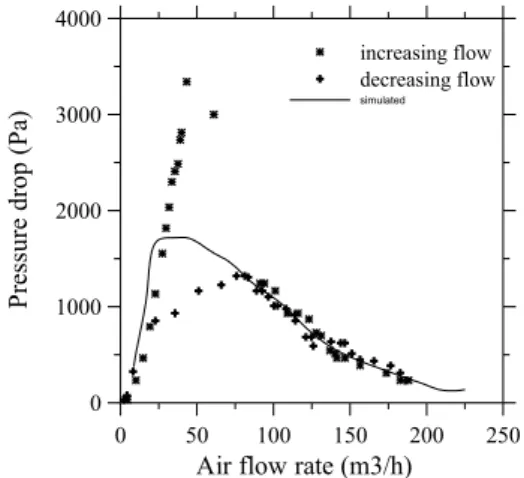
Figures 5, 6 and 7 refer to the three situations studied under condition E2 for static heights of 0.15, 0.19 and 0.25 m, respectively. The simulated characteristic fluid-dynamic curves for each height of static bed (He) were obtained through 12 simulations, for different airflow rates.
simulated pressure drop values fall into the middle region, between the experimental values for paths of increasing flow rate and for paths of decreasing flow rate. For the region with the highest airflow rate, a good proximity between simulated and experimental values of pressure drop is observed.
For each simulation graphs were obtained for pressure drop fluctuation as a function of simulation time. The value of pressure drop adopted for each simulation was the average value. A typical graph used in determination of a simulated point of pressure drop is shown in Figure 8.
The simulation results on E2 condition made it possible to obtain the minimum spouting airflow rate. The minimum spouting condition can be identified through analysis of the simulated distribution of the solids volume fraction (Figure 9).
Figure 9 contains profiles of solids volume fraction for different spouting airflow rates. Fig. 9 (a)
and (b) refers to a spouting airflow rate lower than the minimum spouting flow rate and the Fig. 9 (d), (e) and (f) refers to a spouting airflow rate higher than the minimum spouting flow rate. The minimum spouting condition can be seen in Fig. 9 (c).
The same procedure was adopted to identify the minimum spouting airflow rate for other conditions (He=0.15 and 0.19 m) of E2. Table 3 shows the minimum spouting flow rate obtained experimentally, calculated with the Mathur and Gislher equation and simulated by CFD.
It can be observed in the Table 3 results that there is good agreement between the simulated and experimental values with a relative error of 4 %. The simulation results were more satisfactory than those obtained with the Mathur and Gishler (1955) equation. Therefore, the Eulerian multiphase model can be adopted with good precision to identify the minimum spouting condition.
0.10 0.15 0.20 0.25 0.30 0.35
Bed Height (m)
1.30 1.40 1.50 1.60 1.70
P
a
rt
ic
le
V
e
loc
it
y i
n
S
p
o
u
t Re
gi
on
(m
/s
)
Experimental Simulated
0.17 0.18 0.19 0.20 0.21 0.22 Bed Height (m)
0.02 0.04 0.06
P
a
rt
ic
le
V
e
loc
it
y i
n
A
nnul
a
r Re
gi
on (m
/s
)
Experimental Simulated
Figure 3: Particle axial velocity in the spout region Figure 4: Particle axial velocity in the annular region
0 40 80 120 160
Air flow rate (m3/h) 0
400 800 1200 1600 2000
P
re
ss
u
re
D
rop
(
P
a)
increasing flow decrasing flow
Simulated
0 40 80 120 160
Air flow rate (m3/h) 0
500 1000 1500 2000 2500
P
re
ss
u
re
D
rop (P
a)
increasing flow decreasing flow simulated
Figure 5: Characteristic fluid-dynamic curves of pressure drop versus airflow rate of the
spout for He=0.15m
Figure 6: Characteristic fluid-dynamic curves of pressure drop versus airflow rate of the
0 50 100 150 200 250 Air flow rate (m3/h)
0 1000 2000 3000 4000
P
re
ss
u
re
d
rop
(P
a)
increasing flow decreasing flow
simulated
Simulation time (s)
P
re
ss
u
re
D
ro
p
(P
a)
P
re
ss
u
re
D
ro
p
(
P
a)
10.8 11 11.2 11.4 11.6 11.8 12
Figure 7: Characteristic fluid-dynamic curves of pressure drop versus airflow rate
of the spout for He=0.25m
Figure 8: Typical pressure drop fluctuation
(a) Air flow rate = 112.57 m3/h (b) Air flow rate = 121.23 m3/h (c) Air flow rate = 129.88 m3/h
(d) Airflow rate = 138.54 m3/h (e) Airflow rate = 147.20 m3/h (f) Airflow rate = 155.86 m3/h Figure 9: Distribution of solid volume fraction versus airflow rate for condition E2 and He=0.25m
Table 3: Calculated and experimental values of Qjmin
He (m) Qjmin (m
3
/h) Experimental
Qjmin (m3/h)
Mathur and Gisher (1955)
Qjmin (m3/h)
Simulated (Fluent 6.1.18)
0.15 83.7 104.0 82.5
0.19 105.0 117.0 95.3
0.25 131.0 134.2 129.3
Conditions E3, E4 and E5
To study the E3, E4 and E5 conditions a factorial design with three levels for the variables Dc/Di and hd (distance between the draft tube and bed base)
was used. The three levels for Dc/Di were 5, 6 and 7 and for distances between the draft tube and bed base they were 40, 50 and 60mm. The same airflow rate of 0.04 m3/s was adopted in all simulations.
From the experimental data on conditions E3, E4 and E5, an equation for calculating the pressure drop as a function of the variables studied was obtained by multiple regression. The parameters of Equation (12) were those significant in a Student’s t-test with a maximum probability of error of 5%. Equations (13) and (14) refer to dimensionless variables for Dc/Di (X1) and hd (X2), respectively.
2
1 2
QP=1311.5+207.3 X +306.1 X with R =0.965 (12)
1
X =(Dc / Di)-6 (13)
d 2
h -50 X =
10 (14)
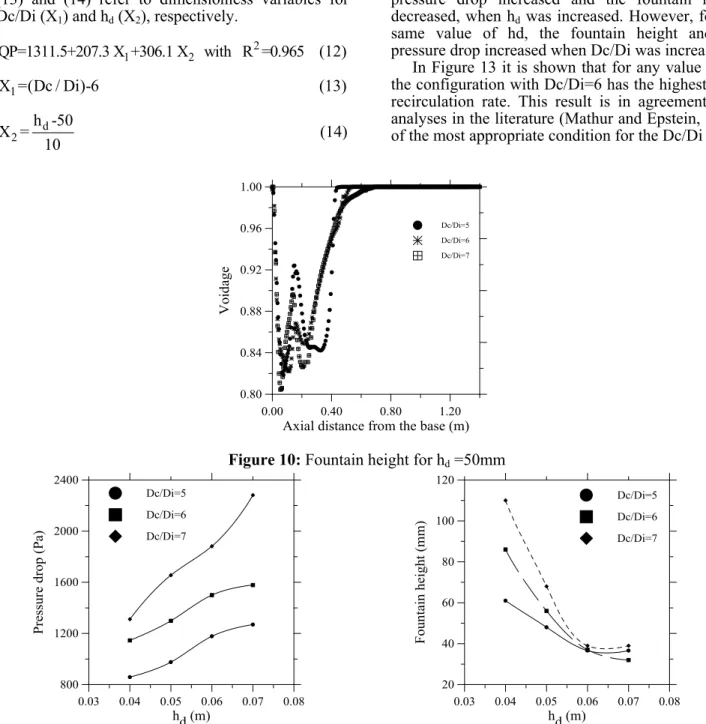
Using the simulation results on the voidage distribution it was possible to determine the fountain height for conditions E3, E4 and E5. To do so, a simulated vertical line was placed at the center of the bed moving towards the top. The voidage distribution profile was generated on this line. The point at which voidage is maximum (voidage=1) was considered the fountain top. Figure 10 represents a curve used in the determination of fountain height for hd=50 mm.
The simulated results presented in Figures 11, 12 and 13 refer to the effect of variables Dc/Di and hd
on pressure drop, fountain height and solids recirculation rate, respectively. In Figures 11 and 12 it is shown that for the same value of Dc/Di, the pressure drop increased and the fountain height decreased, when hd was increased. However, for the
same value of hd, the fountain height and the pressure drop increased when Dc/Di was increased.
In Figure 13 it is shown that for any value of hd,
the configuration with Dc/Di=6 has the highest solid recirculation rate. This result is in agreement with analyses in the literature (Mathur and Epstein, 1974) of the most appropriate condition for the Dc/Di ratio.
0.00 0.40 0.80 1.20
Axial distance from the base (m)
0.80 0.84 0.88 0.92 0.96 1.00
V
o
id
a
g
e
Dc/Di=5 Dc/Di=6 Dc/Di=7
Figure 10: Fountain height for hd =50mm
0.03 0.04 0.05 0.06 0.07 0.08 hd (m)
800 1200 1600 2000 2400
P
re
ss
ure
drop (P
a
)
Dc/Di=5
Dc/Di=6
Dc/Di=7
0.03 0.04 0.05 0.06 0.07 0.08 hd (m)
20 40 60 80 100 120
F
ount
a
in he
ight
(m
m
)
Dc/Di=5
Dc/Di=6
Dc/Di=7
0.04 0.05 0.06 0.07 0.08 hd (m)
4.00 6.00 8.00 10.00
5.00 7.00 9.00
K
g of t
h
e S
o
y
b
ea
n
/s
ec
o
n
d
(e
-2
K
g/
s)
Dc/Di=5 Dc/Di=6 Dc/Di=7
Figure 13: Solid recirculation rate as a function of hd
CONCLUSIONS
The typical characteristic fluid dynamics of the spouted bed was obtained in the present work. The particle velocity, minimum spouting flow rate and characteristic fluid-dynamic curves of the spouted bed were obtained using a Eulerian granular multiphase model. The results obtained in the simulation showed good agreement with the experimental data under the conditions studied. The results obtained for solids recirculation rate, pressure drop and fountain height are important project information and can be obtained through the methodology used in this work.
ACKNOWLEDGMENTS
The authors are thankful to FAPEMIG for the financial support received.
NOMENCLATURE
D
C Drag coefficient, defined
different ways
dimensionless
s
d Particle diameter m
Ds Distance between grains m
ess Restitution coefficient dimensionless
d
f Drag force N
gG Gravitational acceleration m/s2
0,ss
g Radial distribution function dimensionless
fs
K Coefficient of momentum
exchange between fluid phase f and solid phase
s
p Pressure Pa
s
p Solids pressure Pa
QP Pressure drop Pa
r Radius of the inlet spouted
bed nozzle
m
s
Re Relative Reynolds number dimensionless
v Volume m3
v
G Velocity vector m/s
X1 codified variable (Dc/Di) dimensionless
X2 codified variable (hd) dimensionless
Greek Symbols
α Volume fraction, dimensionless
µ Dynamic viscosity, cP
s
θ Granular temperature, m2/s2
ρ Density, kg/m3
τ Stress tensor, Pa
τ Shear stress, Pa
Subscript
f Fluid phase (-)
s Solid phase (-)
REFERENCES
Benkrid, A. and Caram, H. S., Solid Flow in the Annular Region of a Spouted Bed, AIChE Journal, Vol. 35, pp. 1328-1336 (1989).
Reactor with Continuous Catalyst Feed in the Benzyl Alcohol Polymerization, Ind. Eng. Chem. Res., 26, pp.1297-1304 (1987).
Chatterjee, A., Effect of Particle Diameter and Apparent Particle Density on Internal Solid Circulation Rate in Air Spouted Beds, Ind. Engng Chem. Process Des. Dev., Vol. 9, pp. 531-540, (1970).
Cheng, Y., Wei, F., Guo, Y. and Jin, Y., CFD Simulation of Hydrodynamics in the Entrance Region of a Downer, Chemical Engineering Science, Vol. 56, Issue 4, pp. 1687-1696 (2001).
Chiesa, M., Mathiesen,V., Melheim, J. A. and
Halvorsen, B., Numerical Simulation of Particulate Flow by the Eulerian–Lagrangian and the Eulerian–Eulerian Approach with Application to a Fluidized Bed, Computers and Chemical Engineering, Vol. 29, pp. 291-304 (2005).
Du, W., Bao, X., Xu, J. and Wei, W., Computational Fluid Dynamics (CFD) Modeling of Spouted Bed: Assessment of Drag Coefficient Correlations, Chemical Engineering Science, Vol. 61, pp. 1401-1420 (2006).
Duarte, C. R., Barrozo, M. A. S. and Murata, V. V.,
Proc. of the 14th International Drying
Symposium, pp. 581-588 (2004).
Ergun, S., Fluid Flow Through Packed Columns, Chem. Eng. Prog., Vol. 48(2), pp. 89-94 (1952) Gidaspow, D., Multiphase Flow and Fluidization,
Academic Press, San Diego (1994).
Gidaspow, D., Bezburuah, R. and Ding, J., Hydrodynamics of Circulating Fluidized Beds, Kinetic Theory Approach in Fluidization, Proceedings of the 7th Engineering Foundation Conference on Fluidization, pp. 75-82 (1992). Gómez, L. C. and Milioli, F. E., Collisional Solid's
Pressure Impact on Numerical Results from a Traditional Two-Fluid Model, Powder Technology, Vol. 149, Issues 2-3, pp. 78-83 (2005).
He, Y. L., Lim, C. J., Grace, J. R. and Zhu, J. X., Measurements of Voidage Profiles in Spouted Beds, Canadian Journal of Chemical Engineering, Vol. 72, pp.229-234 (1994).
Kawaguchi, T., Sakamoto, M. and Tsuji, T. T., Quasi-Three-Dimensional Numerical Simulation of Spouted Beds in Cylinder, Powder Technology, Vol. 109, pp. 3-12 (2000).
Kim, S. J. and Cho, S. Y., Particle Velocity and Circulation Rate in Liquid Spouted Beds, Korean. J. Chem. Engng. Vol. 8, pp. 131-136 (1991). Lefroy, G. A. and Davidson, J. F., The Mechanism
of Spouted Beds, Transactions of the Institution
of Chemical Engineers, Vol. 47, pp.120-128 (1969).
Lim, C. J. and Mathur, K. B., Modelling of Particle Movement in Spouted Beds, In Fluidization, eds J. F. Davidson and D. L. Keairns, Cambridge University Press, Cambridge, pp. 104-109 (1978). Lun, C. K. K., Savage, S.B. and Jeffrey, D.J., Kinetic Theories for Granular Flow: Inelastic Particles in Couette Flow and Slightly Inelastic Particles in General Flow Field, Journal of Fluid Mechanics, Vol. 140, pp. 223–256 (1984).
Mathur, K. B. and Epstein, N., Spouted Beds, Academic Press Inc. LTD., New York, 304p. (1974).
Mathur, K. B. and Gishler, N., A Technique for Contacting Gases with Coarse Solid Particles, AIChE Journal, Vol. 1, pp.157-164 (1955). Morgan, M. H., Day, J. Y. and Littman, H., Spout
Voidage Distribution, Stability and Particle Circulation Rates in Spouted Beds of Coarse Particles, I. Theory. Chem. Engng. Sci., Vol. 40, pp. 1367-1377 (1985).
Olazar, M., San José, M. J., Lamosas, R. and Bilbao, J., Hydrodynamics of Sawdust and Mixtures of Wood Residues in Conical Spouted Beds, Ind. Engng. Chem. Res. 33, pp. 993-1000 (1994a). Olazar, M., San José, M. J., Zabala, G. and Bilbao,
J., A New Reactor in Jet Spouted Bed Regime for Catalytic Polymerizations, Chem. Engng. Sci., Vol. 49, pp. 4579-4588 (1994b).
Olazar, M., San Jose, M. J., Aguayo, A. T., Arandes, J. M. and Bilbao, J., Stable Operation Conditions
for Gas-Solid Contact Regimes in Conical
Spouted Beds, Ind. Engng. Chem. Res. 31, pp. 1784 -1791 (1992).
Olazar, M., San José, M. J., Izquierdo, M. A., Salazar, A. O. and Bilbao, J., Effect of Operation Conditions on Solid Velocity In Spout, Annulus and Fountain of Spouted Beds, AIChE Journal, Vol. 56, pp.3585-3594 (2001).
Randelman, R., Benkrid, A. and Caram, H. S., Investigation of the Solid Flow Pattern in a Spouted Bed, A.I.Ch.E. Symp. Ser. 83, pp. 23-28 (1987).
Roy, D., Larachi, F., Legros. R. and Chaouki, J., A Study of Solid Behavior in Spouted Beds Using 3-D Particle Tracking, The Canadian Journal of Chemical Engineering, Vol. 72, pp. 945-952 (1994).
Processing, Vol. 44, Issue 2, pp. 153-157 (2005a).
San José, M. J., Olazar, M., Alvarez, O., Morales, A. and Bilbao, J., Local Porosity in Conical Spouted Beds Consisting of Solids of Varying Density, Chemical Engineering Science, Vol. 60, Issue 7, pp. 2017-2025 (2005b).
San José, M. J., Olazar, M., Alvarez, S. and Bilbao, J., Local Bed Voidage in Conical Spouted Beds, Ind. Engng. Chem. Res., Vol. 37, pp. 2553-2558 (1998).
Shintaro, T., Wang, S., and Rhodes, M., Discrete Element Simulation of a Flat-Bottomed Spouted Bed in the 3-D Cylindrical Coordinate System, Chemical Engineering Science, Vol. 59, pp. 3495 – 3504 (2004).
Syamlal, M. and O'Brien, T. J., Computer Simulation of Bubbles in a Fluidized Bed, AIChE Symp. Series, Vol. 85, pp. 22-31 (1989).
Taghipour, F., Ellis, N. and Wong, C., Experimental and Computational Study of Gas-Solid Fluidized Bed Hydrodynamics, Chemical Engineering Science,Vol. 60, pp. 6857-6867 (2005) .
Thorley, B., Saunby, J. B., Mathur, K. B. and Osberg, G. L., An Analysis of Air and Solids Flow in a Spouted Wheat Bed. Can. J. Chem. Engng., Vol. 37, pp.184-192 (1959).
Tsuji, T., Hirose, M., Shibata, T., Uemaki, O. and Itoh, H., Particle Flow in Annular Region of a Flat-Bottomed Spouted Bed, Transactions of the Society of Chemical Engineers, Japan 23-4, pp. 604-605 (1997).
Uemaki, O., Yamada, R. and Kugo, M., Particle Segregation in a Spouted Bed of Binary Mixtures. Can. J. Chem. Eng., Vol. 61, pp.303-307 (1983). Van Velzen, D., Flamm, H. J., Langenkamp, H. and
Casile, A., Motion of Solids in Spouted Beds, Canadian Journal of Chemical Engineering, Vol. 52, pp. 156-161 (1974).
Volpicelli, G., Raso, G. and Massimilla, L., Gas and Solid- Flow in Bidimensional Spouted Beds, Proceedings of the International Symposium on Fluidization, ed. A. A. H. Drinkenburg, pp. 123-133 (1967).
Waldie, B. and Wilkinson, D., Measurement of Particle Movement in a Spouted Bed Using a New Microprocessor Based Technique. Can. J. Chem. Engng.,Vol.64, pp. 944-949 (1986). Wang, Z. G., Bi, H. T. and Lim, C. J., Particle
Interlocking in Conical Spouted Beds Chemical Engineering Science, Vol. 60, pp. 5276-5283 (2005). Wen, C. Y. and Yu, Y. H., Mechanics of Fluidization,
Chem. Eng. Prog. Symp. Series, Vol. 62, pp. 100-111 (1966).