Vol.52, n. 5: pp. 1225-1234, September-October 2009
ISSN 1516-8913 Printed in Brazil BRAZILIAN ARCHIVES OF
BIOLOGY AND TECHNOLOGY A N I N T E R N A T I O N A L J O U R N A L
Batch and Continuous Extraction of Bromelain Enzyme by
Reversed Micelles
Ana Maria Frattini Fileti
*, Gilvan Anderson Fischer, José Carlos Curvelo Santana
and
Elias Basile Tambourgi
Universidade Estadual de Campinas; Faculdade de EngenhariaQuímica; Av. Albert Einstein, 500; P. C.: 6066; 13083– 970; Barão Geraldo; Campinas - SP - Brasil
ABSTRACT
The main aim of this study was to optimize the conditions for bromelain extraction by reversed micelles from pineapple juice (Ananas comosus). The purification was carried out in batch extraction and a micro-column with pulsed caps for continuous extraction. The cationic micellar solution was made of BDBAC as a surfactant, isooctane as a solvent and hexanol as a co-solvent. For the batch process, a purification factor of 3 times at the best values of surfactant agent, co-solvent and salt concentrations, pH of the back and forward extractions were, 100 mM, 10% v/v, 1 M, 3.5 and 8, respectively. For the continuous operation, independent variables optimal point was determined: ratio between light phase flow rate and total flow rate equal to 0.67 and 1 second for the time interval between the pulses. This optimal point led to a productivity of 1.29 mL/min and a purification factor of 4.96.
Key words: reversed micelles, liquid-liquid extraction, bromelain, pineapple, optimization, surface response
*
Author for correspondence:[email protected]
INTRODUCTION
In many biotechnological industries, including food and pharmaceuticals, the selective separation of a protein out of fermentation broths or vegetable sources has been a primary interest for downstream processing operations. It is difficult and expensive to selectively recover a targeted protein from a broth due to the low protein concentration and the similarity of the physical properties between proteins present in the same solution (Albertsson, 1986; Diamond and Hsu, 1992; Zaslasvsky, 1995).
The liquid-liquid extraction process consists of transferring a substance from a liquid mixture to another immiscible (or partially miscible) liquid phase by putting them in contact. This process is widely used in chemical and pharmaceutical industries, such as in the recovery of antibiotics or
organic acids from fermentation broths.
Fileti, A. M. F., et al. 1226
In order to avoid the protein denaturation, the liquid-liquid extraction by reversed micelles used. Reversed micelles are aggregates of surfactant molecules containing an inner core of water molecules, dispersed in a continuous organic solvent medium. These reversed micelles are
capable of selectively solubilising polar
compounds in an apolar solvent and are useful for recovering a specific biomolecule from aqueous solutions, such as fermentation broths or cell culture media. Reversed micelles extraction is considered a versatile and useful process for purifying the proteins (Kilikian et al., 2000). Bromelain is the name of a group of powerful protein-digesting, or proteolytic enzymes that are
found in the pineapple plant (Ananas comosus).
Discovered in 1957 and widely studied since then, bromelain is particularly useful for reducing muscle and tissue inflammation and as a digestive aid. Besides the pharmacological effects, bromelain is also employed in food industries, such as breweries and meat processing. The optimum pH and temperature of bromelian are 6.5-7.5 and 37°C, respectively (Lopes et al., 2005, 2007 and 2009; Silveira et al., 2009).
The main aim of the present work was to optimize the conditions for bromelain extraction by
reversed micelles from pineapple juice.
Experimental batch and continuous liquid-liquid extraction processes were studied. A design of experimental methodology was employed to determine the best concentrations of surfactant agent, co-solvent and salt, and the pH of the back extraction and the pH of the forward extraction (Barros Neto et al., 1995 and 2001; Biazus et al., 2005, 2006 and 2007; Box et al., 1978; Ferreira et al., 2007; Severo Jr. et al., 2007; Silva et al., 2008).
MATERIALS AND METHODS
Bromelain sample preparation
Fruit bromelain (EC 3.4.22.5) was obtained from the fruit extract of the Perola pineapple species. Pineapple pulp was triturated and filtered. The filtrate, called pineapple juice, contained the
bromelain enzyme. Samples were frozen at -5oC
(Lopes et al., 2005, 2007 and 2009; Silveira et al., 2009).
Micellar solution
The cationic micellar solution was made up of BDBAC as a surfactant, isooctane as a solvent and hexanol as a co-solvent (Hasmann, 2000; Kilikian et al., 2000).
Backward extraction solution
The bromelain-rich phase (raffinated) was treated with a buffered phosphate solution (citric acid/sodium phosphate) and sodium chloride, which was added until conditions of DOE were reached (Ferreira et al., 2007; Hasmann et al., 1999 and 2000; Kilikian et al., 2000).
Pulsed caps micro-column
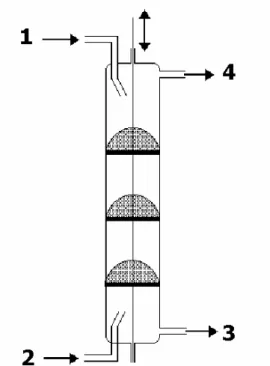
A scheme of the extraction in micro-column (continuous system) is shown in Figure 1. The column was made of glass, 19 cm and with 2.54 cm internal diameter. Three perforated caps were mounted on a central stainless steel stem at a distance of 4 cm. The caps were made of mesh 24 sieves, with a 38 % free flowing area. A pulse frequency controller drove the movements of the stem, 2.8 cm up and down. This way, part of the light phase was pulverized and a uniform dispersion was formed. Another portion of the light phase was retained beneath the cap, increasing the contact between the phases. The inlet flow rates of the dispersed and continuous phases were maintained constant by using previously calibrated peristaltic pumps (Biazus et al., 2007).
Experimental Procedures
Batch extraction
Figure 1 - Extraction micro-column with pulsed caps: (1) Pineapple juice inlet (continuous phase); (2) Micellar solution inlet (dispersed); (3) Heavy phase outlet (extracted); (4) Light phase outlet (raffinated).
Continuous extraction
The column was filled with the pineapple juice. The feeding pumps were started up in such a way that the total flow rate (pineapple juice plus micellar solution streams) was set at 8mL/min (constant) and the ratio between light phase flow rate and total flow rate was set at 0.5. Afterwards, the pulse frequency (i.e., the time interval between the pulses) was adjusted to 4 seconds (Biazus et al., 2007).
After the steady state was reached (about 15 minutes), the operating conditions were changed according to the DOE (Table 4). A new stationary point was found. Samples were collected from the raffinated phase (micellar phase outlet) at every steady state achieved.
Backward Extraction
The protein rich-phase (micellar) obtained from the extraction (batch or continuous operation) was mixed with the same volume of the backward extraction solution. The tube was vortexed for 3 minutes. In order to split the phases, the mixture was centrifuged at 8000 rpm for 5 min. The light
phase (micellar) was rejected. Assays of enzyme activity and total protein were carried out on samples from the heavy aqueous phase (Hasmann et al., 1999 and 2000; Kilikian et al., 2000).
Enzyme activity assay
Enzyme activity was determined by enzymatic
hydrolysis of casein (2% w/v) at pH 7.5, 37oC for
10 min. Tricloroacetic acid (TCA) was used in the precipitation for the non-hydrolyzed product. The amount of soluble peptides in TCA was determined by measuring the absorbance at 280 nm. The method defines one unit of enzyme activity as the amount of enzyme that modifies by 1.0 the absorbance at 280 nm (Murachi, 1976; Lopes et al., 2005, 2007 and 2009; Silveira et al., 2009).
Total protein assay
Fileti, A. M. F., et al. 1228
Performance indexes
Total protein yield (TP):
100 . (%)
1 2
P P
TP = (1)
where P1 is the total protein concentration (mg/L)
from the pineapple juice and P2 is the total protein
of the backward extraction solution.
Purification factor (PF)
PF shows the increase in purity of the proteins:
1 1
2 2
P A
P A
PF = (2)
where A1 is the enzyme activity measurement (in
U/mL) from the pineapple juice and A2 is the
enzyme activity of the backward extraction solution.
Productivity (Pr)
Pr shows the quantity of protein that was transferred of crude to the raffinated phase.
TP rate flow phase
raffinated ).
(
Pr= (3)
Design of Experiments (DOE)
Batch extraction
A 25-1 factorial design was carried out to verify the
effects and interactions of range of concentration of the surfactant agent, the co-solvent and the salt concentrations, besides the pH of the back and forward extractions on the purification factor (PF) of the studied process (Barros Neto et al., 1995 and 2001; Biazus et al., 2005, 2006 and 2007; Box et al., 1978; Ferreira et al., 2007; Severo Jr. et al., 2007; Silva et al., 2008). Table 1 shows levels and experimental values of the factorial design variables.
Because the bromelain enzyme has positive charges distribution (i.e., up to the Isoeletric Point), the extraction pH range employed was of 6 to 8. However, the optimum pH was between 6.5 and 7.5 (Biazus et al., 2006; Lopes et al., 2005; 2007 and 2009; Silveira et al., 2009). The pH of back extraction ware 3.5 and 6. The range of concentrations was determined based on Hasmann et al., (1999 and 2000).
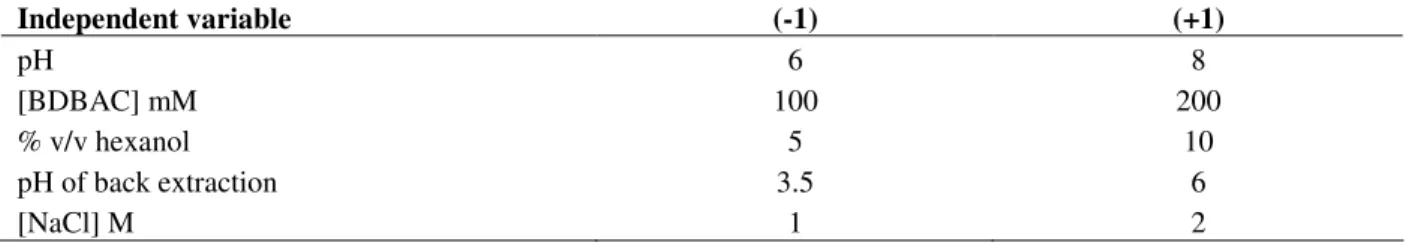
Table 1 - Levels and experimental values of the 25-1 fractional factorial design.
Independent variable (-1) (+1)
pH 6 8
[BDBAC] mM 100 200
% v/v hexanol 5 10
pH of back extraction 3.5 6
[NaCl] M 1 2
Continuous extraction
The concentrations of surfactant, co-solvent and salt, and the pH of the back and forward extractions were determined through the analysis of the results of the batch extraction factorial design (Table 4). Afterwards, a central composite design was carried out to the study of the continuous operating conditions. The independent
variables were: the ratio between light phase flow rate and total flow rate; and the time interval between the pulses. The effects over the purification factor (PF) and the productivity (Pr) were analyzed (Barros Neto et al., 1995 and 2001; Biazus et al., 2005, 2006 and 2007; Box et al., 1978; Ferreira et al., 2007; Severo Jr. et al., 2007, Silva et al., 2008).
Table 2 - Levels and experimental values of the central composite design.
Independent variable (-1) (0) (+1)
Light phase flow rate/ Total flow rate 0.3 0.5 0.7
RESULTS AND DISCUSSION
Batch extraction
Table 3 shows the 25-1 factorial design results for
the purification factor (PF), with two replicates.
The Statistica ® software, version 6.0 (Statsoft Inc., USA), was used in the analysis. Ranges and levels of the independent variables are given in Table 1.
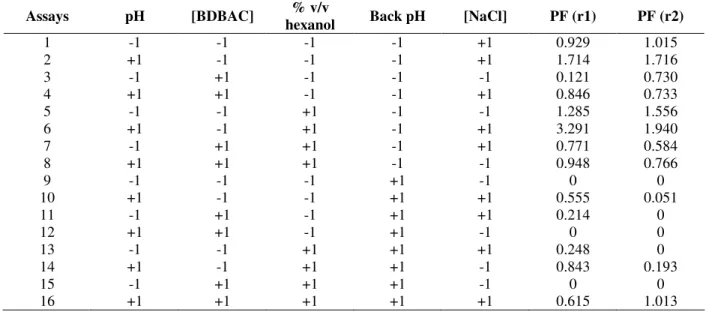
Table 3 - The 25-1 factorial design matrix and the results for the purification factor (PF), with two replicates (r).
Assays pH [BDBAC] % v/v
hexanol Back pH [NaCl] PF (r1) PF (r2)
1 -1 -1 -1 -1 +1 0.929 1.015
2 +1 -1 -1 -1 +1 1.714 1.716
3 -1 +1 -1 -1 -1 0.121 0.730
4 +1 +1 -1 -1 +1 0.846 0.733
5 -1 -1 +1 -1 -1 1.285 1.556
6 +1 -1 +1 -1 +1 3.291 1.940
7 -1 +1 +1 -1 +1 0.771 0.584
8 +1 +1 +1 -1 -1 0.948 0.766
9 -1 -1 -1 +1 -1 0 0
10 +1 -1 -1 +1 +1 0.555 0.051
11 -1 +1 -1 +1 +1 0.214 0
12 +1 +1 -1 +1 -1 0 0
13 -1 -1 +1 +1 +1 0.248 0
14 +1 -1 +1 +1 -1 0.843 0.193
15 -1 +1 +1 +1 -1 0 0
16 +1 +1 +1 +1 +1 0.615 1.013
The Pareto chart (Fig. 2) showed that only the salt concentration in the backward extraction solution did not present significant effect for the purification factor. The buffering solution seemed to be responsible for the enzyme expulsion from the micelles, independent of the salt concentration By means of the statistical analysis, negative
values of tstudent were observed for backward
extraction pH and BDBAC concentration. This implied that the purification factor increased when the lower level was set for these two independent variables. Inside the micelles, there was a positive
charge distribution and also had the bromelain enzyme. In consequence, repulsion between enzyme and the micelles occured and the enzyme recovery increased at the lower level of the backward extraction pH. In terms of surfactant, the small size of the bromelain enzyme (32.5 kDa) allowed its encapsulation even at the lower level of surfactant concentration. The increase in the surfactant concentration led to extremely large micelles, which turned the backward extraction more difficult.
.
Fileti, A. M. F., et al. 1230
Addition of the co-solvent to the cationic surfactant micelles solution caused a small increase in the size of the micelles. The purification factor increased when lower level of surfactant and the upper bound of the co-solvent concentration, were used.
The upper level of extraction pH led to high purification factors. The higher the difference between isoelectric point and the extraction pH, the more negative was the charge distribution and the higher was the attraction of the enzyme inside the micelles.
From the analysis and observing Table 3 (bold row), the best conditions were found for the bromelain recovery by reversed micelles from pineapple juice at a pH 8, a 100 mM of BDBAC concentration, a 10% of hexanol content and, at pH 3.5 of backward extraction and 1 M of NaCl concentration.
Continuous extraction
The best conditions determined from the analysis of the results of the batch extraction factorial design were used. Table 4 shows the central composite design of experiments matrix and the results for the purification factor (PF) and productivity (Pr), with two replicates. The Statistica ® software, version 6.0 (Statsoft Inc., USA), was used in the analysis. Ranges and levels of the independent variables are given in Table 2. From the results of Table 4 and the Pareto Chart
(Fig. 3), it was clear that the purification factor (PF) increased with pulse frequency within the operating range studied. The frequency must be high enough to promote suitable contact between the light and heavy phases, but it should not be extremely high as it could cause denaturation of the enzyme.
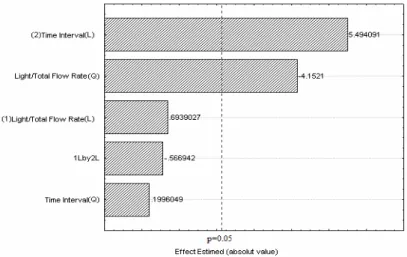
Pareto chart (Fig. 4) showed that the time interval between the pulses did not affect the productivity (Pr). Because the productivity is directly proportional to the light phase flow rate (Eq. 3) and because the operating range guaranteed the presence of total proteins in the backward
extraction solution (P2), the light phase flow rate
must be kept in the upper bound of the studied range.
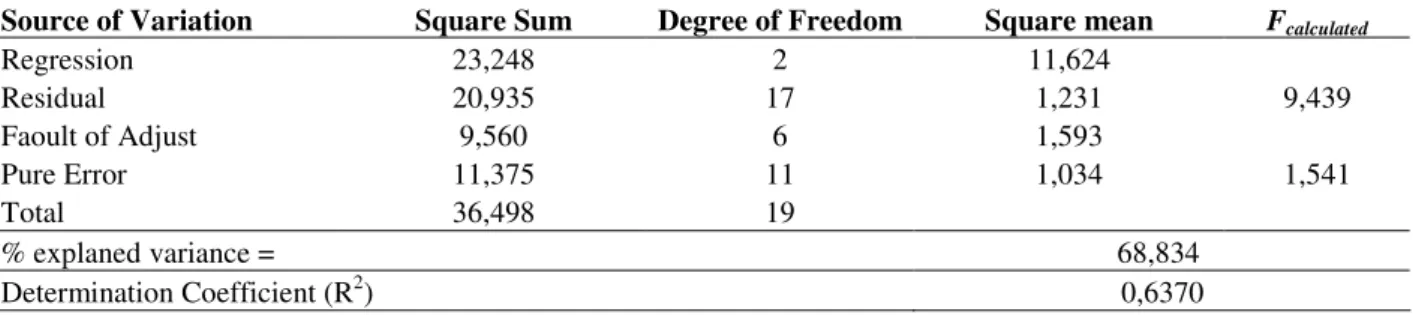
Table 5 shows the variance analysis (ANOVA) of fitting model for optimizing the continuous
extraction of bromelain from A. comosus by
reversed micelles.
According to Barros Neto et al. (2001 and 1995),
the first F-test (F calculated /F tabled) and second F-test
(F tabled/F calculated) must be higher than 1, for the
model to be significant and predictive, respectively. Thus, the model showed in Eq. 4 was significant and predictive. However, how
variances and R2 must be about 100% and 1,
respectively; their there are a high pure errors, or large deviation between the experimental data (Barros Neto et al., 2001; Biazus et al., 2005 and 2007; Ferreira et al., 2007; Severo Jr., et al., 2007).
Table 4 - The central composite design of experiments matrix and results for the purification factor (PF) and productivity (Pr), with two replicates (r).
Assays Light/total
flow rate
Time
interval PF (r1)
Pr (r1)
(mL/min) PF (r2)
Pr (r2) (mL/min)
1 -1 -1 2.554 0.665 2.271 0.742
2 -1 +1 5.608 0.779 5.391 0.762
3 +1 -1 3.204 0.937 3.372 0.931
4 +1 +1 6.036 1.082 5.605 1.161
5 -1.414 0 1.815 0.465 2.090 0.455
6 +1.414 0 1.806 1.219 1.766 1.231
7 0 -1.414 2.712 1.200 2.990 1.152
8 0 +1.414 4.243 1.199 4.271 1.205
9 (C) 0 0 3.860 1.076 5.590 0.902
10 (C) 0 0 3.316 1.151 3.285 1.058
11 (C) 0 0 5.075 1.014 3.516 1.304
12 (C) 0 0 5.571 0.988 3.774 1.085
Figure 4 - Pareto Chart of the effects for the productivity (Pr) for the central composite design. The point at which the effect were statistically significant (at p=0.05) is indicated by the broken vertical line.
Table 5 - Variance analysis (ANOVA) of fitting model for optimizing the continuous extraction of bromelain from
Ananas comosus by reversed micelles.
Source of Variation Square Sum Degree of Freedom Square mean Fcalculated
Regression 23,248 2 11,624
Residual 20,935 17 1,231 9,439
Faoult of Adjust 9,560 6 1,593
Pure Error 11,375 11 1,034 1,541
Total 36,498 19
% explaned variance = 68,834
Determination Coefficient (R2) 0,6370
Fileti, A. M. F., et al. 1232
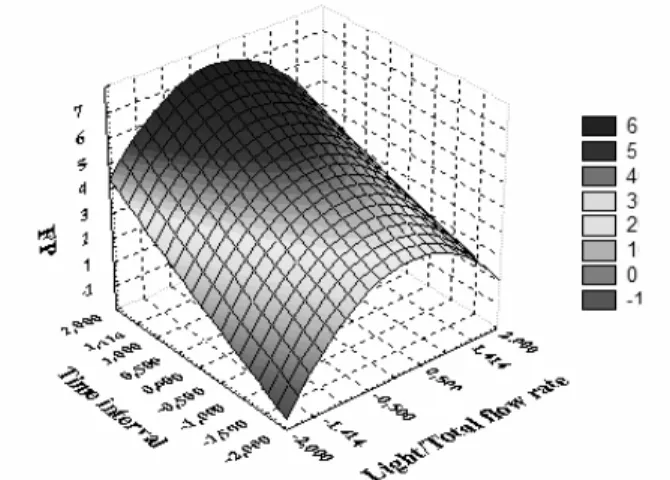
By square last regression the Eq. 4 was obtained; which was the fitting model for the continuous
extraction of bromelain from A. comosus in
conditions of this work is:
2 2
1 0,9511*
* 8115 , 0 2794 ,
4 x x
PF = − + (4)
where x1 is the light/total flow rate and x2 is the time interval.
In order to confirm the above analysis and find the best operating conditions, the objective function “desirability” of the Statistica ® software was used (Barros Neto et al., 1995 and 2001). This function assumes values in the range 0 to 1 and its maximization yields the global optimal operating point.
Figure 5 and 6 show the desirability response
surface as function of light phase flow rate/total flow rate vs interval between the pulses. The optimal conditions obtained were: light phase flow rate/total flow rate equal to 0.67 and time interval between pulses equal to 1 second, corroborating the previous observations. This led to a productivity of 1.29 mL/min and a purification factor of 4.96.
The value 1.25 was the maximum purification factor found for the bromelain recovery from pineapple fruit via two-phase aqueous extraction (Rabelo et al., 2004). This, in fact, shows that reversed micelles method was a promising way for enzyme purification. However, was minor than expanded bed adsorption (Silveira et al., 2009) and microfiltration (Lopes et al., 2009) separation processes.
Figure 5 - RSM for showing influence of factor on Pr valor for optimization of bromelain continuous extraction process by reversed micelles.
CONCLUSIONS
From the optimization of bromelain batch extraction, it was found that the maximum purification factor obtained was about 3 and the best values of the independent variables -
surfactant agent, co-solvent and salt
concentrations, pH of the back and forward extractions – were: 100 mM, 10% v/v, 1 M, 3.5 and 8, respectively. These conditions were then employed to the continuous runs.
In continuous extraction of bromelain from A.
comusus, the optimal point was determined: ratio
between light phase flow rate and total flow rate equal to 0.67 and 1 second for the time interval between the pulses. This optimal point led to a productivity of 1.29 mL/min and a purification factor of 4.96.
The results of the design of experiments, in terms of the purification factor, showed the efficiency of the pulsed micro-column equipment when compared to the batch extraction.
ACKNOWLEDGEMENT
The authors gratefully acknowledge CNPq (Brazil) for financial support.
RESUMO
Este trabalho teve como objetivo principal otimizar as condições para extração da bromelina do suco do
abacaxi (Ananas comosus) por micelas reversas. A
purificação foi feita usando o processo de extração em batelada e contínuo, este último em uma micro-coluna de campânulas pulsantes. A solução micelar catiônica foi preparada com o surfactante
BDBAC, i-octano como solvente e hexanol como
co-solvente. Na extração em batelada encontrou-se um fator de purificação de 3 vezes, e seus melhores valores de concentração do agente surfactante, co-solvente e sal, de pH da re-extração e extração, foram respectivamente iguais a: 100 mM, 10% v/v, 1 M, 3,5 e 8. Para a operação contínua, as variáveis independentes ótimas foram: 0,67 para a razão entre as taxas de fluxos da fase leve e a total e 1 s para o intervalo de tempo entre pulsos das campânulas. Este ponto ótimo leva a uma produtividade de 1,29 mL/min e a um fator de purificação igual a 4,96.
REFERENCES
Aires-Barros MR, Taipa MA, Cabral JMS. (1994), Isolation and purification of lipases. In: Lipases: their structure, biochemistry and application. Great Britain: Cambridge University Press, Eds. Wooley P, Petersen SB. pp. 234-270.
Albertsson, P. -Å. (1986), Partition of cell particles and macromolecules. 3ª ed., John Willey, New York. Barros Neto, B.; Scarminio, I. S. e Bruns, R. E. (2001),
Como Fazer Experimentos: Pesquisa e Desenvolvimento na Ciência e na Indústria. Vol. 1, 1ª edição, Coleção Livros - Textos, EDUNICAMP, Campinas – SP.
Barros Neto B, Scarmínio IS, Bruns, RE. (1995), Planejamento e otimização de experimentos. Campinas-SP, Brazil: EDUNICAMP, 291p.
Biazus, J. P. M.: Souza, A. G.; Santana, J. C. C. Souza, R. R.; Tambourgi, E. B. (2005), Optimization of drying process of Zea mays malt to use as alternative source of amylolytics enzymes. Brazilian Archive of Biology and Technology, v.48, Special; , 185-190. Biazus, J. P. M.: Souza, Santana, J. C. C. Souza, R. R.
(2006), Modelagem empírica do processo de biodegradação de efluentes protéicos por enzimas de Carica papaya sp. Revista Brasileira de Engenharia Agrícola e Ambiental, 10 (2), 436-440.
Biazus, J. P. M.: Santana, J. C. C. Souza, R. R.; Jordão, E.; Tambourgi, E. B. (2007), Continuous extraction of amylases from Zea mays malt in a PEG 4000/CaCl2 ATPS. Journal of Chromatography B,
858, 227-233.
Box GEP, Hunter GW, Hunter JS. (1978), Statistics for experimenters – an introduction to design, data analysis and model building. New York: John Wiley & Sons, 33 p.
Diamond, A. D., Hsu, J. T. (1992), Aqueous two phase systems for biomolecule separation. Advances in Biochemistry Engineering.47, 89-135.
Ferreira, G. B.; Evangelista, A. F.; Severo Junior, J.B.; Souza, R. R.; Santana, J. C. C.; Tambourgi, E. B.; Jordão, B. (2007). Partitioning Optimization of Proteins from Zea mays Malt in ATPS PEG 6000/CaCl2. Archive of Biology and Technology, 50,
n.3, p.557-564.
Hasmann, F. A.; Pessoa Jr., A.; Roberta, I. C. (2000). β -xylosidase recovery by reversed micells: use of cationic surfactant. Applied Biochemistry and Biotecnology, 84-86, 1101-1111.
Hansmann, F. A.; Pessoa Jr., A.; Roberto, I. C., (1999). Optimization of pH and temperature for xylanase recovery by reversed micelles. Biotechnology Techniques, 13 (4), p.239-242.
Fileti, A. M. F., et al. 1234
Brazilian Journal of Chemical Engineering, 17, 29-38.
Lopes, F.LG.; Severo Júnior, J.B.; Santana, J.C.C.; Souza, R.R.; Tambourgi, E.B. (2005), Utilization of plain membanes in bromelain enzymes concentration from pineapple (Ananas comosos) pulp. Brazilian Journal of Agricultural Products, 7 (1), 33-38. Lopes, F. L. G.; Severo Jr., J. B.; Santana, J. C. C.;
Souza, R. R.; Tambourgi, E. B. (2007), Avaliação de fenômenos redutores do fluxo de permeado em microfiltração do suco de abacaxi (Ananas comosus L. Merril). Exacta, São Paulo, 5 (2), 329-334.
Lopes, F. L. G.; Severo Jr., J. B.; Souza, R. R.; Ehrhardt, D. D.; Santana, J. C. C.; Tambourgi, E. B. (2009). Concentration by Membrane Separation Process of a medicinal product obtained from pineapple pulp. Brazilian Archive of Biology and Technology, 52 (2), 457-464.
Lowry, O. H.; Rosebrough, N. J.; Farr, A. L.; Randall, R. J. J. (1951), Biol. Chem.,193, 265.
Matiasson, B. and Kaul, R. (1986), Use of aqueous two-phase systems for recovery and purification in biotechnology. In: Separation, Recovery, and Purification and Biotechnology. American chemical Society, pp.79- 92.
Murachi T. (1976) Bromelain Enzymes. In: Lorand L. Methods in Enzymology. New York: Academic Press,. v.XLV, pp. 475-485.
Rabelo, APB; Tambourgi, EB; Pessoa Jr., A. (2004), Bromelain partioning in two-phase aqueous systems containing PEO-PPO-PEO block copolymers. Journal of Chromatography B, 807, 61-68.
Severo Jr., J. B.; Oliveira, L. S. S; Sardeiro, F. S.; Souza, R. R.; Lopes, F. L. G.; Santana, J. C. C.; Tambourgi, E. B. (2007), Response surface methodology to evaluation the recovery of amylases by hollow fiber membrane. Brazilian Archive of Biology and Technology, 50 (4), 713-718.
Silva, R. L. F. O. B.; Souza, R. R.; Santana, J. C. C.; Tambourgi, E. B. (2008). Imobilização de enzimas de milho maltado em gel. Ciência e Tecnologia de Alimentos, 28 (3), 642-648.
Silveira, E.; Souza Jr.; M. E.; Santana, J. C. C.; Chaves, A. C.; Porto, A. L. F.; Tambourgi, E. B. T. Expanded bed adsorption of bromelain (EC 3.4.22.33) from Ananas comosus crude extract. Brazilian Journal of Chemical Engineering, 26 (1), 149-157.
Zaslasvsky, B. Y. (1995), Aqueous two-phase partitioning- Physical Chemistry and Bioanalytical Applications, Mercel Dekker, Inc. New York.