ISSN 0104-6632 Printed in Brazil
www.abeq.org.br/bjche
Vol. 23, No. 04, pp. 451 - 460, October - December, 2006
Brazilian Journal
of Chemical
Engineering
PHOTOCATALYSIS AS A TERTIARY
TREATMENT FOR PETROLEUM
REFINERY WASTEWATERS
F. V. Santos
1, E. B. Azevedo
2, G. L. Sant’Anna Jr.
1and M. Dezotti
1*1Water Pollution Control Lab, Programa de Engenharia Química, COPPE, Universidade Federal do Rio de Janeiro,
Centro de Tecnologia, Bloco G, Sala 115, Phone: +(55) (21) 2562-8347, Fax: +(55) (21) 2562-8300, P.O. Box: 68502, CEP: 21941-972, Rio de Janeiro - RJ, Brazil.
E-mail: [email protected]
2
Chemistry and Environment Department, Faculdade de Tecnologia, Universidade do Estado do Rio de Janeiro, Estrada Resende-Riachuelo s/nº, Morada da Colina, CEP 27523-000, Resende - RJ, Brazil.
(Received: April 15, 2005 ; Accepted: June 8, 2006)
Abstract - Photocatalysis has been used as tertiary treatment for petroleum refinery wastewaters to comply with the regulatory discharge limits and to oxidize persistent compounds that had not been oxidized in the biological treatment. The wastewater is generated by the refinery and directly discharged into the Guanabara Bay (Rio de Janeiro). Although BOD removal is high, a residual and persistent COD, besides a somewhat high phenol content remains. Three photocatalysts were tested — TiO2 (Aldrich), ZnO (Aldrich), and TiO2
(P25, Degussa) — the third being the most active. The optimized conditions obtained with an experimental design were 3.0 g L–1 TiO2 and pH 6.3. The use of hydrogen peroxide (H2O2) showed no beneficial effect.
Removal of 93% of phenols, 63% of dissolved organic carbon (DOC), and more than 50% of oil and grease (OG) were achieved in the photocatalytic process, improving the quality of the treated wastewater.
Keywords: Photocatalysis; TiO2; Hydrogen peroxide; Petroleum; Refinery; Wastewater.
INTRODUCTION
A stricter control through environmental regulations and legislation has driven the great effort to seek alternative technologies, which have the following important features: enhanced efficiency, self-sustainability, and absence of hazardous wastes. In this scenario, photocatalysis, an oxidative process, has been emphasized, which in many cases, has resulted in the total mineralization of persistent organic compounds.
Photocatalysis is being applied to the elimination of several pollutants (e.g., alkanes, alkenes, phenols, aromatics, pesticides) with great success. In many cases, total mineralization of the organic compounds has been observed (Linsebigler et al., 1995,
Hoffmann et al., 1995, Bekbolet and Balcioglu, 1996, Shiavello, 1993).
Several photocatalysts, such as CdS, Fe2O3, ZnO,
WO3, and ZnS, have been studied, but the best
results have been achieved with TiO2 P25 supplied
by Degussa (Legrini et al., 1993).
The addition of small concentrations of hydrogen peroxide (H2O2), to photocatalytic systems may
process due to their high reactivity, are generated (Rajeshwar, 1995, Herrmann et al., 1993).
The wastewaters of an oil refinery are the waters resulting from washing the equipment used in the process, undesirable wastes, and sanitary sewage (Stepnowski, 2002). These effluents have high oil and grease contents, besides other organic compounds in solution. These pollutants form a residual COD that may pose serious toxic hazards to the environment. The effluents are quite variable, depending on the type of oil being processed, process configuration, and plant operation procedures. Therefore, defining the typical composition for these effluents is troublesome.
In the present work, photocatalysis has been used as tertiary treatment for petroleum refinery wastewaters in order to reduce the amount of pollutants to the level of the regulatory discharge limits and to oxidize persistent compounds that had not been oxidized in the biological treatment. The treatment sequence used by the refinery
(REDUC/PETROBRAS, a Brazilian oil refinery) is oil/water separation followed by a biological treatment. Although the process efficiency in terms of BOD removal is high, a residual and persistent COD, besides somewhat high phenol content, remains. The refining capacity of the refinery is 41,000 m3/day, generating 1,100 m3/h of wastewater, which are discharged directly into the Guanabara Bay (Rio de Janeiro).
MATERIALS AND METHODS
Wastewater
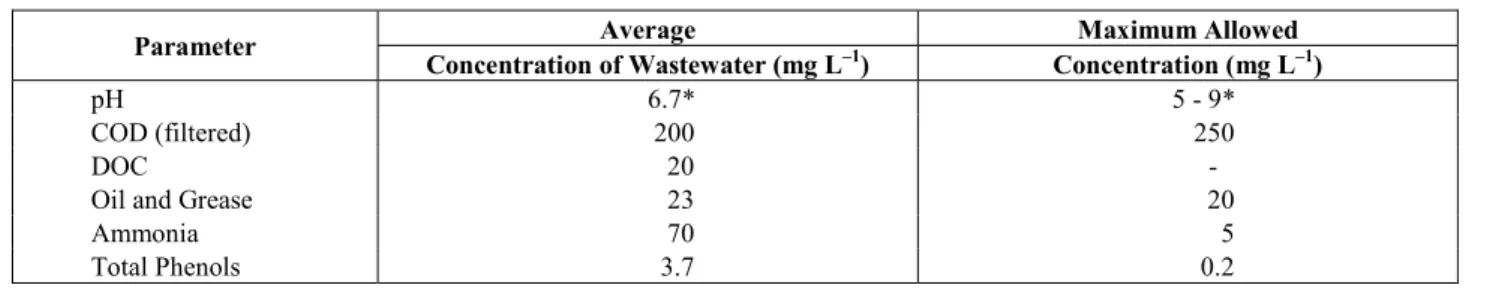
The wastewater was collected at the exit pipe of a series of aerated lagoons and stored at 4ºC with a pH < 2. A characterization of the wastewater, along with the pollutant limits imposed by the Rio de Janeiro Environmental Agency (FEEMA), is presented in Table 1.
Table 1: Wastewater characterization and limits imposed by the Rio de Janeiro Environmental Agency (FEEMA).
Average Maximum Allowed
Parameter
Concentration of Wastewater (mg L–1) Concentration (mg L–1)
pH 6.7* 5 - 9*
COD (filtered) 200 250
DOC 20 -
Oil and Grease 23 20
Ammonia 70 5
Total Phenols 3.7 0.2
* dimensionless
Reagents
All chemicals used were at least reagent grade and were used as received. Three different photocatalysts were tested: from Aldrich, ZnO and TiO2 (BET surface areas of 1.7 and 8.3 m
2
g–1); from Degussa, TiO2 P25 (30 nm particle size and 50 ± 15
m2 g–1 BET surface area). Solutions were prepared with distilled water.
Photocatalytic Experiments
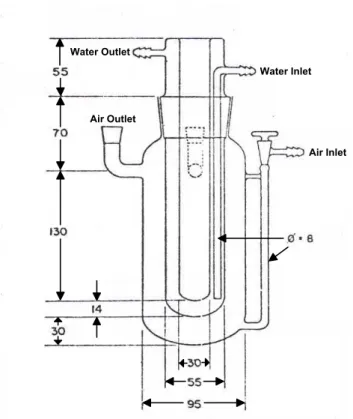
The first set of experiments was carried out in an open 250 mL reactor containing 60 mL of wastewater. In the second set of experiments, a
Pyrex® annular reactor containing 550 mL of
wastewater was used (De Paoli and Rodrigues,
Water Outlet
Air Outlet
Air Inlet Water Inlet
Figure 1: Pyrex® annular reactor. Dimensions in mm.
Experimental Design
An experimental design, OA36(3 3
), with ten repetitions of the central point, has been made to study the effect of the addition of hydrogen peroxide (Box, 1954). The variables and their respective levels (–1, 0, and +1) were pH (1.5, 6.3, and 11.0), photocatalyst (TiO2 P25 Degussa) concentration
(0.5, 3.0, and 5.5 g L–1), and hydrogen peroxide
concentration (5, 30, and 55 mmol L–1). The
irradiation time was always 60 minutes. A quadratic model without second-order interactions was fit to the experimental data.
Analyses
The UV spectra of the samples were obtained by scanning (400 through 189 nm) them in a Varian Carry 1E UV-Visible spectrophotometer (Bessa et al., 1999, 2001). The integrated areas under the scanning spectra were then calculated. Those areas represent semi-quantitatively the concentration of organic compounds having conjugated double and/or triple bondings (which includes all aromatic
compounds). Chemical oxygen demand (COD)
was measured according to the closed reflux method (APHA, 1992a) and dissolved organic carbon (DOC)
was measured in a Dhormann DC–190 TOC
analyzer. Degradation of the phenols was followed by determination of the concentration of unreacted phenol by a colorimetric method (APHA, 1992b) on a HACH DR/2000 visible spectrophotometer. The ammonia content was determined by a colorimetric method (Merck Spectroquant14752). The oil and grease was determined according to the Soxhlet extraction method (APHA, 1992c).
RESULTS AND DISCUSSION
Screening Experiments
Initially, a series of screening experiments was performed in order to determine the best initial pH and photocatalyst concentration. Three different solids were tested — ZnO and TiO2 (both supplied
by Aldrich) and TiO2 P25 from Degussa. Table 2
summarizes the best results achieved for each solid in terms of total phenol degradation, as this parameter showed the greatest departure from the limit imposed by the environmental agency. Control experiments in the dark showed no significant changes in the wastewater.
It can be seen that the TiO2 supplied by Aldrich is
ZnO was twice as active, but its major drawback is that severe losses of solid to the solution (solubilization) were observed during the experiments. Undoubtedly, the TiO2 P25 was the
most active photocatalyst (approximately 5 and 2.5 times more active than the TiO2 and ZnO supplied
by Aldrich, respectively). Moreover, it offers two other advantages: less photocatalyst can be used (3 g L-1 compared to 5 g L-1) and the pH is already near the effluent discharged, requiring no adjustment of pH. The fact that the best pH was at the zero charge point (pHzcp), where the TiO2 surface is neutral
(Kormann et al., 1991), is probably related to the non polar nature of the majority of the organic pollutants (alkanes) in the wastewater (Tanaka and Saha, 1994, Watts et al., 1994), although the concentration of alkanes was not measured.
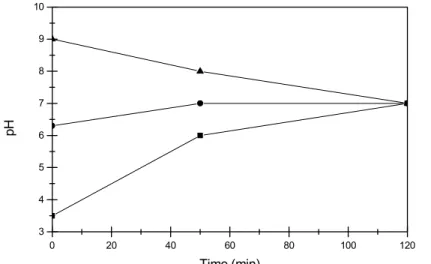
Another quite interesting finding is depicted in Figure 2. Regardless of the initial pH, the final effluent tends to neutrality, which is extremely desirable due to the discharge limits. The reason for this behavior is not clear, as pH tends to decrease during oxidation reactions due the formation of acids
Table 2: Best results achieved (in terms of photocatalyst concentration and initial pH) for total phenol degradation for a 60 min irradiation time.
Photocatalyst Supplier CPhotocatalyst
(g L-1) pH
Total Phenol Residual (%)
Degradation Enhancement*
TiO2 Aldrich 5.0 5.5 35.2 1
ZnO Aldrich 5.0 3.5 16.7 2
TiO2 P25 Degussa 3.0 6.3 6.98 5
*The parameter Degradation Enhancement is compared to the efficiency obtained using the TiO2 supplied by Aldrich as the photocatalyst.
0 20 40 60 80 100 120
3 4 5 6 7 8 9 10
pH
Time (min)
Figure 2: Evolution of pH during photocatalysis (TiO2 P25 at 3.0 g L -1
) at different initial pHs (S 9.0, z 6.3, and 3.5).
Experimental Design
From the ten repetitions of the central point, the overall experimental errors (experiments + analyses) for the UV area and phenol content were estimated at approximately 0.8 and 0.23 mg L-1, respectively. Those errors were quite a bit smaller than the values measured.
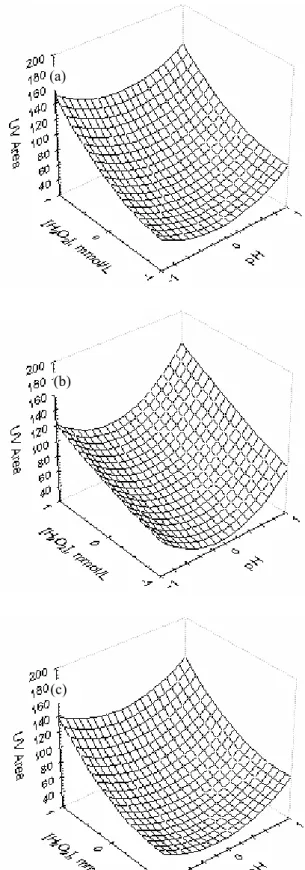
The response surfaces obtained are shown in
Figure 3: Response surfaces for UV area and phenol concentration. TiO2 (P25 Degussa)
concentration: (a) 0.5 g L–1, (b) 3.0 g L–1, and (c) 5.5 g L–1.
(a)
(b)
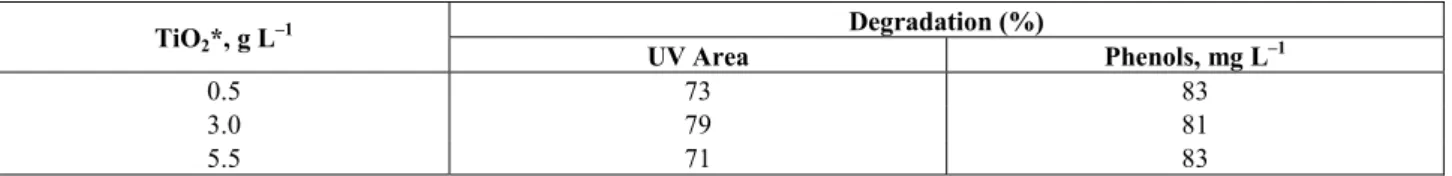
Table 3: Degradation (%) at the response surface minima.
Degradation (%) TiO2*, g L–1
UV Area Phenols, mg L–1
0.5 73 83
3.0 79 81
5.5 71 83
* P25 Degussa.
Regarding the UV area, it can be seen that the use of 3.0 g L–1 of TiO2 resulted in a somewhat better
degradation and that a pH close to 7 was the best one.
Regarding phenol content, the TiO2 concentration
did not significantly affect the degradation process. On the other hand, the use of a basic medium provided the best results.
Therefore, the following experiments were performed using 3.0 g L–1 of TiO2 and pH 6.3.
Although this is not the best pH for phenol removal, it was estimated that degradation would decrease by only 10% with the neutral pH. It is noteworthy that the best experimental conditions obtained by the experimental design confirmed the ones found during the screening experiments.
Experiments Under the Optimized Conditions
As can be seen in Table 1, the COD/DOC ratio was approximately 10. In fact, this wastewater has a high content of sulfide, polisulfide, sulfonate, and chloride ions, ammonia, etc. Those species are readily oxidized in the COD test. Therefore, the
DOC parameter was chosen in order to observe degradation of the organic matter.
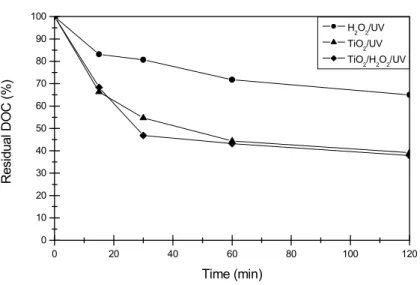
The results obtained for phenol degradation and degradation of organic matter are shown in Figure 4.
This wastewater showed insignificant changes when irradiated with UV light (photolysis).
The use of TiO2/UV (photocatalysis) resulted in a
significant increase in phenol removal (93%, one hour). The DOC curve did not show the previous behavior. In fact, 56% of the DOC was removed in the first hour. This is probably due to the fact that photocatalysis is a much more oxidative process than H2O2/UV, so the reactions that take place are much
faster.
Moreover, the increase in degradation obtained by the use of H2O2 coupled with photocatalysis was
marginal. Therefore, its use is not recommended for this kind of wastewater, as no significant enhancement of removal is obtained for photocatalysis and costs are increased.
Another important finding is that there is no need to treat the wastewater for a period of time longer than one hour, as the results achieved change little after this time.
0 20 40 60 80 100 120
0 10 20 30 40 50 60 70 80 90 100
H
2O2/UV
TiO
2/UV
TiO
2/H2O2/UV
Resi
du
al
Tot
a
l Phe
nol
s (
%
)
0 20 40 60 80 100 120 0
10 20 30 40 50 60 70 80 90 100
H
2O2/UV
TiO
2/UV
TiO
2/H2O2/UV
Resi
dual
D
O
C (
%
)
Time (min)
Figure 4: Results for different oxidation processes under the optimized conditions.
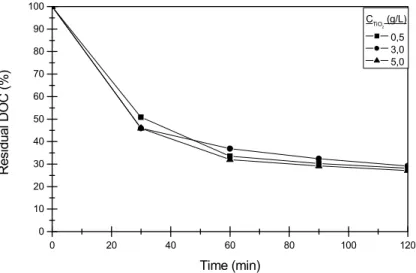
Experiments With the Pyrex® Annular Reactor
This set of experiments was intended to assess the performance of photocatalysis, using only the near-UV and visible wavelengths of the lamp, which is compatible with solar applications. As the shape changed, three different concentrations of photocatalyst were tested (0.5, 3.0, and 5.5 g L–1). As can be seen in Figure 5, the amount of TiO2 had no
significant effect on the process.
When the two sets of experiments are compared, it can observed that performance of the Pyrex® annular reactor is better than that of the open one, as depicted in Figure 6. The removal of phenols was quite the same, but the DOC removal obtained was 63%. This is probably due to a better use of the photons (as the lamp is inside the reactor) and a
larger fraction of photocatalyst being illuminated. Therefore, it seems that the use of helio-photocatalysis with this wastewater would be feasible.
Final Wastewater Characterization
After photocatalytical treatment of the wastewater in the Pyrex® annular reactor, under the optimized conditions, its general quality was significantly improved. The results are summarized in Table 4. It is noteworthy that phenol and oil and grease contents, which had been above the legislated limits, were reduced to discharge levels. Also, more than half of the DOC was removed from the wastewater. Finally, an insignificant amount of ammonia was removed (not more than 10%).
0 20 40 60 80 100 120
0 10 20 30 40 50 60 70 80 90 100
C
TiO2 (g/L)
0,5 3,0 5,0
R
e
si
dua
l Tot
a
l
Pheno
ls
(
%
)
0 20 40 60 80 100 120 0
10 20 30 40 50 60 70 80 90 100
CTiO2 (g/L) 0,5 3,0 5,0
Res
idual
DO
C
(
%
)
Time (min)
Figure 5: Pyrex® reactor: the effect of TiO2 concentration on the degradation process.
0 20 40 60 80 100 120
0 10 20 30 40 50 60 70 80 90 100
Open Reactor Pyrex® Annular Reactor
R
e
si
dual
Tot
a
l P
henol
s
(
%
)
Time (min)
0 20 40 60 80 100 120
0 10 20 30 40 50 60 70 80 90 100
Open Reactor Pyrex® Annular Reactor
Re
s
idua
l DO
C
(
%
)
Time (min)
Table 4: Wastewater characterization after the photocatalytic treatment under optimal conditions.
Parameter Before
Photocatalysis
After Photocatalysis
pH 6.7 7
DOC* 20 7
Oil and Grease* 23 < 10
Ammonia* 70 63
Total Phenols* 3.7 0.2
* In mg L–1.
CONCLUSIONS
The order of photocatalytic activity for the three solids tested was TiO2 (Aldrich) < ZnO (Aldrich) <
TiO2 (P25, Degussa). Severe losses to the solution
were observed with the use of ZnO.
The use of hydrogen peroxide to enhance the oxidative process was beneficial for photolysis but had no significant effect for photocatalysis.
The optimized pH (6.3) is quite interesting for process operation, since it is very close to the final pH required for effluent discharge.
High rates of removal were achieved for phenols, oil and grease, and dissolved organic carbon. Therefore, photocatalysis (TiO2/UV) can be applied
successfully to petroleum refinery wastewaters, attaining the quality standards required for final disposal.
ACKNOWLEDGMENTS
The authors wish to thank FAPERJ, FUJB, CNPq, and PADCT for their financial support and logistics, as well as Degussa for supplying the catalyst.
REFERENCES
APHA-AWWA-WEF, Standard methods for the
examination of water and wastewater, 18th Ed., section 5220D, 1992a.
APHA-AWWA-WEF, Standard methods for the
examination of water and wastewater, 18th Ed., section 5550B, 1992b.
APHA-AWWA-WEF, Standard methods for the
examination of water and wastewater, 18th Ed., section 5520C, 1992c.
Bekbolet, M., Balcioglu, I., Photocatalytic degradation kinetics of humic acid in aqueous
TiO2 dispersions: the influence of hydrogen
peroxide and bicarbonate ion, Water Sci. Technol., 34, 73–80, 1996.
Bessa, E., Sant’Anna Jr., G.L., Dezotti, M., Photocatalysis: An approach to the treatment of oil field produced waters, J. Adv. Oxid. Technol., 4, 196–202, 1999.
Bessa, E., Sant’Anna Jr., G.L., Dezotti, M., Photocatalytic/H2O2 treatment of oil field
produced waters, Appl. Catal. B: Environ., 29, 125–134, 2001.
Box, G.E.P., The exploration and exploitation of response surfaces: Some considerations and examples, Biometrics, 10, 16–60, 1954.
Dionysiou, D.D., Suidam, M.T., Baudin, I., Laîné, J.-M., Effect of hydrogen peroxide on the destruction of organic contaminants — Synergism and inhibition in a continuous-mode photocatalytic reactor, Appl. Catal. B: Environ., 50, 259–269, 2004.
Herrmann, J.M., Guillard, C., Pichat, P., Heterogeneous photocatalysis: An emerging technology for water treatment, Catal. Today, 17, 7–20, 1993.
Hoffmann, M.R., Martin, S.T., Choi, W., Bahnemann, D.W., Environmental applications of semiconductor photocatalysis, Chem. Rev., 95, 69–96, 1995.
Kormann, C., Bahnemann, D.W., Hoffmann, M.R., Photolysis of chloroform and other organic molecules in aqueous TiO2 suspensions, Environ.
Sci. Technol., 25, 494–500, 1991.
Legrini, O., Oliveros, E., Braun, A.M., Photochemical processes for water treatment, Chem. Rev., 93, 671–698, 1993.
Linsebigler, A.L., Lu, G., Yates Jr., J.T., Photocatalysis on TiO2 surfaces — Principles,
mechanisms, and selected results, Chem. Rev., 95, 735–758, 1995.
umidade e lâmpada a vapor de mercúrio de alta pressão, Química Nova, 16, 1978.
Rajeshwar, K., Photoelectrochemistry and environment, J. Appl. Electrochem., 25, 1067– 1082, 1995.
Schiavello, M., Some working principles of heterogeneous photocatalysis by semiconductors, Electrochimica Acta., 38, 11–14, 1993.
Stepnowski, P., Siedlecka, E.M., Behrend, P., Jastorff, B., Enhanced photo-degradation of
contaminants in petroleum refinery wastewater, Wat. Res., 36, 2167–2172, 2002.
Tanaka, S., Saha, U.K., Effects of pH on photocatalysis of 2,4,6-trichlorophenol in aqueous TiO2 suspensions, Wat. Sci. Technol., 30, 47–57,
1994.