*e-mail: [email protected]
Ceramic Foams Porous Microstructure Characterization
By X-ray Microtomography
Carlos Roberto Appolonia*, Celso Peres Fernandesb, Murilo Daniel de Mello Innocentinic, Álvaro Macedod
a
Departamento de Física, Universidade Estadual de Londrina C.P. 6001, 86051-990 Londrina - PR, Brazil
b
LMPT, Departamento de Engenharia Mecânica, Universidade Federal de Santa Catarina C.P. 476, 88040-900 Florianópolis - SC, Brazil
c
Grupo de Engenharia de Microestrutura de Materiais (GEMM), Departamento de Engenharia de Materiais, Universidade Federal de São Carlos - SP, Brazil
d
Embrapa Instrumentação Agropecuária C.P. 741, 13560-970 São Carlos - SP, Brazil
Received: January 23, 2004; Revised: June 29, 2004
Knowledge of the porous structure of amorphous materials is of fundamental importance in calculating geometrical parameters such as total porosity, pore size distribution and physical pa-rameters relating to fluid flow inside void space. The present work deals with the measurement of the microstructural parameters of porous ceramic filters. Microtomographic measurements of sam-ples were taken using an X-ray tube. Bremsstrahlung radiation was filtered in transmission mode with a Sn filter at 58.5 and 28.3 keV and the images analyzed in two ways. The first method consisted in analyzing transepts of the images in order to calculate total porosity based on the average particle size and media linear attenuation coefficients. The second method involved a study of the images using an image analysis software, called Imago, which allows one to calculate total porosity and pore size distribution. The total measured porosity of the filter C90 was 73.8%, 71.1%, 74.4% and 71.5% by, respectively, the Arquimedes method, simple gamma ray transmis-sion, transept analysis and analysis of the microtomographic images at 28.3 keV.
Keywords: microstructure, ceramic foams, microtomography, X-ray
1. Introduction
Millimetric scale X and gamma ray computerized tom-ography (CT) has been used in many fields of application since its development for medical diagnoses in 1973. More recently, the need to look inside porous media at the level of pores and aggregates in order to observe the topology and geometry of the pores, as well as other applications, led to the development of micrometric scale tomography. This implied a specific study of radiation sources, detectors, col-limators, mechanics, hardware and software to design dedi-cated systems for different fields such as archaeometry, soil physics, porous materials and other applications1,2.
Knowledge of the porous structure of amorphous mate-rials is required to calculate microstructural parameters, such as pore size distribution and total porosity, and important
for deriving the physical parameters of fluid flow in the sample, such as permeability. In this sense, the first possi-bility is to use 2D images to extract statistical descriptors of the pore space morphology, such as porosity and autocorrelation functions. These descriptors may be used directly to search for empirical correlations with the trans-port properties3. Alternatively, the statistical properties ob-tained from a cross-section may be used to constrain the generation of a 3D pore space4-6. Direct simulation of 3D flow in the reconstructed pore space may be performed us-ing Navier-Stokes equations7 or lattice gas/lattice Boltzmann simulations8.
meas-urements of the samples and analyze the images to extract the information of interest. The importance of the method-ology employed in this work, which is based on image analy-ses of microtomographic measurements, is that it allows one to measure several morphological and topological descriptors of the microstructure that are difficult to obtain or not accessible by conventional techniques.
The purpose of this work was to obtain the microstruc-tural parameters of ceramic foams using X-ray microtomography and image analysis.
2. Materials and Methods
The equipment used was a first generation X-ray tomo-graph with micrometric resolution9. The X-ray tube com-prised a W anode and 3 kW tube operated at 70 kV/10 mA and at 50 kV/23 mA for two different energy conditions. A transmission energy filter of Sn was employed to obtain almost monochromatic lines1,10 of 58.5 and 28.3 keV. Colli-mators of 60 µm and 215 µm were used at the NaI (Tl) detector entrance and the tube output, respectively. The beam width at the sample position was about 80 µm. The linear step of the projection measurements varied from 53.3 to 57.8 µm and the angular step was 0.8°. The number of pro-jections was 225 and the scanning time for each projection was 5 s. Figure 1 shows a block diagram of the CT scanner. The data matrix was processed by the “Microvis” re-construction software developed at the Instrumentation Center of the Brazilian Enterprise for Agricultural Research Corporation (EMBRAPA). The Microvis software recon-structs the image by applying the filtered backprojection
algorithm, in which the projections are initially transferred to the frequency domain and then bandlimited through the application of a filter. These filtered projections are brought back to the space domain and summed up to give the distri-bution of the linear attenuation coefficient values, in other words, to compose the image of the sample section9,11.
The microtomographies obtained were processed using the “Imago” image analysis software to determine total po-rosity, the autocorrelation function and pore size distribu-tion. Imago was developed at the Laboratory of Porous Media and Thermophysical Properties (LMPT), Department of Mechanical Engineering, Federal University of Santa Catarina in association with Engineering Simulation and Scientific Software (ESSS).
The original gray-level microtomographies were proc-essed with the “Imago” software to produce binary images after segmentation of the pore and solid phases. This proce-dure is based on the gray-level histogram, where the user selects the threshold that appears to best separate the gray-level classes associated with solid and porous phases.
The porous media represented in a 2-D binary image can be characterized by the pore phase function Z (x) as follows:
(1)
where x denotes the position with respect to an arbitrary origin.
The porosity, φ, the autocorrelation function, C (u), and the normalized autocorrelation function, R (u), can be de-fined, respectively, by the following statistical averages
noted by ):
(2)
(3)
(4)
where u is the displacement in the plane of the image.
Porosity, φ, is obviously a positive quantity limited to the [0-1] interval. When the media is homogeneous, the sta-tistical parameters are independent of position x in space. Thus, the porosity is constant and R (u) depends only upon the vector u being independent of position x.
Moreover, when the porous media is isotropic, Rz is a function only of u = |u| and does not depend on the direction of u.
The correlation function can be calculated directly in the image domain12. Let S be a section of a porous medium, given by a 2D binary representation, with the porous phase repre-sented in black and the solid matrix in white. The binary im-age, S, is divided into two halves, S1 and S2. Hence,
S = S1 ∪ S2, S1 ∩ S2 = ∅ (5)
In order to calculate Rz(u), S1 is first translated by a dis-tance u along the x-axis; yielding S1(+ u). The spatial aver-age indicated in Eq. 3 is calculated as an intersection of im-ages, giving the correlation function.
= S1(+ u) ∩ S (6)
C(u) relates to the probability of finding two points (pixels) separated by u and belonging to the same phase.
Liang et al.5 calculated the autocorrelation function C (u) as a function of the two-dimensional vector u = (x,y) and then calculated its mean value around a circle with radius u = |u|. This procedure produces more reliable C (u) values because it increases the number of realizationsneeded to cal-culate this probability.
For an image f (x,y), the Fourier transform of the autocorrelation function is the power spectrum of f (x,y) (Wiener-Khinchin theorem). Thus, with the Fourier transform of the image, the correlation function can be obtained rap-idly performing the inverse Fourier transform of the power spectrum. The 2D autocorrelation function is calculated by Imago using the Fourier transform. Fluctuations in the autocorrelation function are drastically reduced when C (u) is calculated by Fourier transform, compared with above de-scribed spatial method.
The pore size distribution is obtained by successive open-ings derived from mathematical morphology13, using balls
with increasing radius. After an opening operation with a given ball radius r, the resulting image can be viewed as the union of radius-r balls completely enclosed in the porous phase. In this way, after opening, the porous phase loses all the fea-tures that can be eroded by a given radius-r opening ball. The cumulative porous distribution is given by:
(7)
where f is the total porosity of the original image and φ (r) is the volume fraction of the porous phase after opening with a radius-r ball.
To reduce the processing time, the opening operation is not applied directly to the binary image but to a transformed image called background distance image. In this image, each pixel is labeled with its smallest distance to the neighboring background. This labeling technique uses a sequential algo-rithm14, in which the Euclidean distance is approximated by a discrete integer distance. The most commonly used dis-crete distance is the chamfer distance, known as d3-4, in which each neighbor from a given point, which is taken following the horizontal and vertical coordinate axis, is considered to be 3 measuring units distant from the starting point. The di-agonal neighbors are considered to be at 4 measuring units from that point. Thus, this discrete distance gives the numeri-cal approximation of 4/3 = 1.333...to the square root of 2 (1.4142...). The main advantage of using this discrete dis-tance is that it requires lower computer storage space, since only integers are stored in the resident memory.
The total porosity was also determined by other methods. Through various transept analyses of each microtomography, the total porosity was calculated by means of the linear attenuation coefficients at particle den-sity and average medium, as follows:
(8)
where µm is the average medium linear attenuation coefficient of the transept considered in the tomography and µp is the average particle linear attenuation coefficient of the transept.
For purposes of comparison, results from conventional methodologies such as Arquimedes, Hg and gas porosimetry were also employed, as well as the single gamma ray transmission technique.
samples were performed at 28.3 keV. Figure 2 illustrates the three types of samples.
3. Results
Figures 3 to 5 show CT images obtained at 28.3 kev for the 60 ppi (9 × 11 mm2), 75 ppi (9 × 11mm2) and 90 ppi ceramic foam samples (5 × 9 mm2), respectively. De-tails of the structure, from pores (black areas) to compact particle aggregates (white areas), are clearly visible.
Table 1 lists the porosity results. Each of the three im-ages was divided into two parts and the porosity was de-termined for both the parts and the entire image. The re-sults show that the 60 ppi image is homogeneous, while the 75 ppi image is somewhat heterogeneous and the 90 ppi image presents important heterogeneities. These heterogeneities can be associated to the scale of the image analysis: possibly, the field of the analyzed image is small compared with the pore size. Therefore, for a more accu-rate calculation of porosity and other geometrical param-eters, larger images may be required (retaining the same spatial resolution) in order to reach the scale of homoge-neity of the microstructure, if it really exists. Despite their heterogeneities, the 75 and 90 ppi images were used in
Figure 2. Ceramic foam samples of 60 ppi, 75 ppi and 90 ppi (from left to right).
Figure 3. CT image of 60 ppi ceramic sample (9 × 11mm2)
meas-ured at 28.3 keV.
Figure 4. CT image of 75 ppi ceramic sample (9 × 11mm2)
meas-ured at 28.3 keV.
Figure 5. CT image of 90 ppi ceramic sample (5 × 9 mm2)
meas-ured at 28.3 keV.
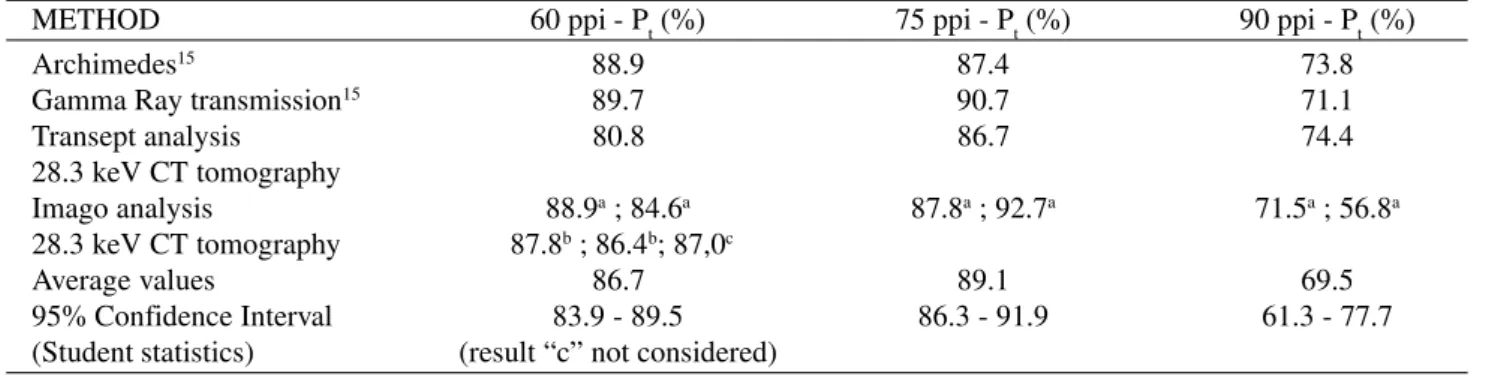
Table 1. Total Porosity (Pt) of the ceramic foam samples.
METHOD 60 ppi - Pt (%) 75 ppi - Pt (%) 90 ppi - Pt (%)
Archimedes15 88.9 87.4 73.8
Gamma Ray transmission15 89.7 90.7 71.1
Transept analysis 80.8 86.7 74.4
28.3 keV CT tomography
Imago analysis 88.9a ; 84.6a 87.8a ; 92.7a 71.5a ; 56.8a
28.3 keV CT tomography 87.8b ; 86.4b; 87,0c
Average values 86.7 89.1 69.5
95% Confidence Interval 83.9 - 89.5 86.3 - 91.9 61.3 - 77.7
(Student statistics) (result “c” not considered)
a) two longitudinal halves; b) two transversal halves; c) whole image.
ods only allow the sample’s average pore radius to be de-termined. The pore frequency distribution provides a much better characterization of the quality and properties of the ceramic foam. 75.5% of the pores of the 60 ppi ceramic foam had radii ranging from 0.26 to 0.64 mm, but 42% of the pores had radii of 0.38 to 0.45 mm. The 75 ppi ce-ramic foam displayed no clearly centered pore radius dis-tribution, since 94% of its pores had radii ranging from 0.26 to 0.70 mm. 76% of the pores of the 90 ppi ceramic foam presented radii ranging from 0.22 to 0.50 mm. The two halves of the 75 and 90 ppi samples showed total po-rosity differing by 6% and 26%, respectively.
Figures 9 to 11 show selected transepts of the samples’ CT images.
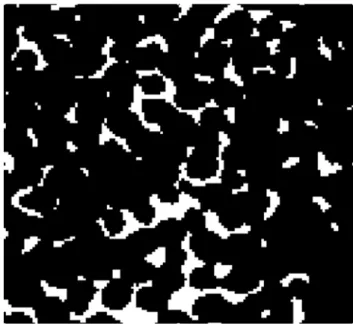
Figures 12 to 14 depict the binary images of the sam-ples generated by the Imago software and used for the cal-culations of porosity and autocorrelation.
Table 2 shows the comparison of present results for ceramic foams samples with data from the literature, which are discussed in an extensive review paper16 of the area. This review paper, among other data analysis, reports
re-Figure 6. 60 ppi ceramic foam pore size distribution.
Figure 7. 75 ppi ceramic foam pore size distribution.
Figure 8. 90 ppi ceramic foam pore size distribution.
the 95% confidence level interval.
meth-sults of twelve different works, published between 1998 and 1985, dealing with ceramic foams produced by the replica-tion technique, concerning the relareplica-tionship between pore count, porosity and pore size.
There is very good agreement for total porosity results for the three types of ceramic filters.
Average pore size is also shown at Table 2. But, due to the complexity of the porous space geometry, this param-eter is strongly model dependent and hardly could be com-pared.
Figure 15 shows a comparison of the normalized autocorrelation for the 60, 75 and 90 ppi ceramic foams. As can be seen, the correlation-curves resemble each other closely, denoting a similar spatial arrangement.
Correlation-length, as defined by Lanteajoul, C.17: , was es-timated as 0.30 mm for the three samples.
Figure 12. Binary image pattern of the 60 ppi sample.
Figure 13. Binary image pattern of the 75 ppi sample. Figure 9. Selected transept of the 60 ppi ceramic sample’s CT
im-age.
Figure 10. Selected transept of the 75 ppi ceramic sample’s CT image.
4. Conclusions
This paper shows the potential of X-ray microtomography and image analysis for microstructural characterization.
The Imago software analysis of the ceramic filters pro-duced good results, allowing for the measurement of total porosity as well as detailed pore size distribution, extending the description of this porous media beyond the concept of average pore diameter. The very simple method of microtomography transept analysis also provided good re-sults for the total porosity of the three samples studied. Con-sidering all the methodologies presented at Table 1, the total porosity (%) of the 60, 75 and 90 ppi ceramic foams were (86.7 + 2.8)%, (89.1 + 2.8)% and (69.5 + 8.2)%, respec-tively, for 95% confidence level. A comparison of the 60 ppi, 75 ppi and 90 ppi ceramic foam samples’ normalized autocorrelation showed that they were very close, indicating a similar spatial arrangement with a correlation-length of about 0.30 mm.
Acknowledgments
The authors would like to thank the Brazilian Ministry of
Figure 15. Comparison of the 60, 75 and 90 ppi ceramic foams’ normalized autocorrelation.
Figure 14. Binary image pattern of the 90 ppi sample.
Table 2. Pore size and porosity of the ceramic foam filters.
pores per inch average pore diameter(a) average pore diameter porosity (%) porosity (%)16
(ppi) (mm) present work (mm)16 present work
60 0.92 1.00 80.8b 89.4 ; 87.3
0.50 87.0a 77.1 ; 75.9
0.24 74.4 ; 73.2
75 0.92 0.42 86.7b 84.4 ; 77.6 ; 75.0
0.16 87.8a ; 92.7a 73.3 ; 72.6 ; 71.5
90 0.70 0.34 74.4b 87.9 ; 73.2 ; 71.5
0.56 71.5a ; 56.8a 70.6 ; 68.5
a) Imago analysis 28.3 keV tomography; b) Transept analysis 28.3 keV tomography.
Science and Technology (MCT) for its financial support of the PADCT project and the Brazilian Ministry of Education (MEC) for its financial support of the PROCAD/CAPES project.
References
1. Appoloni C.R.; Cesareo R.; Microscanning and microtomography with X-ray tubes, RAP. 04.94, CISB, Università Degli Studi di Roma “La Spienza”, p. 84, 1994. 2. Macedo A; Vaz C.M.P.; Naime J.M.; Cruvinel P.E., Crestana S. Powder Technology, v. 101, p. 178 - 182, 1999. 3. Ioannidis, M.A.; Kwiecien, M.J; Chatzis, I. J. Petr. Sci.
Eng., v. 16,p. 251-261, 1996.
4. Quiblier, J.A. J. Colloid Interface Sci., v. 98, p. 84-102, 1984.
5. Liang, Z.R.; Fernandes, C.P.; Magnani, F.S.; Philippi, P.C. Journal of Petroleum Science and Engineering, v. 21, p. 273-283, 1998.
v. 17, p. 221-238, 1994.
8. Santos, L.O.E.; Philippi, P.C.; Damiani, M.C.; Fernandes, C.P. Journal of Petroleum Science and Engineering, v. 35, p. 109-104, 2002.
9. Macedo, A.; Cruvinel, P.E.; Inamasu, R.Y.; Jorge, L.A.C.; Naime, J.M.; Torre-Neto, A.; Vaz, C.M.P.; Crestana, S. Ad-vances in intelligent systems and computer science, World Scientific and Engineering Society, p. 223-228, 1999. 10. Appoloni, C.R.; Cesareo, R. Advances in Agricultural
Tomography, EMBRAPA Agricultural Instrumentation, São Carlos - SP, Brazil, p. 31 - 35, 2000.
11. Macedo, A. Construção e uso de um tomógrafo com resolução micrométrica para aplicações em Ciências do Solo e do Ambiente, Doctoral thesis, Universidade de São Paulo, Escola de Engenharia de São Carlos,
Centro de Recursos Hídricos e Ecologia Aplicada, São Carlos - SP, Brazil, p. 129, 1997.
12. Adler, P.M.; Jacquin, C.G.; Quiblier, J.A. Int. J. Multiphase Flow, v. 16, p. 691-712, 1990.
13. Coster, M.; Chermant, J.L.; Precis D’analyse D’images. Presses du CNRS, Paris, 1989.
14. Chassery, J.M.; Montanvert, A. Géometrie Discrète en Analyse d’Images, Editions Hermes, Paris, 1991. 15. Pöttker, W.E.; Appoloni C.R.; Radiation Physics and
Chemistry, v. 61, p. 535-536, 2001.
16. Innocentini, M.D.M.; Salvini, V.R.; Coury, J.R.; Pandolfelli, V.C. Bulletin of the American Ceramic So-ciety, v. 78, n. 9, p. 78-84, 1999.