*e-mail: [email protected]
Trabalho apresentado no I Simpósio Mineiro de Ciências dos Materiais, Ouro Preto, Novembro de 2001.
Electrical Characterization by Impedance
Spectroscopy of Zn
7Sb
2O
12Ceramic
Marcos A. de Lima Nobre, Silvania Lanfredi*
Instituto de Física de São Carlos – Universidade de São Paulo, C.P. 369, 13560-970, São Carlos - SP, Brazil
Received: November 11, 2001; Revised: March 2, 2003
Impedance spectroscopy technique was used to investigate the electric properties of Zn7Sb2O12, an electroceramic with inverse spinel type structure. The electric characterization of the Zn7Sb2O12
semiconducting ceramic was performed at temperature from 250 to 550 °C, in the frequency range from 5 Hz to 13 MHz. Zinc antimoniate phase was synthesized by the polymeric precursors method. The bulk resistance curve as a function of temperature exhibits a thermistor behavior with negative temperature coefficient. The bulk conductivity follows the Arrhenius law with two linear branches of different slopes positioned at around a region of transition, 450 °C ≥ T ≥ 350 °C. The activation energy values at low temperature (≤ 350 °C) and high temperature (≥ 450 °C) are equals to 0.78 and 0.61 eV, respectively. The existence of a phase transition limiting these regions is discussed.
Keywords:varistor, spinel, semiconductor, impedance spectroscopy
thesized by a chemical route based on the modified poly-meric precursors method.
2. Experimental Procedure
The starting reagents for spinel preparing were citric acid (99.5% Reagen), ethylene glycol (98.0% Synth), zinc acetate (99.0% Reagen), and antimony oxide (99.0% Riedel). Zn7Sb2O12 powders were prepared by calcination of the precursor at 900 °C for one hour. Further details of synthesis procedure are described elsewhere3. Ceramic with
97% of theoretical density (6.00 g/cm3) was sintered by
constant heating rate process in a dilatometer up to 1250 °C at 10 °C/min, in air atmosphere.
The electrical properties were investigated by imped-ance spectroscopy. Measurements were performed on 8 mm × 2 mm cylindrical samples. Platinum electrodes were deposited on the parallel faces and mirror like polished of the sample by a platinum paste coating (Demetron 308 A), which was dried at 800 °C for 30 min. The measurements were carried out with an applied potential of 500 mV in the frequency range from 5 Hz to 13 MHz. A Solartron 1260 Impedance Analyzer controlled by a personal computer was used. The samples were placed in a sample holder with a
1. Introduction
Oxides with general formula AB2O4 exhibiting
struc-ture similar to MgAl2O4 mineral1 are classified as spinel
type oxides. These materials exhibit interesting properties giving potential application in a wide range of ceramic ar-eas such as: catalyst, pigment magnetic and gas sensor. Fur-thermore, some spinels show interesting applications based on the semiconducting properties. As recent development, we can mention the non linear behavior at tension vs. cur-rent characteristic that has been engineered on Zn7Sb2O12 ceramic2. This property is typical of ceramic varistor, which
is a classic technological application of an effect based on the grain boundary phenomenon. Recently, fundamental electric and dielectric properties differences between the bulk and grain boundary regions have been reported for Zn7Sb2O12 ceramic. This is further evidence for that grain boundary phenomenon is an intrinsic feature in this spinel,
whether ceramic powder is synthesized by chemical route3.
Another set of electroceramic spinel exhibits thermistors properties with negative temperature coefficient (NTC)4.
syn-two-electrode configuration. The measurements were taken from 250 to 550 °C with a 50 °C step, in atmospheric air. After each measurement, a interval of 30 min was used prior to the stabilization of the temperature and properties. No thermal hysteresis was detected during the measurements taken on the heating and cooling cycle. The data were pre-sented in the complex plane formalism being analyzed throughout Boukamp’s software EQUIVCRT. This program works in an environment developed for equivalent electric cir-cuits being based on the simulation of the immitance spectra5.
3. Results and Discussion
Figure 1 shows impedance diagrams of Zn7Sb2O12 ce-ramic, at several temperatures. All diagrams show a slight decentralization of the semicircle. This phenomenon is typi-cally related with the existence of a distribution of relaxa-tion time, when electroceramics are considered. This behavior is in according to a Cole-Cole type response6. The
diagrams shape indicates that the electric response is com-posed of, at least, two semicircles. However, in addition to semicircle decentralization, the semicircles exhibit a high overlapping degree.
The analysis of the electrical response can be
investi-gated via the electric modulus M*(ω) formalism.
Modulus is derived from impedance data by equation M*(ω) = jωCoZ*(ω), where j = −1 and Co is the vacuum capacitance of the cell. The modulus representation is
suit-able to detect some phenomena as electrode polarization7
and conductivity relaxation time8. The modulus
representa-tion might lead to a higher clear picture of polarizarepresenta-tion
phe-nomena than impedance one9. In this work, the formalisms
Z*(ω) and M*(ω), represented in the complex plane, do
not exhibit advantage on the identification of the semicir-cles number. Thus, these formalisms take into account both bulk and grain boundary contributions in a coupled way.
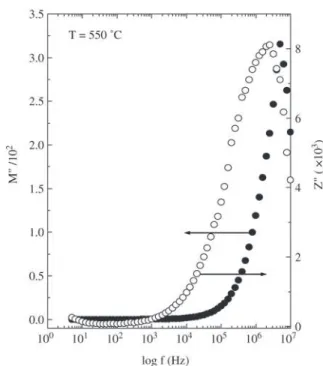
Figure 2 shows M”(ω) and Z”(ω) as a function of
loga-rithmic frequency at 550 °C. The M”(ω) exhibits only a
peak at high frequency and it tends to zero at low frequen-cies. This suggests that electrode polarization phenomenon is negligible or absent. In Z”(ω) against log f plot, an asym-metric peak is identified, which is shifted to a low frequency
with relation to M”(ω) peak position. The slight mismatch
of the peaks and asymmetry development give further evi-dence of existence of two polarization phenomena10. In the
same way, this is in accordance with previous comment,
where using Z*(ω) or M*(ω) representation does not lead
any advantage on the semicircles recognition.
Characteri-Figure 2. (M”) and (Z”) as a function of frequency logarithmic measured at 550 °C.
zation at another temperatures gives raise similar feature. In fact, these polarization are due the bulk and grain bound-ary contributions to electric response. A powerful tool to derive both bulk and grain boundary contributions is car-ried out the theoretical deconvolution of the electrical re-sponse. Boukamp’s formalism can be used. In this formal-ism, the non-ideal character of the polarization phenom-enon is represented by a parameter Q. This parameter can be interpreted as a non-ideal capacitance (C) being
physi-cally determined by the parameters Yo and exponent n
be-ing n≤ 1. When the exponent n tends to unity, the
param-eter Yo tends to C, an ideal capacitance. Thus, the non-ideal character of the parameter Q is only assigned to a distribu-tion of relaxadistribu-tion times. In the Boukamp’s formalism, the impedance of a circuit (RQ) serie is given by the following equation: n j RY R Z
o( )
1+ ω
= (1)
where R1 is the intercept of the curve at high frequency with real axis. The parameters R, Yo and n are extracted by theo-retical fitting of data. The C can be derived by the following equation: −
= n Yon
n R C 1 1 (2)
Thus, the relaxation time (τ) is extracted by the classi-cal equation τ = RC. It is interesting to note that despite a simple and concise physical interpretation of n exponent, it allows to extract capacitance and resistance.
The capacitance values derived are experimental mean-ingful. Recently, the bulk capacitance has been extracted from alternative approach at ceramics and single crystals11-15.
This method is based on the following equation:
-Im(Z*) = 1/jωC (3)
The advantage obtained using Eq. 3 is twofold. The first advantage is that no data fitting are necessary to determine the bulk capacitance. The second one is that C can be de-rived in trivial manner. Bulk capacitance dede-rived using Eq. 3 gives very similar values that one extracted via Eq. 2. In fact, considering typical error, at around ± 3%, both values are the same. These data are not shown here.
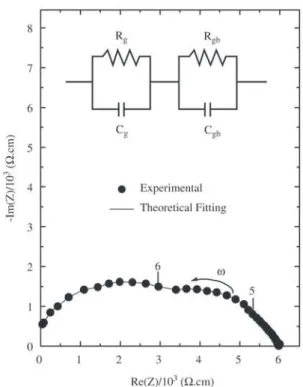
Figure 3 shows experimental and fitting curve of im-pedance data measured at 500 °C. The electrical behavior of Zn7Sb2O12 is well represented by two parallel RC equiva-lent circuits in series. The first semicircle, at low frequency, represents the grain boundary contribution. The second one positioned for high frequency domain corresponds to the grain or bulk properties.
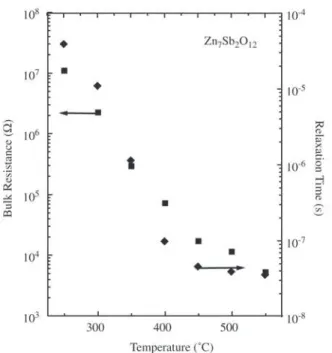
Figure 4 shows the bulk resistance and relaxation time as a function of temperature. The resistance decreases with increasing of temperature. τ exhibits long relaxation time, in the temperature range studied. These values suggest a conduction process of type hopping, similar to another
in-verse spinels4. The hopping mechanism requires that the
cations with distinct valences occupy octahedral holes4.
Zn7Sb2O12 has antimonium cations with oxidation state equal to 5 occupying octahedral sites. However, the presence of the Sb+3 has been reported2. This is not sufficient to attain a
conduction mechanism based on the hopping approach, since the hopping of the carrier should occur between cati-ons positioned at crystallographic equivalent lattice-sites with valence differing of one unit only. The existence of the Sb+4 has been hypothesized3. According to Fig. 4, there is a
region of anomaly in the resistance and relaxation time curves. As a whole, this electrical behavior is characteristic of negative temperature coefficient thermistor. This prop-erty has been observed at another thermistors ceramics be-ing further evidence that the conduction mechanism actuat-ing on the bulk is of the hoppactuat-ing type. Furthermore, in the region between 350 to 450 °C, the simultaneously anoma-lies observed in both curves suggest a phase transition phe-nomenon of the order-disorder type, which requires a broad
interval of temperature. Thus, based on the wide tempera-ture range we can speculate that another physico-chemical process is responsible for the phenomenon observed, such as an oxi-reduction of antimony cations. The phase transi-tion is a favorable phenomenon due the open character of the structure and great number of vacant sites.
Figure 5 shows the Arrhenius’ diagram of the bulk con-ductivity as a function of reciprocal temperature. The behavior observed is given by the following equation:
(
Ea kT)
oexp− /
=σ
σ (4)
where σ0represents a pre-exponential factor and Ea, k and T
are, respectively, the apparent activation energy for conduc-tion, Boltzmann’s constant and the absolute temperature.
The Arrhenius diagram (Fig. 5) shows two linear
re-gions with different slopes positioned at T ≥ 450 °C and
T ≤ 350 °C. The region between 350 °C ≤ T ≤ 450 °C is
further evidence of a phase transition, as mentioned above. Zn7Sb2O12 ceramic presents distinct values for Ea at low
tem-perature (≤ 350 °C) and high temperature (≥ 450 °C)
re-gions being equal to 0.78 and 0.61 eV, respectively. In the transition region, the Ea exhibits an unrealistic value of 1.40 eV.
The total conductivity has been studied as a function of temperature in the frequency range from 102 to 106 Hz.
Fig-ure 6 shows the frequency dependence of total conductivity at different temperatures. The frequency dependence of ac
Figure 4. Bulk resistance and relaxation time as a function of tem-perature.
conductivity, σac, follows a power relation σac∝ωs, at high
frequency. At low frequency domain, a plateau can be ob-served. As matter of fact, this behavior is further evidence of d.c. conductivity, which conductivity contribution to to-tal-conductivity is independent of the frequency. Thus, the total conductivity could be given by the following equa-tion:
σtot = σdc + Aω
s (5)
where σdc is d.c. conductivity due excitation of electron from localized states to the conduction bands and Aws is the a.c.
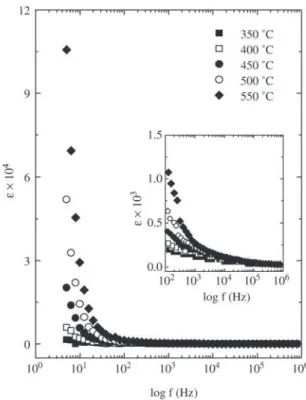
conductivity typically assigned to the hopping conduction being “A” a frequency independent constant and “s” a power with values 0.0 < s < 1.0. As a whole, the conductivity behavior is in accordance with conduction mechanism based on the hopping process. Furthermore, there is a large in-crease of conductivity level at region between 350 and 450 °C being further evidence of the phase transition, as discussed previously. Accordingly, the dielectric permittiv-ity undergoes gradual increase of values with increasing of the temperature of measurement for temperature phase-tran-sition range, at low frequency range (< 102 Hz). Figure 7
shows dielectric permittivity as a function of frequency at several temperatures. At temperature above 450 °C, the per-mittivity exhibits a significant increment of values.
Figure 7. Dielectric permittivity as a function of frequency at sev-eral temperatures.
Figure 6. Total conductivity as a function of frequency at different temperatures.
4. Conclusion
Zn7Sb2O12 ceramic exhibits electrical behavior with ther-mistor’s feature being the temperature coefficient of char-acteristic negative. The electric and dielectric properties of the bulk are correlated to actuating of a conduction mecha-nism of the hopping type expected to NTC material. Ac-cording to conductivity and dielectric permittivity proper-ties, in the temperature range from to 450 °C, the spinel undergoes a phase transition based on the order-disorder process, which is an eventual phenomenon at inverse spinels.
Acknowledgments
This work was supported by Brazilian research funding institutions FAPESP, CNPq and CAPES.
References
1. Sickafus, K.E.; Wills, J.M.; Grimes, N.W. J. Am. Ceram.
Soc., v. 82, p. 3279-3292, 1999.
2. Ezhilvalavam, S.; Kutty, T.R.N. J. Appl. Phys. Lett., v. 68, p. 2693-2695, 1996.
3. Nobre, M.A.L.; Lanfredi, S. Mater. Lett., v.50, p. 322-327, 2001.
4. Fagan, J.G.; Amarakoon, V.R.W. Am. Ceram. Soc. Bull.,
v. 72, p. 70-119, 1993.
5. Boukamp, B.A.; Equivalent Circuit – EQUIVCRT
Pro-gram-Users Manual (University of Twente-Holand) v3.
97, 1989.
6. Cole, K.S.; Cole, R.H. J. Chem. Phys. v. 9, p. 341-351, 1941.
7. Almond, D.P.; West, A.R. Solid State Ionics, v. 11,p. 57-64, 1983.
8. Réaux, J.M.; Xu, Y.J.; Senegas, J.; Le Deit, Ch.; Poulain, M. Solid State Ionics, v. 95, p. 191-197, 1997.
9. Sinclair, D.C.; West, A.R. J. Appl. Phys., v. 66, p. 3850-3856, 1989.
10. Gerhardt, R. J. Phys. Chem. Solids, v. 55,n. 12,p. 1491-1506, 1994.
11. Nobre, M.A.L.; Lanfredi, S. Mater. Lett., v. 47, p. 362-366, 2001.
12.Nobre, M.A.L.; Lanfredi, S. J. Phys. Chem. Solids, v.
62, p.1999-2006, 2001.
13.Lanfredi, S.; Carvalho, J.F.; Hernandes, A.C. Appl. Phys. Lett., v. 77, p. 4371-4373, 2000.
14. Lobato, A.R.; Lanfredi, S.; Carvalho, J.F.; Hernandes, A.C. Materials Research, v. 3, p.92-96, 2000.