_____________________________
*) Corresponding author: [email protected]
doi:
10.2298/SOS1001069P
UDK 553.689:622.785
Influence of Rare-Earth Additives (La, Sm and Dy) on the
Microstructure and Dielectric Properties of Doped BaTiO
3Ceramics
V.Paunovi
ć
*
), Lj.Živkovi
ć
, V. Miti
ć
Faculty of Electronic Engineering, University of Niš, Aleksandra Medvedeva 14,
18000 Niš, Serbia
Abstract:
A series of La/Mn, Sm/Mn and Dy/Mn codoped BaTiO3 samples were prepared by the
conventional solid state procedurewith dopant concentrations ranging from 0.1 up to 2.0
at%. The specimens were sintered at 1320°C and 1350°C in an air atmosphere for two hours.
The low doped samples demonstrated a mainly uniform and homogeneous microstructure
with average grain sizes ranging from 0.3 μm to 5.0 μm. The appearance of secondary
abnormal grains in the fine grain matrix and core-shell structure were observed in highly
doped La/BaTiO3 and Dy/BaTiO3 sintered at 1350°C. The low doped samples, sintered at
1350°C, display a high value of dielectric permittivity at room temperature, 6800 for
Sm/BaTiO3, 5900 for Dy/BaTiO3 and 3100 for La/BaTiO3. A nearly flat permittivity-response
was obtained in specimens with 2.0 at% additive content. Using a modified Curie-Weiss law
the Curie-like constant C⁄ and a critical exponent γ were calculated. The obtained values of γ
pointed out the diffuse phase transformation in heavily doped BaTiO3 samples.
Keywords: BaTiO3 doped ceramics, Sintering, Microstructures, Dielectric properties.
Introduction
Rare earth oxides are widely used as doping materials for BaTiO3 ceramics in order
to achieve a high dielectric performance and low dissipation factor of the capacitors [1-3].
The incorporation of trivalent rare-earth cations such as La3+, Dy3+, Sm3+, Er3+ and Ho3+ in the
perovskite lattice of BaTiO3, modifies the microstructural and electrical properties of doped
BaTiO3. The larger ionic size rare-earth ions (La, Sm) predominantly dissolve in A-sites, and
act as donors, and the intermediate ionic size rare-earth ions (Dy, Ho, Er), depending on their
concentration, dissolve in both A and B- cationic lattice sites in BaTiO3 structure, and may act
as donors or/and acceptors.
The substitution of rare-earth ions on Ba2+ sites requires the formation of negatively
charged defects. There are three possible compensation mechanisms: barium vacancies
(VBa″), titanium vacancies (VTi″″) and electrons (e′). For samples sintered in air atmosphere,
which are electrical insulators, the principal doping mechanism is the ionic compensation mechanism. The controversy remains concerning whether the dominant ionic mechanism is
For lower donor concentration of La, one of the most frequently used dopant/additive, up to 0.50 mol%, named the grain growth inhibition threshold (GGIT), a bimodal microstructure is formed and anomalous grain growth occurred which leads to
semiconductive properties of ceramics [6-10]. In heavily, single La-doped and donor-acceptor
La/Mn-codoped BaTiO3 ceramics, which are characterized by a small grained microstructure,
a high insulation resistance and life stability of multilayer capacitors can be achieved.
The dysprosium ion, (Dy3+) shows amphoteric behavior and can occupy both A and
B cationic sites in the BaTiO3 structure. Being incorporated at A sites Dy3+ ions act as donors,
and at B sites act as acceptors in BaTiO3 [11,12]. The degree of Dy3+ ions incorporation at A
and/or B sites depends on the A/B ratio. In TiO2 excess BaTiO3, Dy is incorporated at A sites,
whereas for Ba excess, Dy is on B sites. Depending on the A/B ratio Dy may form a second
phase, Ba12Dy4.67Ti8O35 for Ba excess and Dy2Ti2O7 for Ti excess [12]. The maximum
solubility of Dy on B sites is up to 9 mol%, whereas the solubility at A sites is lower up to 2.5 mol% [13].
The incorporation of samarium (Sm3+) ions in BaTiO3 is also strongly dependent on
the Ba/Ti ratio. During sintering in air, if the A/B ratio is smaller than 1 and the doping level
is under 0.5 mol%, Sm3+ ions occupy the Ba sites giving donor doped behavior, whereas if the
A/B ratio is largerthan 1, Sm3+ substitutes Ti and acts as an acceptor [14].
MnO and/or MnO2 are frequently added to BaTiO3 together with other additives in
order to reduce the dissipation factor. Manganese belongs to the valence unstable
acceptor-type dopant which may take different valence states, Mn2+, Mn3+ or even Mn4+ during the post
sintering annealing process. For codoped systems the formation of donor-acceptor complexes,
such as 2[LaBa•]-[MnTi//] that prevent a valence change of Mn2+ to Mn3+ [15], has a beneficial
effect on the reduction of the dissipation factor. In heavily codoped BaTiO3 ceramics, with
small grained microstructure, the resistivity is of the order of 1010Ωcm.
However, in addition to the various functions of additives, it could be pointed out that
the formation of a liquid phase and secondary phases above the eutectic temperature (1332oC)
as well as the Ba/Ti atomic ratio, may also influence the microstructural evolution and ferroelectric properties [16,17].
The purpose of this paper is a comparative investigation of the microstructure and
ferroelectric properties of La/Mn, Dy/Mn and Sm/Mn doped BaTiO3 as a function of different
amounts of dopant concentration and sintering temperature. The Curie-Weiss and modified Curie-Weiss laws were used to clarify the influence of dopants on the dielectric properties of BaTiO3.
Experimental
La/Mn, Sm/Mn and Dy/Mn codoped BaTiO3 samples were prepared by a
conventional solid state reaction. Reagent grade powders BaTiO3, Rhone Poulenc
(Ba/Ti=0.996±0.004, average particle size of 0.10−0.5μm), and La2O3, Sm2O3, Dy2O3 and
MnO2 (Merck, Darmstadt) were used as starting materials. The content of additive oxides
ranged from 0.1 to 2.0 at%. The content at 0.05 at% MnO2 was kept constant in all samples.
Raw materials were homogenized in ethanol medium with alumina balls for 24 h and, after drying for several hours, were pressed at 120 MPa into disks 10 mm in diameter and 2 mm
thick. The samples were sintered at 1320° and 1350oC for two hours with a heating rate of
300oC/h in air atmosphere. The bulk density was measured by the Archimedes method. The
analyses were carried out by Rigaku-Miniflex diffractometer. Capacitance was measured using HP 4276 LCZ meter and the variation of dielectric constant with temperature was
measured in a temperature interval from 20 to 180oC.
Results and discussion
Microstructure characteristics
The relative density of doped samples ranged from 70-80 % of theoretical density (TD) for La/BT, 90 %TD for Dy/BT and up to 93%TD for Sm-doped ceramics, being lower for higher dopant additive and low sintering temperature. The homogeneous and completely
fine-grained microstructure with grain size ranged from 1.0-3.0 μm, of fairly narrow size
distribution, are the main characteristics of La-doped samples, sintered at 1320°C (Fig.1a and
1b). With the increase of dopant amount the increase of porosity is evident. At 1350oCthe
microstructure for specimens with 0.1 and 0.5 at% La is similar to that ones obtained for lower sintering temperature, as illustrated in Fig.1c and 1d.
a) b) c) d)
Fig. 1 SEM images of La-doped BaTiO3, a) 0.1 and b) 0.5 La/BT sintered at 1320oC and c)
0.1 and d) 0.5 La/BT sintered at 1350oC.
However, in 2.0 La/BT samples sintered at 1350°C, at temperature which is above
eutectic point (1332°C), apart from the fine grained matrix, some local area with secondary
abnormal grains (Fig.2a) and domain structure were observed (Fig.2b and 2c).
a) b) c)
Fig.2. SEM images of 2.0 at%La/BT sintered at 1350°C, a) abnormal grain incorporated in fine grained matrix, b) and c) abnormal grains with domain structure.
Regarding the domain structure, two types of domain structures were observed, i.e.
the directional long domains that pass through the entire grain with 90o domain boundaries
(Fig.2b) and randomly oriented domains within some individual abnormal grains (Fig.2c). The difference in microstructural features is also associated with the inhomogeneous
distribution of La2O3 as can be seen in EDS spectra, (Fig.3), taken from different area in the
of La-content (Fig.3b), corresponds to the abnormal grains with domain structure. The XRD pattern (Fig.3c) shows a crystalline phase which is consistent with a perovskite-type structure.
There is no evidence of any secondary phases.The difference in microstructure between low
and heavily doped samples could be responsible for particular dielectric properties. At 1350oC
a liquid phase sintering, with inhomogeneous distributed liquid phase, contributes to the secondary abnormal grain growth. The poor additive dispersion also contributes to the non uniformity of domain alignment i.e. to the banded domain structure.
a) b)
10 20 30 40 50 60 70 80 -100
0 100 200 300 400 500 600 700 800
(103)
(00
3)
(
2
12)
(
221)
(
300)
(2
02)
(
220)
(112)
(
211)
(10
2)
(
2
01)
(
210)
(0
02)
(
200)
(111)
(101)
(
110)
(001)
(
100)
In
te
n
z
ite
t
2θ
BT + 2% La
c)
Fig. 3 EDS spectra of 2.0 at% La-BT sintered at 1350oC showing two different types of regions, a) local area reach in La associated with fine grained matrix, b) grains with domain structure free of La and c) X-ray diffraction pattern for 2.0 at% La-BT shows a perovskite-type structure, there is no evidence of any secondary phase.
For low (0.1 and 0.5 at%) doped Dy/BT sintered at 1320 and 1350 oC, as illustrated
in Fig.4, a similar fine-grained microstructure, like in La-doped BaTiO3, with grain size
ranged from 0.5-3.0 μm was observed. In contrast to the uniform microstructure of the low
doped samples, the grain structure of the high doped samples was bimodal, comprising coarse
grains, sized around 10 μm, dispersed in a fine-grained matrix with grains sized from 1-2.0
μm, as can be seen in Fig.5a.
a) b) c) d)
Fig. 4 .SEM images of Dy-doped BaTiO3, a) 0.1 and b) 0.5 Dy/BT sintered at 1320oC and
c) 0.1 and d) 0.5 Dy/BT sintered at 1350oC.
5c). Since the dopant is not homogeneously distributed in BaTiO3, the quantity of “core-shell”
grains is limited. Also, in grains size over 3.0 μm the domain structure is detected (Fig.5d).
The domain width varies from 0.5 to 1 μm and the wall thickness ranged from
0.15 to 0.25 μm.
a) b) c) d)
Fig. 5. SEM images of 2.0 at% Dy-doped BaTiO3 sintered at 1350 oC, a) of as received
sample with grains sized around 10 μm. After chemical etching, b) and c) core-shell
structure, and d) domain structure.
a) b)
Fig. 6 . SEM/EDS images of 2.0at% Dy/BT sintered at 1350 oC, a) grains with core-shell structure (core is free of Dy content), and b) fine-grained matrix rich in Dy.
The difference in microstructure features in heavily doped samples is also associated
with the inhomogeneous distribution of Dy2O3 as can be seen in EDS spectra, (Fig.6), taken
from different area in the same sample. The grain core, free of Dy-content, indicates the un-doped ferroelectric region as shown in Fig.6a. According to the qualitative EDS analysis the Dy-rich regions are associated with small grained regions as given in Fig.6b, whereas EDS spectra free of Dy-content, corresponded to the large grains regions.
a) b) c) d)
Fig.7. SEM images of Sm-doped BaTiO3, a) 0.1 and b) 0.5 Sm/BT sintered at 1320oC and c)
0.1 and d) 0.5 Sm/BT sintered at 1350oC.
Nevertheless that all samples were prepared under the same procedure, the Sm/BT
samples exhibit the uniform compositional structure with grain size ranged from
0.3 to 1.0 μm as given in Fig.7. EDS analysis did not reveal any Sm rich regions thus
Dielectric characteristics
Regarding the electrical resistivity, all samples are electrical insulators with a
resistivity ρ> 1010 Ωcm at room temperature. It is believed that ionic compensation
mechanism is mainly involved and due to immobility of cation vacancies at room temperature the doped samples remain insulating. Also, in small grained microstructure, the thickness of grain boundary insulating layer becomes comparable to the size of grains and therefore the
resistivity is very high [12]. In addition, the effective carriers density is reduced owing to the
presence of Mn-acceptor.
The dielectric properties evaluation has been made by capacitance (dielectric permittivity) measurements in the frequency range from 100 Hz to 20 kHz. The dielectric constant for all samples decreases with increase of dopant concentration. After a slight higher
value of εr at low frequency, permittivity becomes nearly constant at frequency greater than
5 kHz.
The dielectric constant of the investigated samples at room temperature ranged from
1970 to 4800 for samples sintered at 1320°C and from 2200 to 6800 for samples sintered at
1350°C (Fig. 8). The highest value of permittivity at 1 kHz (εr=6800) at room temperature,
and an evident dependence of frequency is recorded for 0.1Sm/Mn-BaTiO3 doped ceramics
sintered at 13500C which is characterized by a uniform microstructure and highest density.
0 5 10 15 20
1600 2000 2400 2800 3200 3600 4000 4400 4800 f(kHz) BaTiO 3
Tsint=1320 0 C 0.1at% La 0.5at% La 2.0at% La 0.1at% Sm 0.5at% Sm 2.0at% Sm 0.1at% Dy 0.5at% Dy 2.0at% Dy εr
0 5 10 15 20
1500 2000 2500 3000 3500 4000 4500 5000 5500 6000 6500 7000 f(kHz) εr BaTiO3 T sint=1320 0 C 0.1at% Sm 2.0at% Sm
Tsint=1350 0 C
0.1at% Sm 2.0at% Sm
Fig.8. Dielectric constant in function of frequency, a)for doped BaTiO3 sintered at 1320 oC
and b) for 0.1 and 2.0 at% Sm doped BaTiO3 sintered at 1320o and 1350oC
The lowest value of dielectric constant (εr=1970) was measured in samples doped
with 2.0 at% of La sintered at 13200C. The low dielectric constant in La-/MnBaTiO3 samples
can be attributed from one side to the low density of these samples, only 70 %TD even if they
were sintered at 13500C, and from the other side, to the formation of secondary abnormal
grains that obviously lead to the decrease of dielectric permittivity.
The dielectric loss (tan ) values for all investigated samples are in the range from 0.01 to 0.15. The main characteristics for all specimens is that after initially greater dielectric
loss values, tanδ decreases and is nearly independent of frequency greater than 5 kHz. The
value of tan decrease with increase of sintering temperature.
The effects of additives on the dielectric behavior of modified BaTiO3 can be
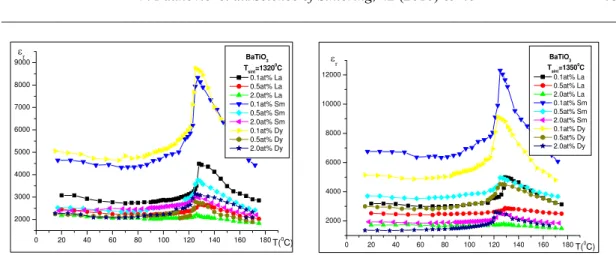
0 20 40 60 80 100 120 140 160 180 2000 3000 4000 5000 6000 7000 8000 9000 T(0 C)
εr BaTiO
3
Tsint=1320 0 C 0.1at% La 0.5at% La 2.0at% La 0.1at% Sm 0.5at% Sm 2.0at% Sm 0.1at% Dy 0.5at% Dy 2.0at% Dy
0 20 40 60 80 100 120 140 160 180 2000 4000 6000 8000 10000 12000 T(0 C) ε r BaTiO 3
Tsint=1350 0 C 0.1at% La 0.5at% La 2.0at% La 0.1at% Sm 0.5at% Sm 2.0at% Sm 0.1at% Dy 0.5at% Dy 2.0at% Dy
Fig.9. Dielectric constant in function of temperature of doped BaTiO3, a) sintered at 1320 oC
and b) sintered at 1350 oC.
The pronounced permittivity response and a sharp phase transition, from ferroelectric
to paraelectric phase at Curie temperature (TC), are observed for low doped samples.
A small variation in dielectric permittivity from room to nearly Curie temperature and nearly flat and stable permittivity response of dielectric constant were observed for samples with higher dopant amount (0.5 and 2 at%). The difference in permittivity over the
temperature region from room temperature up to 180 oC is less than 15 % which make the
high doped ceramics suitable for stable dielectric response.
The decrease in dielectric constant in doped samples with the increase of dopant concentration, is due firstly, to the nonhomogeneous distribution of additive throughout the specimens and secondly, to the increase of porosity.
Tab. I. Summary of dielectric parameters for doped barium titanate sintered at 1320 o and
1350°C
La-doped BT Dy-doped BT Sm-doped BT Additive
in at % 0.1 0.5 2.0 0.1 0.5 2.0 0.1 0.5 2.0 Tsin=1320°C
εr at
300K 3000 2350 1750 5000 2600 2000 4700 2600 2400
εr at Tc 4480 2603 2170 8750 2890 2290 8330 3754 3270
Tc 126 127 128 124 125 125 125 126 127 T0 58 -1.0 -62 74 40 -2 68 50 -30
C(105) 9.91 5.63 4.91 6.82 5.11 4.22 9.06 5.20 4.84 C’(⋅105) 1.53 3.75 8.7 3.51 4.60 10.51 3.64 2.30 6.97
γ 1.012 1.019 1.190 1.091 1.170 1.270 1.001 1.082 1.119 Tsin=1350°C
εr at
300K 3200 2700 2200 5900 3050 2300 6800 3800 2600
εr at Tc 4600 2700 2600 9120 4600 2400 12350 4700 2800
Tc 125 126 127 123 124 125 124 125 125 T0 58 -122 -65 82 -112 -62 79 1 -100
C(105) 8.39 8.21 5.19 6.62 5.08 4.55 6.88 6.29 6.24 C’(⋅105) 1.39 1.89 4.29 4.85 5.63 8.54 2.42 2.98 8.65
γ 1.010 1.015 1.132 1.021 1.034 1.310 1.004 1.006 1.150
value of dielectric permittivity of r =3200 at room temperature and the greatest change with
temperature (εr =4600 at Curie temperature) was measured in 0.1La-BT sintered at 1350oC.
For 2.0La-BT the dielectric permittivity was only 2200 at room temperature. The Dy and
Sm-doped samples, sintered at 1350oC showed a higher dielectric permittivity compare to
La-doped BT, being 5900 for 0.1Dy-BT and 6800 for 0.1Sm-BT at room temperature. The greatest change of dielectric constant with temperature was measured in 0.1Sm-BT sintered at
1350 oC from 6800 to 12350 at Curie temperature (Tab.I).
The permittivity–temperature measurements showed that the Curie temperature
varied in the narrow range from 123 to 128oC.
The permittivity for all samples can be characterized by the Curie-Weiss law
εr=C/T-To (1)
where C is the Curie constant and To Curie-Weiss temperature, which is close to the Curie
temperature. The Curie-Weiss temperature (T0) was obtained from the linear extrapolation of
the inverse dielectric constant from temperature above TC down to zero, and for some selected
samples is given in Fig. 10. The Curie constant (C) was obtained by fitting the plot of inverse values of dielectric constant vs. temperature and represents the slope of this curve for data above TC.
-20 0 20 40 60 80 100 120 140 160 180 0.00000
0.00005 0.00010 0.00015 0.00020 0.00025 0.00030 0.00035 0.00040 0.00045 0.00050 0.00055 0.00060 0.00065
T0
T(0 C)
1/εr
BaTiO 3 Tsint=1350
0 C
0.1 at% La 0.5 at% La 2.0 at% La
Fig.10. Reciprocal values of r in function of temperature for La-doped BaTiO3.
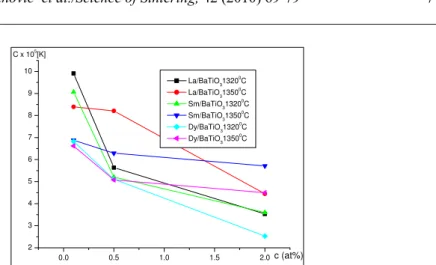
The Curie constant C (Fig.11), as well as the Curie-Weiss temperature T0, decreases
with increase of additive concentration for all series of samples. In 0.1 at % doped samples, that exhibit a high density and small grained microstructure, the Curie constant is higher compared to the high doped samples. It is believed that the value of Curie constant is related
to the grain size and porosity of samples. The highest value of C (C=9.91⋅105) was measured
in 0.1 La/Mn-BaTiO3 ceramics. The Curie constant C and the Curie-Weiss temperature T0 are
given in Tab. I.
To quantify the diffuseness i.e. the diffuse phase transformation atTmax the equation
proposed by Uchino and Nomura [18] has been used:
(
)
/ max
max 1 1
C T T
r r
γ
ε
ε
− =
− (2)
where εr is a dielectric constant, εm maximum value of dielectric constant, Tm temperature
where the dielectric value has its maximum, γ the critical exponent for diffuse phase
transformation (DPT) and C⁄ the Curie-like constant. According to reference [18] the critical
exponent γ is in the range 1≤γ≤2, 1 for a sharp phase transformation and 2 for diffuse phase
transformation. For BaTiO3 single crystal γ is 1.08 and for modified BaTiO3 gradually
increases up to 2 for diffuse phase transformation.
The dielectric parameters for doped BaTiO3 together with the values calculated
0.0 0.5 1.0 1.5 2.0
2 3 4 5 6 7 8 9 10 c (at%)
C x 105 [K]
La/BaTiO31320 0 C La/BaTiO31350
0 C Sm/BaTiO31320
0 C Sm/BaTiO31350
0 C Dy/BaTiO31320
0 C Dy/BaTiO
31350 0C
Fig. 11. Curie constant in function of additive concentration for doped BaTiO3 samples.
The critical exponent γ was calculated from the best fit of the curve ln(1/εr - 1/εm)vs.
ln (T−Tm) [19] where γ represents the slope of the curve (Fig.12). For low concentration of
dopant the critical exponent γ is in the range from 1.0 to 1.09, being only 1.001 for 0.1at%
Sm doped BaTiO3 samples sintered at 1350°C. The low values of γ (γ≈1) could be predicted
from the shape of εr vs.T plots which showed the sharp phase transition from ferroelectric to
paraelectric phase at Curie point.
0.0 0.5 1.0 1.5 2.0 2.5 3.0 3.5 4.0 -15 -14 -13 -12 -11 -10 -9
ln(T-Tmax)
ln (1/ εr -1 / εrm ax ) BaTiO 3 Tsint=1350
0 C
0.1 at% La 0.5 at% La 2.0 at% La
Fig. 12. The modified Curie-Weiss plot ln(1/εr - 1/εm) vs. ln (T−Tm) for selected BaTiO3
samples. The slope of the curve determines the critical exponent γ.
0.0 0.5 1.0 1.5 2.0
1.00 1.05 1.10 1.15 1.20 1.25 1.30 1.35 c (at%) γ
La/BaTiO31320 0 C La/BaTiO31350
0 C Sm/BaTiO31320
0 C Sm/BaTiO31350
0 C Dy/BaTiO31320
0 C Dy/BaTiO31350
0 C
Fig. 13.The critical exponent γ for doped BaTiO3 samplesin function of additive
The critical exponent γ slightly increases with the increase of additive concentration, pointed out a diffuse phase transformation for heavily doped samples (Fig. 13). The highest
value of γ (γ=1.31) was calculated in 2.0 at% Dy doped samples sintered at 1350°C.
Conclusion
The relative density of La/Mn doped ceramics ranged from 70-80 % of TD, 90 %TD for Dy doped BT and up to 93%TD for Sm-doped ceramics, and increased with sintering temperature. The main characteristic of low doped samples is the uniform and homogeneous
microstructure with grain size ranged from 0.3-3.0 μm for La/BT and 0.3-5.0 μm for both
Sm/BT and Dy/BT samples. All samples, independent of sintering temperature, have a
resistivity >1010 Ωcm at room temperature. The differences of r values in low and heavily
doped barium titanate are due firstly, to the different porosity of doped ceramics and secondly, to the compositional inhomogeneous structure in heavily doped samples. In La/BT and Dy/BT samples with 2.0 at% of additives two different types of regions were detected, the regions free of additives and the regions rich in additives. The highest dielectric constant
at room temperature ( r=6800), being as high as 12350 at Curie temperature, was measured in
0.10 Sm/BT samples sintered at 1350oC. The Curie temperature was in the narrow range from
123oC to 128oC. The diffuse phase transformation characterized the heavily-doped ceramics.
A nearly flat and stable permittivity response, together with low dissipation factor, was observed in specimens with 2.0 at% of dopant content.
Acknowledgements
This research is a part of the project “Investigation of the relation in triad: synthesis-structure-properties for functional materials” (No.142011G). The authors gratefully acknowledge the financial support of Serbian Ministry for Science and Technological Development for this work.
References
1. H.Kishi, N.Kohzu, J.Sugino, H.Ohsato, Y.Iguchi, T.Okuda, J. E. Ceram. Soc., 19,
(1999) 1043.
2. K.J.Park, C.H.Kim,Y.J.Yoon, S.M.Song, Y.T.Kim, K.H.Hur, J.E.Ceram.Soc., 29,
(2009) 1735.
3. J. Qi, Z.Gui, Y. Wang, Q.Zhu, Y.Wu, L.Li, Ceramics International, 28, (2002) 141.
4. H.M.Chan, M.P. Harmer, Smyth, D.M., J.Am.Ceram.Soc., 69, (1986) 507.
5. D.Makovec, Z. Samardzija, U.Delalut, D.Kolar, J.Am.Ceram.Soc., 78, (1995) 2193.
6. F.D.Morrison, A.M.Coats, D.C.Sinclair, A.R.West, J.Europ.Ceram.Soc., 6, [3]
(2001) 219.
7. F.D.Morrison, D.C. Sinclair, A.R. West, J.Am.Ceram.Soc., 84, [3], (2001) 531.
8. M.N. Rahaman, R.Manalert, J.Europ.Ceram.Soc., 18, (1998) 1063.
9. R. Zhang, J.F.Li, D.Viehland, J.Am.Ceram.Soc., 87, (2004) 864.
10. N.Kurata, M.Kuwabara, J.Am.Ceram.Soc., 76 [6], (1993) 1605.
11. A.Yamaji, Y.Enomoto, K.Kinoshita, T.Murakami, J. Am. Ceram. Soc., 60 [3-4],
12. W.H.Lee,W.A.Groen,H.Schreinemacher,D.Hennings, Journal of Electroceramics, 5, (2000) 31.
13. D.Makovec, Z Samardžija, M.Drofenik, J.Am.Ceram.Soc. 87 [7], (2004) 1324.
14. Z.C.Li, H.Yhang, X.Zou, B.Bergman, Materials Science and Engineering B, 116,
(2005) 34.
15. K.Albertsen, D. Hennings, O. Steigelmann, Journal of Electroceramics, 2:3, (1998)
193.
16. T.F.Lin, C.T.Hu, I.N.Lin, J.Am.Ceram.Soc., 73 [3], (1990) 531.
17. Y.K.Cho, S.L.Kang, D.Y.Yoon, J.Am.Ceram.Soc., 87, (2004) 119.
18. K.Uchino, S. Namura.., Ferroelectric lett., 44, (1982) 55.
19. V.S.Tiwari, D.Pandey, J. Am. Ceram. Soc., 77, [7], (1994) 1819.
Са р а: ј La/Mn, Sm/Mn Dy/Mn BaTiO3 ,
ј 0.1 2 at%, ј ј
ј . У 1320°C
1350°C ј . У
ј
0.3 μm 5.0 μm. ј
ј - La/BaTiO3 Dy/BaTiO3
ј 1350°C. У
ј 1350°C, ј
ј , 6800 Sm/BaTiO3, 5900
Dy/BaTiO3 3100 La/BaTiO3.
ј 2.0 at% .
К К -В ј К ј
(C⁄) γ. И γ ј
ј BaTiO3 ј .
К учн р чи: Д BaTiO3 , , ,