Synthesis and Characterization of Yttrium Stabilized Zirconia Nanoparticles
Thirupathy Mariduraia, Dhanapal Balajib, Suresh Sagadevanc*
aDepartment of Production Engineering, Velammal Engineering College, Chennai 600 066, India bDepartment of Automobile Engineering, Velammal Engineering College, Chennai 600 066, India
cDepartment of Physics, AMET University, Chennai 603 112, India
Received: March 5, 2016; Revised: April 20, 2016; Accepted: May 23, 2016
Yttria stabilized zirconia (YSZ) nanoparticles were synthesized by the co-precipitation method. The crystallinity, morphological and optical properties of the YSZ nanoparticles were studied by using
X-ray difraction (XRD), scanning electron microscopy (SEM), transmission electron microscopy (TEM), FT-Raman, photoluminescence (PL) spectrum analyses. The grain size and crystal structure of the YSZ was conirmed by XRD. SEM and TEM analyses showed that the synthesized samples
were composed of the size of nanometers. The optical property of the synthesized nanoparticles was studied from the photoluminescence spectrum. The dielectric properties such as the dielectric
constant, the dielectric loss and AC conductivity of the YSZ nanoparticles were studied in the diferent
frequencies and temperature.
Keywords: Yttria stabilized zirconia, Nanoparticles, FT-Raman, SEM, TEM, and Dielectric studies
1. Introduction
Zirconia (ZrO2) nanoparticles have been reported to have unique properties such as excellent refractoriness, chemical resistance, good mechanical strength, high ionic conductivity, low thermal conductivity at high temperature together with relatively high thermal expansion coefficient and good thermal stability1,2. A wide-ranging
industrial applications including fabrication of dense ceramics, sensors, batteries, capacitors, corrosion-resistant and thermal barrier coatings, solid electrolytes for fuel cells, catalysts, etc. have been established3-5. It
is therefore vital to study the ZrO2 nanoparticles. Pure ZrO2 has three main polymorphs-monoclinic, tetragonal and cubic. The monoclinic form is thermodynamically stable at room temperature but transforms reversibly to the tetragonal structure above 1170°C. High temperature polymorphs (tetragonal and cubic) have to be stabilized at lower temperature because of their application in various fields, either by adding stabilizers such as Y2O3, MgO, and CaO or by reduction in grain or particle size into nanometer regime6. Owing to its wide applications
and exceptional properties such as high mechanical strength, good chemical stability, high level of oxygen-ion conductivity, corrosoxygen-ion resistance, low thermal conductivity, and interesting luminescent functions, yttria stabilized zirconia (YSZ) plays an important role among the doped alloys of ZrO27-12. In the present study,
co-precipitation method was employed to prepare the Yttria stabilized zirconia nanoparticles. The structural, spectral optical and electrical properties of the Yttria stabilized zirconia nanoparticles were determined in
depth by means of XRD, FT-IR spectroscopy, PL, SEM, TEM, and Dielectric measurements.
2. Experimental Synthesis
For the preparation of Yttria stabilized zirconia (YSZ)
powders by co-precipitation method, zirconium (IV) acetate hydroxide (C6H10O7Zr), yttrium (III) acetate tetrahydrate (C6H9O6Y•4H2O) and oxalic acid dehydrate (C2H6O6) were used. The stoichiometric amounts of zirconium (IV) acetate hydroxide and yttrium (III) acetate tetrahydrate were dissolved in diluted acetic acid. The obtained solution of Y and Zr salts was slowly poured into aqueous solution of oxalic acid under active stirring at 60○C for 20 min. As a result, white opaque colloidal solution was formed.To promote sedimentation, concentrated ammonia solution was added drop-wise to the
reaction mixture up to pH 9–10. The precipitate was iltered,
washed with distilled water and acetone and then dried for 24 h at 100○C in air. The dried precipitate was ground to ine powder using agate mortar and pestle. The powders were
calcined at 700°C for 3 h. The XRD pattern of the Yttria
stabilized zirconia (YSZ) nanoparticles was noted by using
a powder X-ray difractometer (Schimadzu model: XRD
6000 using CuKα (λ = 0.154 nm) radiation, with a difraction angle between 20o and 80º. Scanning Electron Microscopy (SEM) studies were carried out on JEOL, JSM- 67001. Image of Transmission Electron Microscope (TEM) was taken using an H-800 TEM (Hitachi, Japan) with an accelerating voltage of 100kV. Raman spectrum was obtained using a Bruker RFS 27: stand-alone model Raman spectrometer. The photoluminescence (PL) spectrum of the Yttria stabilized zirconia (YSZ) nanoparticles was recorded using the Perkin-Elmer lambda 900 spectrophotometer with a Xe lamp as the
excitation light source. The dielectric - and the dielectric loss
of the pellets of Yttria stabilized zirconia nanoparticles in disk
form were examined for various frequencies and temperatures. The dielectric properties of the Yttria stabilized zirconia (YSZ) were analyzed over the frequency range 50Hz-5MHz using
3. Results and Discussion
3.1 Structural Characterization
The XRD patterns of the Yttria stabilized zirconia (YSZ) powders are shown in Figure 1. All the difraction peaks are
indexed to the cubic zirconia. However, the characteristics
relections for tetragonal and cubic phases are located and hence the difraction pattern of YSZ could be attributed
to the cubic and tetragonal phases13-16. All peaks obtained by XRD analysis were assigned by comparison with data from the Joint Committee on powder Difraction Standards (JCPDS).The average grain size (D) was calculated using
the Scherrer formula,
.
( )
cos
D
=
b
0 9
m
i
1
Where, λ is the X-ray wavelength (CuKα radiation and
equals to 0.154 nm), θ is the Bragg difraction angle, and β is the FWHM (Full Width Half Maxima) of the XRD peak appearing at the difraction angle θ. The average grain size
was calculated from X-ray line broadening using Scherrer equation and it was found to be about 12 nm.
Figure 1: XRD patterns of as synthesized YSZ.
3.2 Morphological Characterization
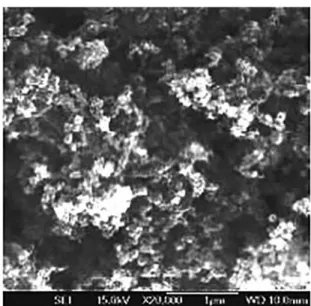
The nanoparticles are in uniform spherical shape
and narrow size distribution as revealed by the SEM images shown in Figure 2. Moreover, they conirm good
morphology with smaller nanoparticles size. It is seen that equiaxial particles, uniform in shape and size, with a relative tendency of agglomeration are observed. The
EDS spectrum shown in Figure 3 conirms the purity and
content of the synthesized sample clearly. The atomic
ratio of Zr:Y obtained from the EDS analysis agrees well
with the initial composition used for synthesis of the
nanomaterial. The TEM micrograph of yttria stabilized
zirconia powder is shown in Figure 4. The TEM images indicate that the particles are of uniform size with an average particle size approximately of 17 nm.
Figure 2: SEM image of YSZ.
Figure 3: EDS spectrum of YSZ.
3.3 FT-Raman Analysis
In the Raman spectrum shown in Figure 5, six prominent peaks corresponding to the Raman-active modes of tetragonal phase are observed for Yttria stabilized zirconia. The peaks are directly related to the 3Eg, 2B1g, and lA1g symmetries
as predicted and reported for the tetragonal phase17,18. The
Raman spectrum is found to be very similar, except for the
observed peak broadening and a slight shift in the Eg (2) peak to lower frequencies with yttrium dopant concentration.
3.4 Photoluminescence Studies
The photoluminescence spectrum was recorded corresponding to an excitation wavelength centered at
293 nm. The PL spectrum of Yttria stabilized zirconia was recorded at room temperature and is given in Figure 6.
Yttria doped zirconia, a UV emission centered at 365 nm,
an eicient violet emission centered at 400 nm, and a small
the PL excitation band around 293 nm can be attributed to
defect states due to oxygen vacancies that exist at the grain boundaries in the YSZ samples that are an inherent aspect of nanocrystallinity19,20.
3.5 Dielectric Properties
The variations of dielectric constant with frequency and
temperature for YSZ nanoparticles are shown in Figure 7. At
low frequencies the dielectric constant of YSZ nanoparticles is high and it decreases rapidly at all temperatures with the applied frequency. It is also observed from the plot that with an increase in the temperature, the dielectric constant increases and this is attributed to the presence of space charge polarization near the grain boundary interfaces, on which the purity and exactness of the sample rely21. Hence the dielectric
constant of nanostructured materials needs to be larger than
that of the conventional materials. Due to the grain boundary
interfaces structures the space charge polarization increases and results into the large dielectric constant of nanocrystalline
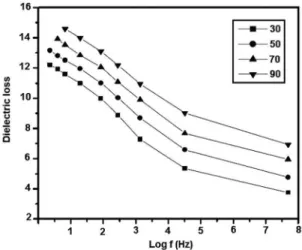
materials at suiciently high temperature. Figure 8 shows the
variations of the dielectric loss of YSZ nanoparticles with frequency and temperature. The dielectric loss decreases when the frequency increases and at higher frequencies the loss angle remains nearly the same at all temperatures. In dielectric materials, generally dielectric losses occur due to absorption current22. The orientation of the molecules along the direction of the applied electric ield in polar dielectrics
requires a part of the electric energy to overcome the forces of internal friction23. Another part of the electric energy is utilized for rotations of dipolar molecules and other kinds
of molecular transfer from one position to another, which also involves energy losses.
Figure 4: TEM image of YSZ.
Figure 5: Raman spectrum of YZS.
Figure 6: PL spectrum of YSZ
Figure 7: Dielectric constant with log frequency.
3.6 AC Conductivity studies
Electrical conduction in Yttria stabilized zirconia nanoparticles takes place as a result of electrons jumping
The AC electrical conductivity was found to increase with increase in the temperature and frequency.
5. References
1. Tahmasebpour M, Babaluo AA, Razavi Aghjeh MK. Synthesis
of zirconia nanopowders from various zirconium salts via polyacrylamide gel method. Journal of the European Ceramic Society. 2008;28(4):773-778. DOI: http://dx.doi.org/10.1016/j. jeurceramsoc.2007.09.018
2. Garcia FL, Resende VG, De Grave E, Peigney A, Barnabé A, Laurent C. Iron-stabilized nanocrystalline ZrO2 solid solutions:
Synthesis by combustion and thermal stability. Materials Research Bulletin. 2009;44(6):1301-1311. DOI: http://dx.doi. org/10.1016/j.materresbull.2008.12.014
3. Guo GY, Chen YL. A nearly pure monoclinic nanocrystalline
zirconia. Journal of Solid State Chemistry.
2005;178(5):1675-1682. DOI: http://dx.doi.org/10.1016/j.jssc.2005.03.005 4. Liang J, Jiang X, Liu G, Deng Z, Zhuang J, Li F, et al. Characterization
and synthesis of pure ZrO2 nanopowders via sonochemical method. Materials Research Bulletin. 2003;38(1):161-168.
DOI: http://dx.doi.org/10.1016/S0025-5408(02)01007-3 5. Sadykov VA, Zaikovskii VI, Zyuzin DA, Moroz EM, Burgina
EB, Ishchenko AV. Nanoscale Structural Features of Ultra-ineZirconia Powders Obtained Via Precipitation-hydrothermal
Treatment Route. MRS Proceedings. 2005;878:Y4.8.
6. Chandra N, Singh DK, Sharma M, Upadhyay RK, Amritphale
SS, Sanghi SK. Synthesis and characterization of nano-sized zirconia powder synthesized by single emulsion-assisted direct precipitation. Journal of Colloid and Interface Science.
2010;342(2):327-332. PMID: 19942226 DOI: http://dx.doi. org/10.1016/j.jcis.2009.10.065
7. Amézaga-Madrid P, Antúnez-Flores W, González-Hernández J, Sáenz-Hernández J, Campos-Venegas K, Solís-Canto O, et al. Microstructural properties of multi-nano-layered YSZ thin ilms. Journal of Alloys and Compounds. 2010;495(2):629-633. DOI: http://dx.doi.org/10.1016/j.jallcom.2009.10.257
8. Farhikhteh S, Maghsoudipour A, Raissi B. Synthesis of nanocrystalline
YSZ (ZrO2–8Y2O3) powder by polymerized complex method.
Journal of Alloys and Compounds. 2010;491(1-2):402-405.
DOI: http://dx.doi.org/10.1016/j.jallcom.2009.10.196 9. Oghaz MH, Razavi RS, Loghman-Estark MR, Ghasemi R.
Optimization of Morphology and Particle Size of Modiied Sol Gel Synthesized YSZ Nanopowder Using Taguchi Method. Journal of Nano Research. 2013;21:65-70. DOI: http://dx.doi. org/10.4028/www.scientiic.net/JNanoR.21.65
10. Hajizadeh-Oghaz M, Razavi RS, Khajelakzay M. Optimizing
sol–gel synthesis of magnesia-stabilized zirconia (MSZ) nanoparticles using Taguchi robust design for thermal barrier coatings (TBCs) applications. Journal of Sol-Gel Science and Technology. 2015;73(73):227-241. DOI: http://dx.doi. org/10.1007/s10971-014-3521-3
11. Hajizadeh-Oghaz M, Razavi RS, Loghman-Estarki MR. Synthesis and
characterization of non-transformable tetragonal YSZ nanopowder
by means of Pechini method for thermal barrier coatings (TBCs)
applications. Journal of Sol-Gel Science and Technology.
2014;70(1):6-13. DOI: http://dx.doi.org/10.1007/s10971-014-3266-z
12. Hajizadeh-Oghaz M, Razavi RS, Ghasemi A. Synthesis
and characterization of ceria–yttria co-stabilized zirconia (CYSZ) nanoparticles by sol–gel process for thermal barrier coatings (TBCs). Journal of Sol-Gel Science and Technology.
2015;749(3):603-612. DOI:
http://dx.doi.org/10.1007/s10971-015-3639-y
Figure 8: Variation of dielectric loss with log frequency.
movement of ions. The frequency dependence behaviour of the ac conductivity in the temperature interval from 30oC to
90oC is shown in Figure 9. The ac conductivity increases with
the increase in frequency for all temperatures. The increase in frequency enhances the electron hopping frequency and hence it is observed that ac conductivity gradually increases
with the increase in frequency of applied ac ield. The
increased conductivity at higher frequencies could be due to the reduction in space charge polarization24.
Figure 9: AC conductivity plot for YSZ nanoparticles.
4. Conclusion
By using co-precipitation method Yttria stabilized zirconia nanoparticles were synthesized successfully.
The structure was conirmed from the XRD pattern. The synthesized samples were ascertained by SEM and TEM
analyses and the sizes calculated were in nanometers. The
optical properties were studied by using the PL spectrum.
13. Loghman-Estarki MR, Nejati M, Edris H, Razavi RS, Jamali H, Pakseresht AH. Evaluation of hot corrosion behavior of plasma
sprayed scandia and yttria co-stabilized nanostructured thermal barrier coatings in the presence of molten sulfate and vanadate salt. Journal of the European Ceramic Society.
2015;35(2):693-702. DOI: http://dx.doi.org/10.1016/j.jeurceramsoc.2014.08.029 14. Loghman-Estarki MR, Razavi RS, Edris H, Bakhshi SR,
Nejati M, Jamali H. Comparison of hot corrosion behavior
of nanostructured Sc YSZ and YSZ thermal barrier coatings.
Ceramics International. 2016;42(6):7432-7439. DOI: http:// dx.doi.org/10.1016/j.ceramint.2016.01.147
15. Loghman-Estarki MR, Pourbafrany M, Razavi RS, Edris H, Bakhshi SR, Erfanmanesh M, et al. Preparation of nanostructured YSZ
granules by the spray drying method. Ceramics International.
2014;40(2): 3721-3729. DOI: http://dx.doi.org/10.1016/j.
ceramint.2013.09.050
16. Loghman-Estarki MR, Razavi RS, Edris H, Pourbafrany M, Jamali H, Ghasemi R. Life time of new SYSZ thermal barrier
coatings produced by plasma spraying method under thermal
shock test and high temperature treatment. Ceramics International.
2014;40(1 PartB):1405-1414. DOI: http://dx.doi.org/10.1016/j.
ceramint.2013.07.023
17. Loghman-Estarki MR, Hajizadeh-Oghaz M, Edris H, Razavi RS.
Comparative studies on synthesis of nanocrystalline Sc2O3–Y2O3
doped zirconia (SYDZ) and YSZ solid solution via modiied and classic Pechini method. CrystEngComm. 2013;15:5898-5909.
DOI: http://dx.doi.org/10.1039/c3ce40288f
18. Loghman-Estarki MR, Edris H, Razavi RS. Large scale
synthesis of non-transformable tetragonal Sc2O3, Y2O3 doped ZrO2 nanopowders via the citric acid based gel method to obtain plasma sprayed coating. Ceramics International.
2013;39(7):7817-7829. DOI: http://dx.doi.org/10.1016/j.
ceramint.2013.03.042
19. Kiisk V, Lange S, Utt K, Tätte T, Mändar H, Sildos I. Photoluminescence of sol–gel-prepared hafnia. Physica B: Condensed Matter. 2010;405(2):758-762. DOI: http://dx.doi. org/10.1016/j.physb.2009.09.101
20. Petrik NG, Taylor DP, Orlando TM. Laser-Stimulated Luminescence of Yttria-Stabilized Cubic Zirconia Crystals. Journal of Applied Physics. 1999;85(9):6770-6776. DOI: http:// dx.doi.org/10.1063/1.370192
21. Suresh S, Arunseshan C. Dielectric Properties of Cadmium Selenide (CdSe) Nanoparticles synthesized by solvothermal
method. Applied Nanoscience. 2014;4(2):179-184. DOI: http://
dx.doi.org/10.1007/s13204-012-0186-5
22. Suresh S. Synthesis, structural and dielectric properties of
zinc sulide nanoparticles. International Journal of Physical Sciences. 2013;8(21):1121-1127.
23. Suresh S. Studies on the dielectric properties of CdS nanoparticles.
Applied Nanoscience. 2014;4(3):325-329. DOI: http://dx.doi. org/10.1007/s13204-013-0209-x