RBRH, Porto Alegre, v. 22, e19, 2017 Scientiic/Technical Article
http://dx.doi.org/10.1590/2318-0331.011716040
Compensatory alternatives for looding control in urban areas with tidal inluence in
Recife - PE
Alternativas compensatórias para controle de alagamentos em área urbana com influência das marés no Recife - PE
Marcos Antonio Barbosa da Silva Junior1, Simone Rosa da Silva1 and Jaime Joaquim da Silva Pereira Cabral2
1Universidade de Pernambuco, Recife, PE, Brazil 2Universidade Federal de Pernambuco, Recife, PE, Brazil
E-mails: [email protected] (MABSJ), [email protected] (SRS), [email protected] (JJSPC)
Received: March 31, 2016 - Revised: October 10, 2016 - Accepted: November 08, 2016
ABSTRACT
This paper presents a study of compensatory alternatives in urban drainage, using SWMM model (Storm Water Management Model),
for the critical point of looding in an urban area and vulnerable to tide luctuations, located in Recife. For this, we used the registered information of the micro-drainage network and deined the parameters and variables required for modeling, such as: the subareas of contribution to the drainage system, indicating the percentage of soil waterprooing, equivalent width, slope, and iniltration rate; project rain; and tide curve. Two alternatives were simulated after the model has been calibrated. The irst, which is an adaptation of the drainage network, presented maximum reductions in the volume of looding of 37% for the events with recurrence period of two years and of 58% for ive years of recurrence. The second, based on the deployment of a detention tank in the existing network, presented satisfactory results for the event of two years and reduced approximately 38% for events of ive years. The results showed that there was a reduction in the area of looding for the conditions simulated. However, the irst alternative would not solve the local looding problems, it would only attenuate and would increase the overload of the drainage pipes downstream of the modiied system, while the second alternative could solve the problem of looding, with the occurrence of an event of two years.
Keywords: Urbanization; Hydrological model (SWMM); Flooding control; Compensatory alternatives.
RESUMO
Este trabalho apresenta um estudo de alternativas compensatórias em drenagem urbana, utilizando o modelo SWMM (Storm Water Management Model), para o ponto crítico de alagamento numa área urbana e vulnerável as oscilações de maré, situada no Recife.
Para isto, utilizaram-se informações cadastrais da rede de microdrenagem e deiniram-se os parâmetros e variáveis necessários para
a modelagem, tais como: subáreas de contribuição ao sistema de drenagem, indicando o percentual de impermeabilização do solo,
largura equivalente, declividade e taxa de iniltração; chuva de projeto; e curva de maré. Com o modelo calibrado, foram simuladas duas condições alternativas. A primeira, que trata de uma adequação da rede de drenagem, apresentou reduções máximas no volume de alagamento de 37% para os eventos com período de retorno de dois anos e de 58% para cinco anos de recorrência. A segunda,
baseada na implantação de um reservatório de detenção na rede existente, apresentou resultado satisfatório para o evento de dois
anos e reduziu cerca de 38% para eventos de cinco anos. Os resultados mostraram que houve uma redução na área de alagamento
para as condições simuladas. No entanto, a primeira alternativa não resolveria os problemas de alagamentos locais, apenas atenuaria e
aumentaria a sobrecarga dos condutos a jusante do sistema modiicado, enquanto que a segunda alternativa poderia resolver o problema dos alagamentos, com a ocorrência de um evento de dois anos.
INTRODUCTION
The accelerated, unplanned urbanization process of Brazilian municipalities has brought major changes to the urban
environment relected as signiicant impacts on urban drainage.
Yannopoulos et al. (2013) emphasizes that this process generates increased and accelerated surface run-off of rainfall
waters in addition to decreasing the iniltration capacity of water in the soil causing looding.
This situation is more serious especially on coastal lowlands, as in the case of the city of Recife, where the urban occupation process was unorganized having resulted in a drainage system highly vulnerable to tidal oscillations, which may cause serious
looding scenarios along intensive rainfall periods combined with
high tide (SILVA JÚNIOR, 2015).
In the context of such geographical and urban peculiarities
in which the city was conceived, Recife currently has 159 looding points, classiied as the most critical ones (EMLURB, 2013).
The inclusion of the sustainability concept as a urban drainage theme has revealed compensatory alternatives aiming at systematically compensating the effects of urbanization on urban waters by retrieving natural hydrologic functions (MIGUÉZ et al., 2014).
The objective of applying such measures is to adjust
hydrologic cycle processes through iniltration and storage of the
run-off generated in order to increase the concentration time of
the basin and decrease the outlow peaks generated by a rainfall
event (SILVA; CABRAL, 2014).
Among the measures of run-off control, Canholi (2005)
highlights the use of detention pond to mitigate low peaks. The author emphasizes the eficiency of these reservation works
in relation to conventional drainage solutions, especially regarding
not transferring looding downstream, which certainly would
occur in case the solution had been only replacing the network of galleries by another of a larger dimension.
A way to estimate the performance of these mitigating solutions before their actual implementation is by using hydrologic and hydraulic models, from which it is possible to simulate
hydrologic events to assess the consequences of applying these
control measures (DECINA; BRANDÃO, 2016). In this context, this paper presents compensatory alternatives to a strongly
urbanized area with looding issues locate in the neighborhood
of Soledade, Recife.
For this purpose, our study on these alternatives was based on the results pointed out using the SWMM model (Storm
Water Management Model), which veriied two possibilities for
intervention in the local drainage network: adjustment of the drainage network and implementation of a detention reservoir.
MATERIAL AND METHODS Case study
The critical looding point, located at the crossing of João de Barros Avenue with Joaquim Felipe Street, has been chosen
in a joint effort with EMLURB (public company in charge of Recife drainage system).
In order to consolidade the study, it was necessary to analyze the increase in the run-off volume caused by urbanization,
upstream to the critical point in question. Therefore, other
surrounding neighborhoods (Boa Vista and Santo Amaro) were considered in the analysis.
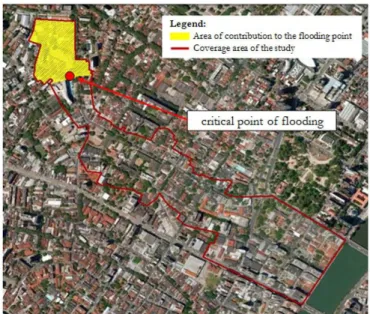
Figure 1 illustrates an area of contribution to the looding
point and the coverage area of the study, deined from the drainage
system belonging to the main system of the studied area up to its discharge at Capibaribe River.
The area of contribution to the looding point has approximately 4.68 ha with a perimeter of nearly 1,086 m; the
coverage area of the study has 38.36 ha with a perimeter of 4,893 meters and a compactness index (Kc) of 2.23.
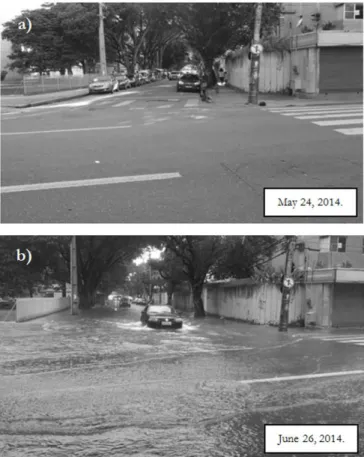
Along the rainy periods, the looding occurrences in the
Soledade neighborhood concentrate in parts of João de Barros
Avenue, more speciically next to Joaquim Felipe Street (Figure 2).
Hydrologic model
In order to simulate the hydrologic responses of the area of study, we used the SWMM v.5 model, developed by U.S EPA (United States Environmental Protection Agency) in 1971 (PROCEL-SANEAR, 2012). The SWMM is a rainfall-low dynamics model used for urban drainage management that simulates both
the amount and the quality of the surface run-off, especially
in urban areas. It can be used to simulate a single rainfall event continuously and on short-term as well as for wastewaters drainage (JIANG et al., 2015).
The surface run-off simulation considers that the subareas behave as non-linear reservoirs from the combination of Manning
and continuity equations. The run-off propagation in the drainage network, in turn, is calculated by complete Saint Venant equations through modiied Euler method (GARCIA; PAIVA, 2006).
The model is divided in many different computational blocks that can be simulated separately. Among these, for the
Figure 1. Area of contribution to the looding point and area
modelling process of the area of study, we simulate the following
blocks: “Runoff ” in the transformation of the rainfall into low;
“Transport”, which simulated the transport in the network of
galleries according to the concept of kinematic wave; “Extran”,
for the hydrodynamic modelling of the conduits (network of galleries), and “Statistics”, which separated the record in hydrogram for independent rainfall events in addition to conducting statistical
calculation and frequency analyses.
Parameters and variables for model input
The parameters required for the hydrologic rainfall-low
simulation of the study area, in addition to infrastructure register information of the existing drainage, are the physical characteristics of each contributing subarea to this drainage system (area, percentage of the permeable and the impermeable area,
representative width, declivity, manning’s roughness coeficient,
and depression storage level).
Furthermore, variables such as precipitation, iniltration and
tide were also considered in this process, which are detailed below.
• Parameters:
- Register of the microdrainage: The register of the drainage system of the rainfall waters of the area of study was granted in digital media by EMLURB.
The abovementioned register had to be complemented with the information of the cadaster plan of the microdrainage system of Recife, carried out by the Companhia Pernambucana de
Saneamento – Sanitation Company of Pernambuco (Compesa) in the 1980s, also granted by the institution in printed media on a scale of 1:1.000. In addition, the technical team of Emlurb conducted complementary topographic surveys at some manholes in order to improve the data granted.
- Physical characteristics of the subareas: We carried out the subdivisions of each contribution area to each manhole considered in the model, numbering 34 subareas.
After this process and once we obtained the area, equivalent
width, declivity and impermeabilization rate of each subarea, other
aspects were deined for inclusion in the model, such as the manning’s roughness coeficient (permeable areas: 0.15 s/m1/3/ impermeable
areas: 0.024 s/m1/3) and storage height in depressions (permeable
areas: 5 mm/ impermeable areas: 2.54 mm). • Variables:
- Rainfall: We used hourly precipitation data of the automatic station RECIFE-A301 operated by Inmet, located at radius of nearly 6 km of distance from the area studied. For the hydrologic simulations, we considered the rainfall events from June 25 and 26, 2014 and May 17, 2013. The objective of including the latter event was to adjust the model to the local in study providing support to its calibration. Table 1 presents the characteristics of the simulated events, while Figure 3 illustrates the histograms of the respective rainfall events.
Figure 2. Joaquim Felipe Street in the dry season (a) and in the
rainy season (b). Source: Silva Júnior (2015).
Table 1. Synthesis of simulated events.
Date of event Duration (h) Rainfall (mm) calculatedTR June 25-26, 2014. 20 107.60 2 years May 17, 2013. 13 150.80 5 years
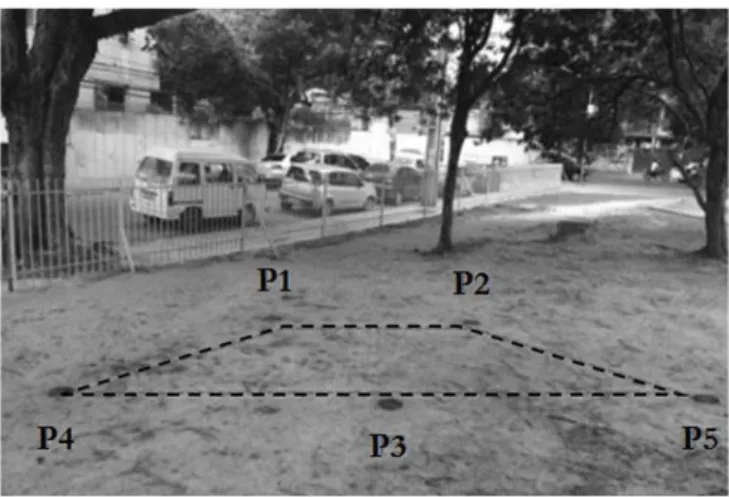
- Iniltration: The SWMM considered the Horton iniltration model for iniltration determination in permeable areas. The parameters inherent to this iniltration model were obtained from iniltration assays using iniltrometer with
a single ring. The assays were carried out in a parcel of
the soil without vegetation at an area close to the looding point in study from ive points distributed in the shape of
a trapezium (Figure 4).
Despite the proximity among the ive points tested, the resulting curves of the iniltration assays presented different
behaviors, according to the chart in Figure 5. This can be associated with the compaction of the soil in the points investigated as well as with the conditions of initial moisture of the assay.
Facing this conclusion, we decided to use the curve of
iniltration capacity with the best adjustment based on the correlation
index (R2). The value of the determination coeficient here described
states only how much the curve was able to represent the points.
Thus, according to this criterion, we veriied that the iniltration
capacity curve of Point 1 had a correlation index closer to one (R2=0.9808), as illustrated in Figure 5.
Based on the iniltration capacity curve equation for Point 1, adjusted to the Horton equation, it was possible to obtain the parameters required to feed the model: the maximum and minimum iniltration rates (467.56 mm/h and 62.79 mm/h, respectively) and the decay coeficient (3.282 h–1).
- Tide: Applied as return condition in the “Discharge” junction, the tidal levels were obtained using time interpolation of
the tidal records for the Recife Harbor, made available
on the website of the Diretoria de Hidrograia e Navegação –
DHN – Board of Hydrography and Navigation (Figure 6).
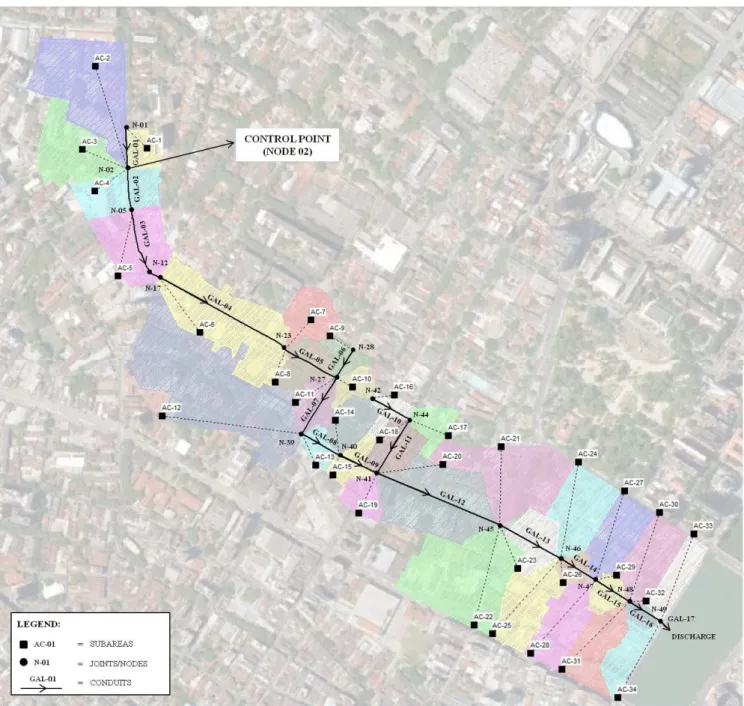
Assembly of the network and calibration
After obtaining the register of the rainfall waters system, the drainage network was included in the SWMM with the
identiication of the objects: Joints/Nodes and Conduits attributed with topographic quotes and extensions of the existing elements
of drainage.
The focus of the mesh of the drainage system in the implemented model was mainly the interventions in the main pipeline of the system (trunk network), responsible for the drainage of the rainfall waters in the area of study.
Figure 7 illustrates the model layout based on the aforementioned information, representing the scheme of the drainage network implemented in the SWMM considering the Emlurb register.
After including the input parameters and variables in the model, we carried out the model calibration based on the extreme precipitation events occurred in June 25-26, 2014 and May 17, 2013, thus constituting Scenario 01 (Current Condition).
In the absence of level sensors and measurers for low in
the area studied, necessary to process a sensitivity study, calibration
and validation of the parameters, we decided to conduct a simpliied
calibration of the model, based exclusively on the adjustment
of the simulated looding volume to that observed during the
occurrence of the considered events, only at the control point.
Figure 4. Distribution of the points tested.
Figure 5. Curves of iniltration capacity in the ive points tested
With this procedure, the calibration obtained can be deined
as a summary procedure since it was carried out manually by
manipulating both parameters: manning’s roughness coeficient
for the conduits and height of the sediment layer deposited in the conduits.
In general, the objective of this process was to represent
the current functioning of the system considering the looding
of Junction “Node 2” (Figure 7) deined as control point by manipulating the parameters mentioned for the maximum volume
of simulated looding in the aforementioned junction would be
compatible with the inspections proceeded at the location during the rainfall events considered in the study. This same procedure had also been adopted by other authors, such as Silva and Cabral (2014).
The calibration enabled the simulation of the alternatives
for looding control in the area based on the proposition of
interventions in the existing drainage network, either due to the readjustment of the network itself or by implementing an on-line reservoir of the system (Scenario 02 - Alternative Condition).
RESULTS AND DISCUSSION Scenario 01: current condition
For the calibration of the model, we used the heights observed in the water line of the respective rainfall events as well
as the looding area (Table 2 and Figure 8), delimited from the
This process revealed that the event from June 25-26, 2014
had a mean correlation coeficient between the estimated and the
simulated volumes at the control point of 0.97. For the event
from May 17, 2013, the mean correlation coeficient was of 0.96
(Table 3). The results reveal that despite the obtained calibration
is deined as a summary procedure, the mean correlation between
the simulated and the observed conditions proved satisfactory, with indices very close to 1.
The continuity errors found during the simulation process (Table 3) are within the acceptance limit having presented values
below 10%, according to recommendation in the model user’s
manual (PROCEL-SANEAR, 2012). This same acceptance limit had been adopted by other authors, such as Silva and Cabral (2014). In these conditions, Figures 9 and 10 illustrate the hydrographs simulated at the control point (Node 2) in the occurrence of the
simulated precipitation events with peak lows.
Table 3. Main results obtained from the simulation.
Aspects ObservedJune 25-26, 2014.Simulated ObservedMay 17, 2013.Simulated
Maxium looding blade (m) 0.14 0.12 0.27 0.27
Maximum looding rate (m) 5.24 5.22 5.37 5.37
Maximum looding volume (m3) 182.0 175.0 679.9 681.0
Continuity errors Surface run-off −0.03% −0.04%
Outlow propagation −8.57% −2.18%
Mean correlation coeficient 0.97 0.96
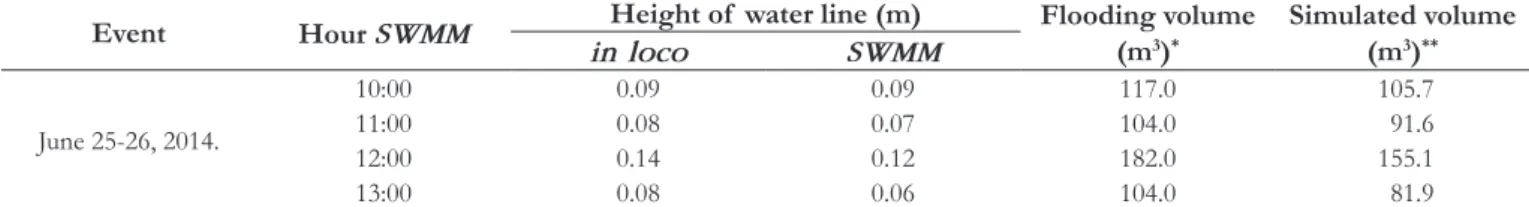
Table 2. Heights and volumes of looding observed and simulated in the control point (event from June 25-26, 2014). Event Hour SWMM Height of water line (m) Flooding volume
(m3)*
Simulated volume (m3)**
in loco SWMM
June 25-26, 2014.
10:00 0.09 0.09 117.0 105.7
11:00 0.08 0.07 104.0 91.6
12:00 0.14 0.12 182.0 155.1
13:00 0.08 0.06 104.0 81.9
*Volume resulting from the product between the mean looding area delimited for this event (1,300 m2) and the height of the corresponding looding. **Flooding volumes simulated through the SWMM for the event in question based on the height of the corresponding looding.
Figures 9 and 10 illustrate that the event from June 25-26, 2014
(107.6 mm and Tr=2 years) presents an afluent peak low at Node 2
of 0.21 m3/s, while for the event from May 17, 2013 (150.8 mm and Tr=5 years) the maximum simulated low was 0.53 m3/s.
Aiming at verifying the consistency of the lows simulated
through the SWMM, with the hydrographs presented the previous
igures, we applied the rational method to determine the lows of
the contribution area to the control point considering a run-off
surface coeficient of 0.86, characteristic to an area of consolidated
urbanization, according to Emlurb (2014).
Table 4 indicates the results of the calculations carried out based on the rational method application considering the following aspects:
• For the event from June 25-26, 2014 (Tr=2 years), when many precipitation peaks were recorded distributed and concentrated within four-hour interval (240 min), the precipitation intensity was calculated based on this duration.
• For the event from May 17, 2013 (Tr=5 years), the precipitation intensity was calculated for the rainfall duration of 1 hour (60 min).
For the event from June 25-26, 2014, the maximum low
obtained from the simulation was of 0.21 m3/s, while with the application of the rational method, it reached a low of 0.21 m3/s.
The simulations of the event from May 17, 2013, in turn, obtained
a low of 0.53 m3/s, while the rational model rational reached
0.56 m3/s. As expected, we conclude that the rational method has a tendency to escalate the lows. From this relationship, we
may conclude that the criteria adopted for the calibration model,
carried out in a simpliied form, represent satisfactorily the conditions veriied in the ield for the occurrence of the events
considered in the study.
Scenario 02: alternative conditions
Suitability of the drainage network
The drainage system with direct inluence on the critical
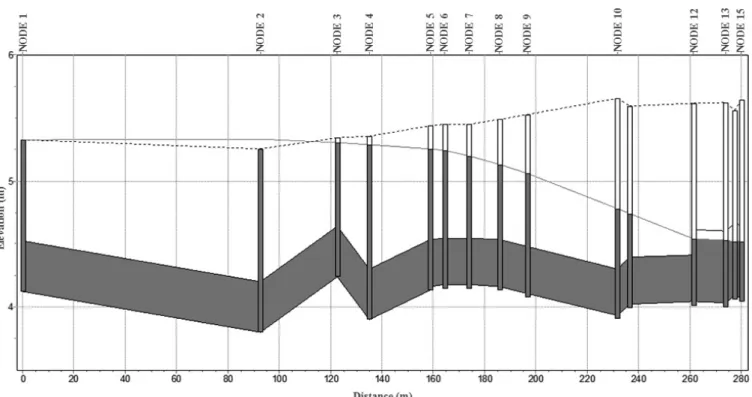
point studied, located at João de Barros Avenue up to beginning of Príncipe Street, has irregularities in its network, presenting parts with declivity problems, which interferes on the run-off
low displacement, which can be one of the causes to the looding
occurrences in the area.
The drainage network in João de Barros Avenue begins in the manhole represented in the SWMM model by Node 1 and is constituted of a gallery network with a diameter of d=0.40m along its whole extension, with an increase in diameter (d=0.60m) in the surroundings of Príncipe Street (starting at Node 12).
Figure 11 illustrates the longitudinal proile of the drainage network and the waterline located at João de Barros Avenue up to Príncipe Street, highlighting the parts with declivity opposite
to the low interfering in the run-off displacement, which can be one of the causes to the looding occurrences in the area.
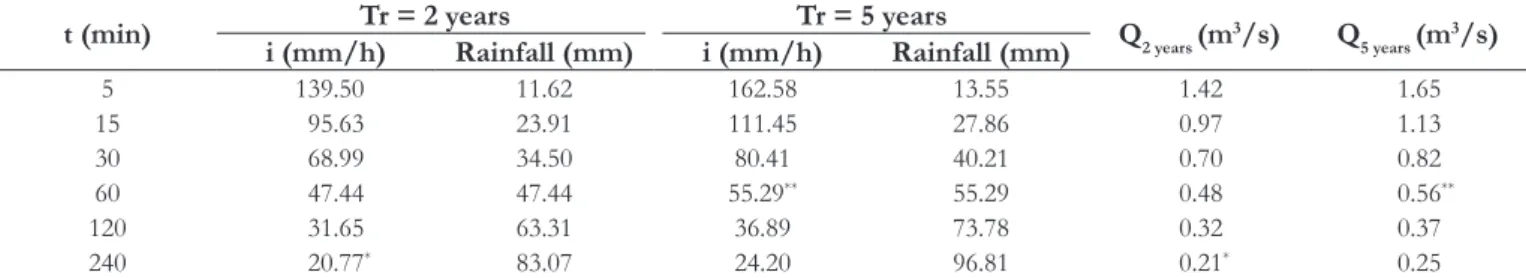
Table 4. Outlows calculated using the rational method for the two- and ive-year recurrence.
t (min) Tr = 2 years Tr = 5 years Q2 years (m3/s) Q5 years (m3/s) i (mm/h) Rainfall (mm) i (mm/h) Rainfall (mm)
5 139.50 11.62 162.58 13.55 1.42 1.65
15 95.63 23.91 111.45 27.86 0.97 1.13
30 68.99 34.50 80.41 40.21 0.70 0.82
60 47.44 47.44 55.29** 55.29 0.48 0.56**
120 31.65 63.31 36.89 73.78 0.32 0.37
240 20.77* 83.07 24.20 96.81 0.21* 0.25
*Tr: 2 years (4h duration); ** Tr: 5 years (1h duration).
Figure 9. Hydrograph from the model calibration for the event
from June 25-26, 2014.
Figure 10. Hydrograph from the model calibration for the event
Primarily, we sought to readjust the depth rates of the
manholes by consequently adjusting the declivities of the conduits.
Next, we proceeded with the alterations in the diameter of the conduits, maintaining the criteria established in the model calibration
(Manning’s rugosity coeficient and the height of the sediment
layer deposited in the conduits). According to this criterion, we carried out four readjustment alternatives for the drainage network in João de Barros Avenue, namely:
• Alternative 1 - Consisted of the readjustment of the
declivities of the drainage conduits, more speciically at
the part concentrated between the manholes represented
from Node 1 to Node 6;
• Alternative 2 - Based on the readjustment of the declivities of the conduits proposed in alternative 1, with an increase in the diameter of the gallery (d=0.60m) from the manhole
represented by Node 4;
• Alternative 3 - Deined by the rearrangement of the declivities
of the conduits between Nodes 1 and 6, in addition to the increase in the pipe diameter (d=0.60m) downstream to
the manhole represented by Node 2 (control point); and • Alternative 4 - The declivities of the conduits between
Nodes 1 and 6 were altered and the pipe diameter was increased to d=0.60m to substitute the gallery network with a diameter of d=0.40m existing at João de Barros Avenue.
Table 5 indicates the new declivities of the conduits from the adjustment of the depth rates and presents the diameters considered as well as the parts corresponding to each simulated alternative.
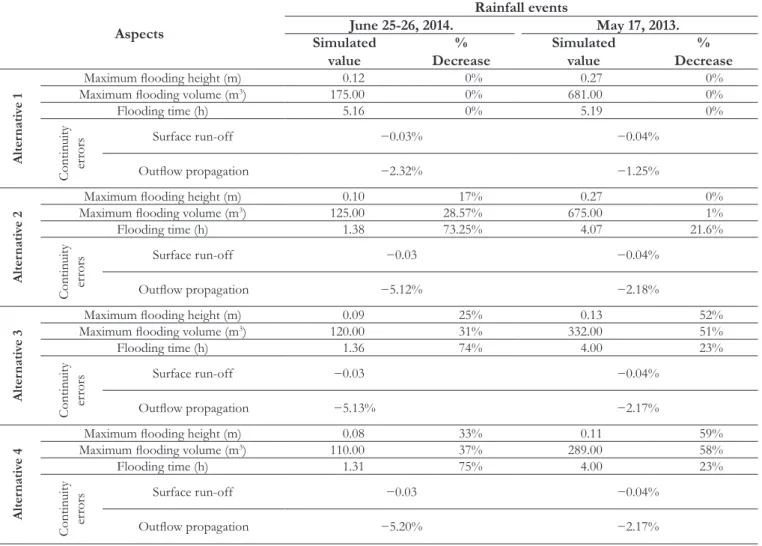
The results of the simulations of the four veriications
considered in this study are shown in Table 6, which presents
the maximum heights of the water blades of the looding, the maximum volumes and looding time for Node 2 (control point),
in addition to continuity errors found during the simulation
process of the veriications proposed for the events from June
25-26, 2014 and May 17, 2013.
With the adjustment of the drainage network in the area of
inluence on the looding point, simulated for the four veriications,
we observed that alternative 1 showed no variation in relation to the current scenario for the simulated precipitation events. Only
the readjustment of the rates proposed for this irst veriication
guaranteed favorable conditions exclusively for the run-off of the rainfall waters through the conduits, which before was hampered by the irregularities present in the network. We can conclude that by observing the continuity errors generated through the simulation
reports, deining the mass balance equation for the run-off and propagation of the lows in the conduits (PROCEL-SANEAR, 2012). In the current condition, the outlow propagation error
was of −8.57% and decreased to −2.32% for the event from June
25-26, 2014. For the event from 17 May, 2013, the error, which in
the current condition was −2.18%, decreased to −1.25%.
In alternatives 2, 3 and 4 for the event from June 25-26,
2014, the looding volumes were reduced in 28.57%, 31% and 37%, respectively. For the event from May 17, 2013, the decrease values were 1%, 51% and 58%, respectively. The adoption of such measures does not guarantee a deinite solution for the looding issues
occurred in the area studied, it is just a mitigation. Furthermore, in cases in which changes are proposed for the diameter of the
the conduits in the region downstream to the modiied system, with mean increase values in the simulated low in relation to the current scenario of 23% for the event from June 25-26, 2014 and 35% for the event from May 17, 2013.
Figure 12 illustrates the comparison between the hydrograms of the drainage network immediately downstream to the stretch with proposed interventions (represented by the conduit located between Nodes 12 and 13) considering the event from June 25-26, 2014. Table 7 presents the results indicated in the simulation report for the different simulated conditions for the same precipitation event.
Table 5. Synthesis of the declivities of the conduits and diameters corresponding to the current and alternative conditions.
Condition Span Readjustment of the declivities of the galleries
Node 1 - Node2 Node 2 - Node 3Span Node 3 - Node 4Span Node 4 - Node 5Span Node 5 - Node 6Span
Current 0.35% −1.47% 2.67% −0.99% −0.21%
Alternative 1 0.17% 0.18% 0.17% 0.17% 0.16%
Permanence of the diameter of the implemented pipe (d=0.40m)
Alternative 2 0.17% 0.18% 0.17% 0.17% 0.16%
Permanence of the diameter of the implemented pipe (d=0.40m) Increase in the pipe diameter (d=0.60m)
Alternative 3 0.29% 0.01% 0.00% 0.01% 0.00%
d=0.40m Increase in the pipe diameter (d=0.60m)
Alternative 4 0.08% 0.01% 0.00% 0.01% 0.00%
Increase in the pipe diameter (d=0.60m)
Table 6. Synthesis of the results from the simulations.
Aspects
Rainfall events
June 25-26, 2014. May 17, 2013. Simulated
value Decrease% Simulated value Decrease%
Alter
nati
ve 1
Maximum looding height (m) 0.12 0% 0.27 0%
Maximum looding volume (m3) 175.00 0% 681.00 0%
Flooding time (h) 5.16 0% 5.19 0%
Contin
uity
er
rors
Surface run-off −0.03% −0.04%
Outlow propagation −2.32% −1.25%
Alter
nati
ve 2
Maximum looding height (m) 0.10 17% 0.27 0%
Maximum looding volume (m3) 125.00 28.57% 675.00 1%
Flooding time (h) 1.38 73.25% 4.07 21.6%
Contin
uity
er
rors
Surface run-off −0.03 −0.04%
Outlow propagation −5.12% −2.18%
Alter
nati
ve 3
Maximum looding height (m) 0.09 25% 0.13 52%
Maximum looding volume (m3) 120.00 31% 332.00 51%
Flooding time (h) 1.36 74% 4.00 23%
Contin
uity
er
rors
Surface run-off −0.03 −0.04%
Outlow propagation −5.13% −2.17%
Alter
nati
ve 4
Maximum looding height (m) 0.08 33% 0.11 59%
Maximum looding volume (m3) 110.00 37% 289.00 58%
Flooding time (h) 1.31 75% 4.00 23%
Contin
uity
er
rors
Surface run-off −0.03 −0.04%
Outlow propagation −5.20% −2.17%
Table 7. Simulation report (maximum outlow in the conduit
between Nodes 12 and 13).
Scenario Maximum outlow (m3/s)
Inst. of the max. occurrence (h:min) Maximum velocity (m/s) Current condition
0.173 12:16 0.69
Detention reservoir
We considered the implementation of a detention reservoir
(on-line) along the main drainage network, more speciically in the area of inluence on the looding point. There are different
methods to estimate the detention volume, many of these are
known as simpliied. Experience has revealed that the methods based on the use of hydrodynamic models (SWMM, HECRAS,
etc.) compensate the additional effort at the dimensioning stage for
allowing lower costs and the veriication of hydraulic dimensioning
failures in the project, which would be impossible to visualize using
more simpliied methodologies (NEVES et al., 2005).
With the use of the SWMM to simulate the eficiency of
the solution proposed for the preliminary dimensioning of the
detention reservoir, we applied methods that deine the storage volume as well as the low through the rational method and continuity equation. Among the existing methods to obtain the storage volume, we decided to apply the rainfall method deined
by Baptista et al. (2005) for its lower amount of intput parameters
requiring basically only the IDF/PDF curves regarding long
periods. The method can be expressed as:
( )
max s
DH =Max.[P D,T -q .D] (1)
where DHmax is the maximum height to store (m), P(D,T) is the maximum precipitation (mm), D is the precipitation duration
(min or h), and qs is the speciic low (mm/min), given by equation:
s s a
q =Q / A (2)
where Qs is the output low (restriction) (m3/s) and A a is the
effective drainage area (m2). This area is given by A
a= AC, where
A is the basin area (m2), and C is the post-urbanization run-off coeficient. The result must be converted to mm/min to be employed in Equation 1.
The maximum volume of the reservoir is given by the
product between the maximum storage height (DHmax) and the effective drainage area (Aa).
For the input parameters to obtain the afluent low (Qs)
using the rational method regarding the rainfall intensity of the project, we adopted a recurrence time interval of 2 and 5 years (coinciding with the periods of return of the simulated precipitation events), generally used for the conception of microdrainage projects (DNIT, 2006), and the rainfall duration equal to the mean concentration time of the upstream area to the critical point studied. The rainfall intensity was obtained using the IDF
equation of Recife (EMLURB, 2014); the coeficient of the run-off adopted (C) was 0.86, peculiar to a consolidated urbanization area, according to Emlurb (2014). Table 8 shows an application
Table 8. Rainfall method: output low of the upstream area (Qs) using the rational method.
TR (years) i (mm/h) P(D,T) (mm) QS (m3/s) qs=Qs/Aa (mm/min)
Height of the discharged
water
qs.t (mm)
Storage height
P-qst (mm)
Storage volume (m3)
2 95.63 23.91 1.07 1.60 11.87 12.04 483.08
5 111.45 27.86 1.24 1.86 13.83 14.03 563.00
of the rainfall method to obtain the reservoir storage volume for the pre-stablished recurrences.
The dimensions required for the storage are restricted to
local conditions based on the width of the spaces and the depth of the existing manholes. The small rate variations limit the volume to 560 m3 and the useful inside height to 1.00 m (Figure 13).
For the conception of this solution, we adopted the readjustment of the drainage network proposed in Alternative 2, with the drainage network in the entrance of the reservoir with a diameter of d=0.40m and the exit of the reservoir through a
0.70m high sharp crested weir and oriice of 40 × 40 cm connected
to an outbound gallery with a diameter of d=0.60m (from the manhole represented by Node 4).
The determination of the weir height conceived in thin
wall without lateral contractions was deined so that the square conduit (40 × 40 cm) would work as an oriice. In addition, the deinition of the weir height was also limited to the manhole rate
located upstream to the reservoir (Node 1=5.325), assuring the discharge of the waters whenever its level inside the reservoir
reaches the quote of the weir threshold.
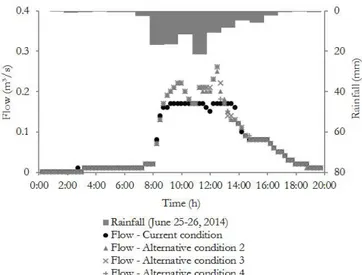
Figure 14 reveals that for the event from June 25-26, 2014 (Tr of 2 years), the dimensioned reservoir becomes satisfactory once the volume produced by the event is within its total storage
capacity with the water heights in accordance with the depth established for the reservoir. Still according to the mentioned
igure, it is possible to observe the occurrence of an overlow of
the excess water inside the reservoir through the weir considering a height of 0.70m. The discharge time was 1 hour and 15 minutes.
Figure 15, obtained for the event from May 17, 2013
(Tr of 5 years) reveals a lattening in the chart of the volumes
stored between 5h15 and 8h along two hours and 45 minutes,
providing these looding conditions of lower range in relation to
the effectively occurred. The heights of the excess waters reaches
a maximum of 17cm, with a looding volume of 425m3.
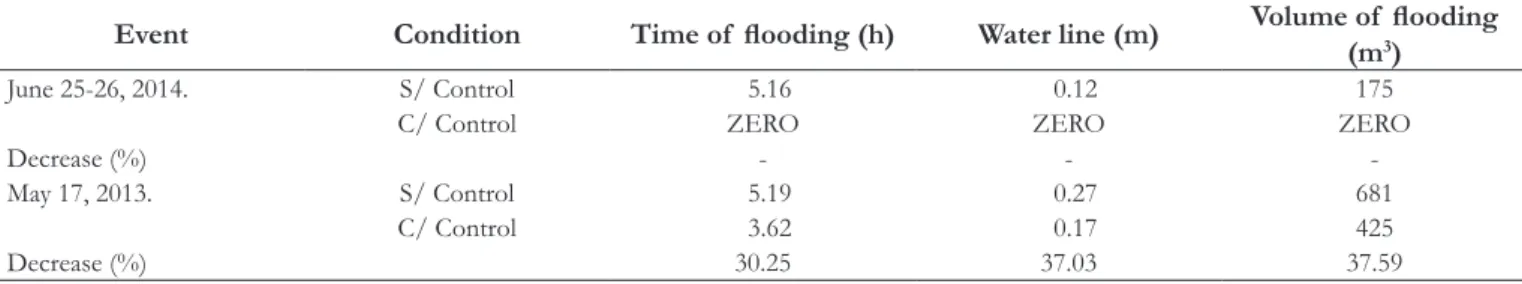
In brief, Table 9 presents a synthesis of the results obtained through the simulation of the reservoir and the current condition for the considered events indicating the decrease percentages caused by the effect of this solution. The results shown are some of the
data in the simulation report regarding the looding point studied (Node 2) for the looded time and respective looding volume.
It is possible to observe that in the control scenario a
decrease in the looding time (30.25%) occurs, the looding volume is lower, with a reduction of nearly 38%, which corroborates with the decreased peak low for events with a ive-year recurrence.
For events with a two-year recurrence, the detention reservoir proposed is satisfactory.
Table 9. Synthesis of the results from the simulations.
Event Condition Time of looding (h) Water line (m) Volume of looding (m3)
June 25-26, 2014. S/ Control 5.16 0.12 175
C/ Control ZERO ZERO ZERO
Decrease (%) - -
-May 17, 2013. S/ Control 5.19 0.27 681
C/ Control 3.62 0.17 425
Decrease (%) 30.25 37.03 37.59
Figure 14. Relationship between water height and volume in the reservoir (Event: June 25-26, 2014).
CONCLUSIONS
During the modelling, we veriied that the location presents
an unfavorable run-off condition due to the underground conduits with parts of the galleries with negative declivity. This shows that in addition to the gap in the drainage system conceived for the implementation of the urban pattern, the irregularity of the
network may be one of the causes of the recurrent looding in
the studied area.
The adjustment of the drainage network simulated in four
alternatives does not guarantee a deinite solution to the looding
issues occurred in the studied area, it is just a mitigation. This occurs in cases in which an alteration in the diameter is proposed for the
existing pipe section, we veriied an increase in the overload of the conduits in the region downstream to the modiied system, with mean increases in the simulated low in relation to the current scenario of 23% for the event from June 25-26, 2014 and 35%
for the event form May 17, 2013.
The implementation of a detention reservoir in the occurrence of the event from June 25-26, 2014 proved satisfactory.
For the event from May 17, 2013, in turn, the looding volume had a decrease of nearly 38%, presenting a looding time also shorter compared with the current condition (30.25% shorter).
REFERENCES
BAPTISTA, M.; NASCIMENTO, N.; BARRAUD, S. Técnicas compensatórias em drenagem urbana. Porto Alegre: Associação Brasileira
de Recursos Hídricos, 2005.
CANHOLI, A. P. Drenagem urbana e controle de enchentes. São Paulo: Oficina de Textos, 2005.
DECINA, T. G. T.; BRANDÃO, J. L. B. Análise de desempenho de medidas estruturais e não estruturais de controle de inundações em uma bacia urbana. Revista Engenharia Sanitária e Ambiental, v.
21, n. 1, p. 207-217, jan./mar. 2016.
DNIT – DEPARTAMENTO NACIONAL DE INFRAESTRUTURA
DE TRANSPORTES. Manual de drenagem de rodovias. Rio de Janeiro, 2006.
EMLURB – EMPRESA DE MANUTENÇÃO E LIMPEZA
URBANA. Relatório de andamento do RAP: caracterização da
Área de Influência Direta – AID. In: ABF Engenharia, Serviço e
Comércio LTDA. Estudo elaboração dos estudos de concepção para gestão e manejo de águas pluviais e drenagem urbana do Recife. Recife, 2013.
EMLURB – EMPRESA DE MANUTENÇÃO E LIMPEZA
URBANA. Manual de drenagem urbana da cidade do Recife. In: ABF Engenharia, Serviço e Comércio LTDA. Estudo elaboração dos estudos de concepção para gestão e manejo de águas pluviais e drenagem urbana do Recife. Recife, 2014.
GARCIA, J. I. B.; PAIVA, E. M. C. D. Monitoramento hidrológico
e modelagem urbana da bacia do Arroio Cancela – RS. Revista Brasileira de Recursos Hídricos, v. 11, n. 4, p. 99-108, 2006. http://
dx.doi.org/10.21168/rbrh.v11n4.p99-108.
JIANG, L.; CHEN, Y.; WANG, H. Urban flood simulation based on the SWMM model. Remote Sensing and GIS for Hydrology and Water Resources, v. 368, p. 186-191, 2015.
MIGUÉZ, M. G.; VERÓL, A. P.; MASCARENHAS, F. C. B.; SANTOS, R. B. Storage measures as compensatory techniques for urban lowlands flood control. International Journal of Sustainable Development and Planning, v. 9, n. 2, p. 225-236, 2014. http://dx.doi.
org/10.2495/SDP-V9-N2-225-236.
NEVES, M. G. F. P.; TASSI, R.; ALLASIA, D. G.; VILLANUEVA, A. O. N. Propostas de melhorias nos reservatórios para controle de cheias urbanas. In: XX Congreso Nacional del Agua y III
Simposio de Recursos Hidricos del Cono Sur, 2005, Mendoza.
Anais... Mendoza: CONAGUA, 2005.
PROCEL-SANEAR. Modelo de gestão de drenagem urbana: manual do usuário. João Pessoa: LENHS-UFPB, 2012.
SILVA, P. O.; CABRAL, J. J. S. P. Atenuação de picos de vazão em área problema: estudo comparativo de reservatórios de detenção em lote, em logradouros e em grande área da bacia. Revista Brasileira de Recursos Hídricos, v. 19, n. 2, p. 7-18, 2014. http://
dx.doi.org/10.21168/rbrh.v19n2.p7-18.
SILVA JÚNIOR, M. A. B. Alternativas compensatórias para controle de alagamentos em localidade do Recife - PE. 2015. 153 f. Dissertação (Mestrado em Engenharia Civil) - Escola Politécnica, Universidade de Pernambuco, Recife, 2015.
YANNOPOULOS, S. I.; GRIVAKI, G.; GIANNOPOULOU,
I.; BASBAS, S.; OIKONOMOU, E. K. Environmental impacts and best management of urban stormwater runoff: measures and legislative framework. Global NEST Journal, v. 15, n. 10, p. 324-332, 2013.
Authors contributions
Marcos Antonio Barbosa da Silva Junior: structuring and writing
of the article; processing of data; hydraulic-hydrological modeling;
and analysis of results.
Simone Rosa da Silva: orientation of the study; structuring and revision of the article; and discussion of the results.