www.adv-geosci.net/32/93/2012/ doi:10.5194/adgeo-32-93-2012
© Author(s) 2012. CC Attribution 3.0 License.
Geosciences
Stochastic precipitation modeling using circulation patterns to
analyze climate impact on floods
A. Belli and U. Haberlandt
Institute of Water Resources Management, Hydrology and Agricultural Hydraulic Engineering, Leibniz University Hannover, Hanover, Germany
Correspondence to:A. Belli ([email protected])
Received: 30 January 2012 – Revised: 30 September 2012 – Accepted: 4 November 2012 – Published: 20 December 2012
Abstract.This paper presents the conditioning of a precipita-tion model to objectively classified circulaprecipita-tion patterns (CP). The application of CPs is considered useful with regards to model accuracy improvement and preparation of a downscal-ing model by usdownscal-ing CPs classified with climate model data. As this study aims to produce rainfall as input for derived flood frequency analyses, the validation focuses on extreme values and precipitation events. The analysis is carried out by modifications of a well tested alternating renewal precipita-tion model.
1 Introduction
Extreme value statistics of floods are of key importance in climate impact analyses. Changes in floods cannot directly be derived from climate models. Therefore it is necessary to obtain long time series of future high resolution precipitation data as input for rainfall-runoff models.
Different downscaling methods were developed to utilize climate model data on a local scale. First there are dynami-cal downsdynami-caling methods, which use regional climate mod-els (RCM) to obtain regional data which is consistent to the large scale data gained from the general circulation models (GCM). An alternative are statistical downscaling methods, which use statistical relations between regional data and se-lected parameters of the GCMs to access changes on a local scale.
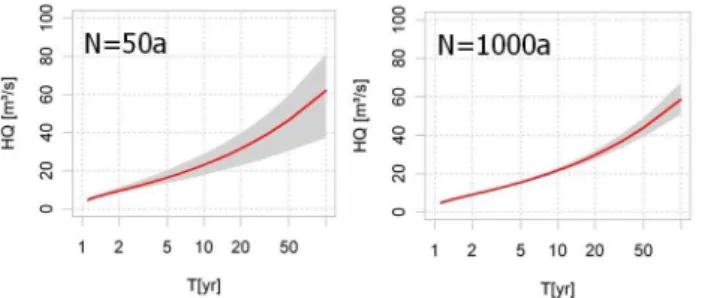
For climate impact analyses focusing on floods in mesoscale catchments some features are of major interest. The precipitation data must be available in a high tempo-ral resolution (e.g. hourly) and for a long time period. A long time period is necessary to minimize the sampling error.
This effect is shown in Fig. 1 which compares confidence intervals of a bootstrap of different sample sizes of simu-lated discharge values. A larger sample produces a signifi-cantly smaller confidence band and, hence, the uncertainties are minimized.
This is where we see the main disadvantages of existing models. In northern Germany the major RCM is the REMO model (see e.g. Jacob and Podzun, 1997). This model has a comparably short time series output and only few realizations are available. Although different statistical downscaling data sets are available, e.g. WETTREG (Spekat et al., 2007) or STAR (Werner and Gerstengarbe, 1997), most of these con-centrate on a daily time step, which is insufficient for flood modeling.
Therefore alternatives are desirable which feature long simulation periods and high resolution data. Here a precip-itation model is proposed with parameters conditioned to special GCM predictors. This model has to be tested to de-liver usable flood model input data. The hybrid precipitation-model according to Haberlandt et al. (2008) was chosen to be the basis of the new downscaling approach. The model parameters will be estimated related to circulation patterns (CP). As CPs can be obtained using climate model pressure data as input for an objective CP-classification (see B´ardossy et al., 2002) a downscaling is thus possible. Nevertheless re-cent research concluded that merely of CPs is not sufficient to accomplish a downscaling. This is shortly discussed in the conclusions chapter and will hopefully be addressed in a later article.
Fig. 1.90 % bootstrap confidence band of simulated flood values (resampled 1000 times) using different sample sizes.
2 Methods
The precipitation model creates synthetic data on the points of observed precipitation. For hydrological use it is possi-ble to regionalize the model to places without observations. This is not discussed in this paper though. The model consists of two separate parts. First part of the model is a statistical precipitation generator consisting of an alternating-renewal-model (ARM) to simulate rainfall for single points. Second part is an optimization algorithm which reproduces the spa-tial dependencies of the synthetic data with a simulated an-nealing resampling (SA).
2.1 First part: Alternating-Renewal-Processes-Model (univariate)
The ARM differentiates between external and internal struc-tures. The methods core is the external part which defines rainfall as events (Fig. 2). These events are sub divided into wet spells and dry spells. The wet spells are defined through length (wsd) and mean intensity (wsi). They are illustrated as red empty boxes. The dry spells are only defined by length (dsd).
In the synthesis the spells (wsd + wsi and dsd) are gener-ated alternately with theoretical distribution functions (Ta-ble 1). The fitting is accomplished with l-moments. In order to choose the best fitting distribution function several good-ness of fit tests and graphical analyses were carried out. In this study other distribution found to be best fitting than in Haberlandt et al. (2008), which is plausible as Haberlandt et al. (2008) focused on low mountain range, while this study considers stations from the coastal area (0 m a.m.s.l.) up to mountainous areas (609 m a.m.s.l.). The dependency of wsd and wsi is considered with a copula function. Copulas allow considering dependencies of the two variables, while using univarite distribution functions. The internal structure of the precipitation events is reproduced with statistical model pro-files (see Haberlandt, 1998). In Fig. 2 they are shown as grey filled boxes. To consider the differences in summer and win-ter rainfall different paramewin-ter sets are used for each of the two seasons.
Table 1.Methods used in the ARM.
Variable Method
dsd Kappa distribution
wsd generalized Pareto distributions
wsi generalized Pareto distributions
wsd-wsi dependency Franks Copula
Fig. 2.Alternating Renewal Model (wsd-wet spell duration, dsd-dry spell duration, wsi-wet spell intensity).
2.2 Second part: Simulated Annealing
Second part of the model is a simulated annealing algo-rithm (SA). This non-linear optimization method is used to reproduce the spatio-temporal dependencies in synthetic rainfall data. For more information on the algorithm see B´ardossy (1998). The principal of the algorithm is:
1. calculation of the objective function for the original sta-tus of the time series;
2. two events are switched;
3. calculation of the objective function for the new status of the time series;
4. decision about the acceptance of the switch according to the SA (worsening of the objective function is al-lowed to a certain degree, so the global optimum can be found);
5. repetition of the procedure until the objective function is minimal.
The elements of the objective function are shown in the Ap-pendix. The single parts are added together to a single objec-tive function with the use of weights. A detailed discussion can be found in Haberlandt et al. (2008).
Table 2.Percentage deviation between observed and simulated statistical moments with and without using CPs as mean values over all stations (Var-Variance; Skew-Skewness, Kurt-Kurtosis); grey indicates an improved and dark grey a reduced accuracy through using CPs; light grey indicates when no changes occurred.
Season Version Mean (dsd) Var (dsd) Skew(dsd) Kurt(dsd) Mean(wsd) Var(wsd) Skew(wsd) Kurt(wsd)
Winter no CP 1 4 9 25 1 5 21 57
with CP 2 5 5 17 0 5 13 10
Summer no CP 1 5 15 38 1 5 25 68
with CP 2 6 16 40 1 4 11 30
Year no CP 1 4 12 28 1 5 19 45
with CP 2 5 13 31 0 4 12 27
Season Version Mean(wsi) Var(wsi) Skew(wsi) Kurt(wsi) Mean(wsa) Var(wsa) Skew(wsa) Kurt(wsa)
Winter no CP 2 9 20 47 2 20 81 461
with CP 1 6 14 33 0 8 56 251
Summer no CP 1 11 40 148 3 70 122 529
with CP 1 10 43 163 2 58 108 463
Year no CP 1 9 37 132 2 46 126 582
with CP 1 8 39 147 1 37 108 500
2.3 Circulation pattern
Circulation patterns (CP) can be defined using the mean pres-sure distribution on sea level or in the middle troposphere over a large area and a time period of several days (Werner and Gerstengarbe, 2010). There are two principles to define CPs. It can be either classified by experts or by means of an objective classification. The other one is to use an ob-jective classification. Here the fuzzy rule based method of B´ardossy et al. (2002) is used to realize an objective classi-fication, where the applied method has two advantages. First it is possible to define the objective function in a way which is especially fitted to the hydrological purpose. Secondly the automatic classification allows fast processing of hundreds of years of data using reanalysis or GCM data as input. Thus the model is usable to project future CPs in a daily solution. As pressure data of a very large area (in this case Europe plus outskirts) is necessary NCAR reanalysis data (Kistler et al., 2001) is used for the CP classification. For climate pro-jections ECHAM GCM data (Roeckner et al., 2003) will be used in the classification of CPs for current and future cli-mate in the following studies.
Under the assumption that change in precipitation is caused by change in the CP frequency it is possible to com-bine the precipitation model with the CP prognosis to form a downscaling model. For the ARM the conditioning to CPs is simply done by using a specific parameter set (see Sect. 2.1) for each CP. The frequency of the CPs is calculated from the empirical probability distribution. In the SA algorithm the se-quence and synchrony of the CPs are considered via adjust-ing the objective function. For the first station the temporal sequence and for all other stations the synchrony of the CPs had to be included. This study was carried out with 8 CPs.
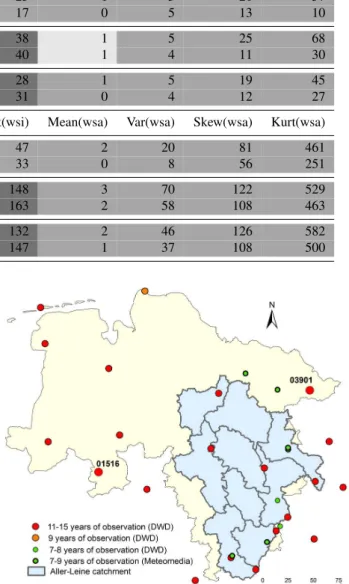
Fig. 3.Study Area Lower Saxony (Niedersachsen) and precipitation network with two stations indicated for extreme value comparison (see. Fig. 5); the station shown in Fig. 5 marked with slightly bigger points than the other stations.
3 Study area and data
Fig. 4.Scatter-plots of statistical moments of observed (9–15 yr) vs. synthetic (1000 yr, CP-conditioned model) rainfall time series.
at least 11 overlapping years has been selected. This core set consists only of data from the German Meteorological Ser-vice (DWD). The extended data set also considers 9 stations with a length of 7–9 yr and data from the Meteomedia AG.
4 Analyses and results
First step was to fit the precipitation model without CPs to the new study area. Afterwards, the results of the original ARM were compared to the CP-conditioned model results. For the validation statistical rainfall characteristics and extreme val-ues were considered.
Figure 4 compares observed short term and synthetic 1000 yr precipitation data of the model conditioned to CPs. The statistical properties of the events are overall satisfy-ingly reproduced. Only the dsd’s moments are slightly derestimated in the synthesis. As a result of the dsd’s un-derestimation the mean yearly event number is overesti-mated. Combined with the correctly modeled average wet spell amounts, the overestimation of the number of wet spells leads to a slight overestimation of the mean yearly precipita-tion. Changing the dsd’s distribution function may solve this issue.
Table 2 shows the comparison of statistical parameters of the synthetic precipitation data modeled with and without CPs. The results are indifferent as the accuracy of the repro-duction of some parameters is improved, while reduced for others. Nevertheless, more than half of the parameters are im-proving and the changes in the improved parameters are more significant (higher delta) than those in the parameters that get
Fig. 5.Extreme values, 10 synthetic time series (100 yr) vs. obser-vation (9–15 yr).
reproduced less accurate. Thus we can conclude that overall the use of CPs lead to an improvement in the reproduction of rainfall time series. Only the accuracy of the estimation of the dsd values has been slightly reduced. The synthesis of wsd and wsa (wet spell amount) is significantly improved by including CPs. For the variable wsi the lower order statisti-cal moments are modeled slightly better and the higher order moments slightly less accurate.
3-hourly extremes are simulated significantly better, as visi-ble in the example given in the figure. This visual observation was confirmed by statistical tests. So overall the reproduction of extreme values in the synthetic data could be improved by using CPs.
The results of the simulated annealing resampling are not measurably affected by considering CPs.
5 Conclusions
In this paper a precipitation model was fitted to circulation patterns. This is the first step towards a stochastic downscal-ing of high resolution precipitation with projected CPs. The conditioned model was compared to the original version. The CPs were classified using reanalysis data. Through the con-ditioning of the precipitation model an improvement of per-formance in respect of reproduction of statistical parameters and extreme values was achieved.
An analysis carried out by Haberlandt et al. (2011) found that not only the occurrence frequency of the CPs will change in the future but also their internal structure. This means that e.g. a wet CP can get wetter or dryer. Therefore the condi-tioning of a precipitation model to CPs alone is not sufficient for downscaling. The internal changes of the CPs have to be addressed too. For this reason a simple statistic-dynamic ap-proach will be developed.
Appendix A
Elements of the simulated annealing objective function
Probability of bivariate occurrence:
Pij zi >0|zj>0=
n11
(n01+n10+n11+n00)
,
nxy– number of intervals with rain in stationxandy; 1: rain-ing 0: not rainrain-ing;zx – precipitation at stationX. Bivariate correlation:
ρij=
cov zi, zj p
var(zi)·var(zj)
zi>0, zj>0.
Bivariate continuity:
Cij=
E zi|zi>0, zj=0
E zi|zi>0, zj>0
E(...)−expected value,
see Wilks (1998).
Acknowledgements. This work was realized with financial support of the Ministry of Science and Culture of Lower Saxony within the climate impact and adaptation research in Lower Saxony (KLIFF) project. The authors thank the DWD and Meteomedia GmbH for the meteorological observation data.
Edited by: K. Schneider and S. Achleitner Reviewed by: two anonymous referees
References
B´ardossy, A.: Generating precipitation time series using simulated annealing, Water Resour. Res., 34, 1737–1744, 1998.
B´ardossy, A., Stehl´ık, J., and Caspary, H.-J.: Automated objective classification of daily circulation patterns for precipitation and temperature downscaling based on optimized fuzzy rules, Clim. Res., 23, 11–22, 2002.
Haberlandt, U.: Stochastic rainfall synthesis using regionalized model parameters, J. Hydrol. Eng., 3, 160–168, 1998.
Haberlandt, U., Ebner von Eschenbach, A.-D., and Buchwald, I.: A space-time hybrid hourly rainfall model for derived flood frequency analysis, Hydrol. Earth Syst. Sci., 12, 1353–1367, doi:10.5194/hess-12-1353-2008, 2008.
Haberlandt, U., Belli, A., and B´ardossy, A.: Eignung von Großwet-terlagen als Pr¨amisse f¨ur das statistische Niederschlagsdownscal-ing, in: Forum f¨ur Hydrologie und Wasserbewirtschaftung, Tag der Hydrologie Wien, 2011, Heft 30.11, 136–143, 2011. Jacob, D. and Podzun, R.: Sensitivity Studies with the Regional
Cli-mate Model REMO, Meteorol. Atmos. Phys., 63, 119–129, 1997. Kistler, R., Kalnay, E., Collins, W., Saha, S., White, G., Woollen, J., Chelliah, M., Ebisuzaki, W., Kanamitsu, M., Kousky, V., Dool, H. V. D., Jenne, R., and Fiorino, M.: The NCEP-NCAR 50-Year Reanalysis: monthly means CD-ROM and documentation, B. Am. Meteorol. Soc., 82, 247–267, 2001.
Roeckner, E., B¨auml, G., Bonaventura, L., Brokopf, R., Esch, M., Giorgetta, M., Hagemann, S., Kornblueh, L., Schlese, U., Schulzweida, U., Kirchner, I., Manzini, E., Rhodin, A., and Tompkins, A.: The atmospheric general circulation model ECHAM5 Max-Planck-Institut f¨ur Meteorologie, Hamburg 140, 2003.
Spekat, A., Enke, W., and Kreienkamp, F.: Neuentwicklung von regional hoch aufgel¨osten Wetterlagen f¨ur Deutschland und Bereitstellung regionaler Klimaszenarios auf der Basis von globalen Klimasimulationen mit dem Regionalisierungsmod-ell Wettreg auf der Basis von globalen Klimasimulationen mit ECHAM5/MPI-OM T63L31 2010 bis 2100 f¨ur die SRESSzenar-ios B1, A1B und A2, 1–149, 2007.
Werner, P. C. and Gerstengarbe, F.-W.: Proposal for the develop-ment of climate scenarios, Clim. Res., 8, 171–182, 1997. Werner, P. C. and Gerstengarbe, F.-W.: Katalog der
Großwetter-lagen Europas (1881–2009) nach Paul Hess und Helmut Bre-zowsky, 7. verbesserte und erg¨anzte Auflage PIK Report, 119, 146 pp., 2010.