Ecl. Quím., São Paulo, 35(1): 7 - 18, 2010 18
Artigo
Article www.scielo.br/eq
Volume 35, número 1, 2010
19 Artigo/Article
mAtHemAtiCAL equAtion CorreCtion to
SPeCtrAL AnD trAnSPort interFerenCeS
in HigH-reSoLution Continuum SourCe
FLAme AtomiC ABSorPtion SPeCtrometrY:
DeterminAtion oF LeAD in PHoSPHoriC ACiD
Jorge Luiz Raposo Jra, Silvana Ruella de Oliveiraa, Joaquim Araújo Nóbregab, José Anchieta Gomes Netoa*
a
São Paulo State university - unesp, Analytical Chemistry Department P.O. Box 355, 14801-970 Araraquara - SP, Brazil
universidade Federal de São Carlos, Departamento de Química, 13560-970 São Carlos - SP, Brazil
Abstract: In this work, a new mathematical equation correction approach for overcoming spec-tral and transport interferences was proposed. The proposal was applied to eliminate specspec-tral interference caused by PO molecules at the 217.0005 nm Pb line, and the transport interfe-rence caused by variations in phosphoric acid concentrations. Correction may be necessary at 217.0005 nm to account for the contribution of PO, since Atotal217.0005 nm = A
Pb
217.0005 nm + A
PO
217.0005 nm. This may be easily done by measuring other PO wavelengths (e.g. 217.0458 nm)
and calculating the relative contribution of PO absorbance (APO) to the total absorbance (Atotal) at 217.0005 nm: A Pb217.0005 nm = A
total
217.0005 nm - A PO
217.0005 nm = A total
217.0005 nm - k (A PO
217.0458 nm). The
correction factor k is calculated from slopes of calibration curves built up for phosphorous (P) standard solutions measured at 217.0005 and 217.0458 nm, i.e. k = (slope217.0005 nm/slope217.0458 nm). For wavelength integrated absorbance of 3 pixels, sample aspiration rate of 5.0 ml min-1,
analytical curves in the 0.1 – 1.0 mg L-1 Pb range with linearity better than 0.9990 were con-sistently obtained. Calibration curves for P at 217.0005 and 217.0458 nm with linearity better than 0.998 were obtained. Relative standard deviations (RSD) of measurements (n = 12) in the range of 1.4 – 4.3% and 2.0 – 6.0% without and with mathematical equation correction appro-ach were obtained respectively. The limit of detection calculated to analytical line at 217.0005 nm was 10 µg L-1 Pb. Recoveries for Pb spikes were in the 97.5 – 100% and 105 – 230% inter-vals with and without mathematical equation correction approach, respectively.
Keywords: mathematical equation correction approach; high-resolution continuum source lame atomic
spectrometry; lead, phosphoric acid
introduction
Among many factors affecting the
determi-nation of lead (Pb) in phosphoric acid by lame
atomic absorption spectrometry spectral and
trans-port interferences are considered the more impor-tant ones [1], since the analytical line at 217.0005 nm overlaps with PO molecular absorption bands
at 216.99 nm in the air-acetylene lame [2], the
alternate line at 283.3060 nm is recommended
references
[1] Reimer, M. and Howard. M. J. Am. Chem. Soc. 50 (1928) 2506.
[2] Kobelnik, M.; Schnitzler, E.; Ionashiro, M. J. Therm. Anal. Cal. 91 (2008) 891.
[3] Fernandes, N. S.; Carvalho Filho, M. A. S.; Mélios, C. B.; Ionashiro, M. J. Therm. Anal. Cal. 59 (2000) 663.
[4] Fernandes, N. S.; Carvalho Filho, M. A. S.; Mélios, C. B.; Ionashiro, M. J. Therm. Anal. Cal 73 (2003) 307.
[5] N. S. Fernandes, S. A. Araujo, M. Ionashiro, Ecl. Quím. 31(2) (2006) 39.
[6] Fernandes, N. S.; Carvalho Filho, M. A. S.; Mendes, R. A.; Mélios, C. B.; Ionashiro, M. J. Therm. Anal. Cal. 76 (2004) 193.
[7] A. B. Siqueira, C. T. de Carvalho, E. C. Rodrigues, E. Y. Ionashiro, G. Bannach, M. Ionashiro, Ecl. Quím 32(4) (2007) 49-54.
[8] Ionashiro, E. Y.; Fertonani, F. L.; Mélios, C. B.; Ionashiro, M. J. Therm. Anal. Cal. 79 (2005) 299.
[9] Bannach, G.; Schnitzler, E.; Mélios, C. B.; Ionashiro, M. Ecl. Quim. 29 (2004) 31.
[10] Souza JL, Kobelnik M, Ribeiro CA, Capela JMV. Kinet- Kinet-ics study of crystallization of PHB in presence of hydrociac-ids. J. Therm. Anal. Cal. 97 (2009) 525.
[11] Flynn, J. H.; Wall, J. Nat. Bur. Stand. 70A (1966) 487. [12] Ozawa, T. Bull. Chem. Soc. Jpn. 38 (1965) 1881. [13] Ozawa, T. J. Therm. Anal. 2 (1970) 301.
[14] Chen, D.; Gao, X.; Dollimore, D. A. Thermochim. Acta 215 (1993) 109.
[15] Málek, J. Criado, J. M., Sestak, J., Militky, J. Thermo-chim. Acta 153 (1989) 429.
[16] Vyazovkin, S.; Wight, C. A. Int. Rev. Phys. Chem. 17 (1998) 407.
[17] Flynn, J.H.; Wall, L. A. J. Polymer Sci., Pt. B., 4 (1966) 323.
[18] C.D. Doyle, J. Appl. Polymer Sci. 5 (1961) 285.
Abstract: Divalent metal complexes of ligand 2-methoxybenzylidenepyruvate with Fe, Co, Ni, Cu and Zn as well as sodium salt were synthesized and investigated in the solid state. TG curves of these compounds were obtained with masses sample of 1 and 5mg under nitrogen atmosphere. Different heating rates were used to characterize and study these compounds from the kinetic point of view. The activation energy and pre-exponential factor were obtained ap-plying the Wall-Flynn-Ozawa method to the TG curves. The obtained data were evaluated and the values of activation energy (Ea / kJ mol-1) was plotted in function of the conversion degree (α). The results show that due to mass sample, different activation energies were obtained. The results are discussed mainly taking into account the linear dependence between the activation energy and the pre exponential factor, where was verified the effect of kinetic compensation (KCE) and possible linear relations between the dehydrations steps of these compounds.
Keywords: bivalent metal ions, 2-methoxybenzylidenepyruvate, non-isothermal kinetics, dehydration
[19] Kobelnik, M.; Bernabé, G. A.; Ribeiro, C. A.; Capela, J. M. V.; Fertonani, F. L. J. Therm. Anal. Calorim. 97 (2009) 493.
[20] Galwey A. K.; Brown M. E. Thermal Decompositions of ionic Solids. 1th ed. Amsterdan: Elsevier; 1999.
[21] Galwey A. K. Thermochim. Acta. 2004,413,139. [22] Prasad, T. P.; Kanungo, S. B.; Ray, H. S. Thermochim. Acta. 2002,203,503.
[23] N. Koga, J. Sestak. J. Therm. Anal. 37 (1991) 1103. [24] N. Koga. Thermochim. Acta 244 (1994) 1. [25] J. Zsakó. J. Therm. Anal. Cal. 47 (1996) 1679.
[26] J. G. R. Poço; H., Furlan; R., Giudici. Journal Physical Chemical B 106 (2002) 4873.
Ecl. Quím., São Paulo, 35(1): 19 - 24, 2010 20
Artigo Article
Ecl. Quím., São Paulo, 35(1): 19 - 24, 2010 21
Artigo Article
[3,4]. However both main and secondary lines for Pb are interfered if variations in phosphoric acid concentrations occur, changing the aspiration rate of the nebulizer.
Correction of spectroscopy interferences by mathematical equations in inductively coupled plasma mass spectrometry (ICP-MS) technique has already been established [5,6]. Nevertheless the adaptation of such mathematical equations to atomic absorption spectrometry for spectral inter-ference correction was not feasible due to the lack of a truly simultaneous multi-element system. Recently and upon the introduction of a high-resolution continuum source atomic absorption spectrometry (HR-CS AAS) [7], this problem has been overcome as the whole spectral environment around the analytical line can be acquired [8,9]. Using this technique, the interference caused by PO molecules at the main line for Pb at 217.0005 nm may be eliminated using the least-squares background correction (LSBC) [1]. The alterna-te line at 283.3060 nm is unaffecalterna-ted by PO, but both main and secondary lines are interfered by transport effects. A method using the LSBC plus internal standardization was recently proposed to minimize these interferences in the determination of Pb in phosphoric acid by HR-CS FAAS [1].
In this paper, a new approach to overcome spectral and transport interferences associated with the determination of Pb in phosphoric acid by HR-CS FAAS has been proposed. In princi-ple, spectral overlap can be corrected providing that another wavelength of the interfering element is itself free from interference. The feasibility of using mathematical equation correction pre-viously employed in ICP-MS, to eliminate spec-tral interference caused by PO molecules at the 217.0005 nm Pb line and transport interference caused by variations in phosphoric acid concen-trations in the determination of Pb in phosphoric acid has been investigated.
materials and methods
instrumentation
All measurements were carried out using an Analytik Jena ContrAA 300 high-resolution
continuum source lame atomic absorption spec -trometer equipped with a xenon short-arc lamp XBO 301 [10] with a nominal power of 300 W operating in a hot-spot mode as a continuum ra-diation source. This new equipment presents a compact high-resolution double-Echelle grating monochromator correspondent to a spectral band width < 2 pm per pixel in the far ultraviolet range and a charge-coupled device (CCD) array detec-tor.
High-purity (99.7%) acetylene (Air Liquid, Brazil) was used as fuel gas. Air-acetylene
oxi-dizing lame was used for analyte atomization.
Solutions were directly aspirated by the burner / nebulizer system of the spectrometer using an injection module (SFS 6) enabling the computer-controlled aspiration of blanks, analytical solu-tions and samples.
Reagents, analytical solutions and samples
High purity de-ionized water (resistivity 18.2 MΩ cm) obtained using a Millipore Rios 5® reverse osmosis and a Millipore Milli-Q Acade-mic® deionizer system (Bedford, MA, USA), and Merck Suprapur® nitric acid (Darmstadt, Ger-many) were used throughout to prepare all solu-tions. All chemical reagents used were of analyti-cal grade.
Reference solutions containing 0.10, 0.20, 0.40, 0.80 and 1.00 mg L-1 Pb were daily prepared by appropriate dilution of the 1000 mg L-1 single stock standard solutions (Normex TM, Carlo Erba, Italy)
and acidiied to 1% (v/v) with HNO3.
Working standard solutions containing 1.0, 2.5, 5.0 and 7.5% (m/v) H3PO4 were prepared by dissolving 1.18, 2.48, 5.88 and 8.82 g of analytical reagent grade phosphoric acid 85% (Mallinckrodt, Xalostoc, Mexico) in 1% (v/v) solution. Blank so-lution was prepared containing only HNO3in 1% (v/v).
Test solutions containing 100 or 400 μg L-1 Pb in presence of 1.0, 5.0 and 7.5% (m/v) H3PO4 were used to illustrate the interference effects and the effectiveness of the proposed approach. These solutions were prepared by appropriate dilution of the Pb stock standard solution and concentrated phosphoric acid in 1% (v/v) HNO3.
Measurement procedure
The measurement procedure is relative-ly simple. The absorbance for blank [1% (v/v) HNO3), reference standards [0.10 - 1.00 mg L-1 Pb in 1% (v/v) HNO3] and phosphoric acid sample solutions were measured at the main line for Pb at 217.0005 nm. The absorbance of interfering spe-cies (PO) must be measured in the interfering and non-interfering wavelengths: in the present work, absorbances for all phosphoric acid working stan-dard solutions [1.0 - 7.5% (m/v) H3PO4] were measured at 217.0005 nm and 217.0458 nm. At 5.0 mL min-1 of aspiration low rate, fuel/oxidi -zing ratio 0.126, 6 mm of burner height and wa-velength-selected absorbance equivalent to 3 pi-xels, the equipment was adjusted under optimum conditions. All measurements were carried out in triplicates.
results and discussion
Spectral and transport interferences on Pb:
qualitative and quantitative data
Spectral interferences caused by phos-phoric acid on Pb determination at the main line 217.0005 nm are due to the PO molecular absorp-tion bands at 216.99 nm formed in the
air-acetyle-ne lame. This spectral interference was evaluated
by calculating the apparent Pb concentration at the main line for Pb at 217.0005 nm for different phosphoric acid solutions. When the acid con-centration was varied from 0% to 7.5 (m/v), the apparent Pb concentration varied from 0 to around
300 μg L-1, as well as the sample low-rate reduced from 5.0 to 4.0 ml min-1. In earlier work, it was
de-monstrated that the LSBC technique is an eficient
tool to eliminate spectral interference caused by PO on Pb determination, but this correction tech-nique did not avoid the transport effects caused by variations in phosphoric acid concentrations [1].
Determination of the correction factor for
mathematical equation
If PO interfering molecule can be measured at a different wavelength free of any interference (and this is feasible in HR-CS FAAS), the correc-tion factor can be calculated from the ratio of slo-pes of analytical curves for phosphoric acid built up at interfering (217.0005 nm) and non-interfe-ring (217.0458 nm) wavelengths and the absor-bance at this last wavelength. The total absorban-ce (A total) measured at 217.0005 nm corresponds to the contribution of Pb plus PO, so that: A total217.0005 nm = A
Pb
217.0005 nm + A PO
217.0005 nm Eq. (1)
To obtain the net absorbance for Pb, the PO absorbance must be subtracted from the total ab-sorbance at 217.0005 nm:
APb217.0005 nm = A total
217.0005 nm - A PO
217.0005 nm Eq. (2)
If absorbance of pure phosphoric acid stan-dard solutions at the interfering (217.0005 nm) and non-interfering (217.0458 nm) wavelengths are measured, it is possible to estimate the APO217.0005 nm by the application of Beer’s Law [11] in both
situations as bellow: APO217.0005 nm = A
PO
217.0458 nm (slope 217.0005 nm/slope 217.0458 nm) Eq. (3)
So, the term (slope 217.0005 nm/slope 217.0458 nm). APO217.0458 nm is the correction factor to be applied in Eq. (2) to obtain only the net absorbance for Pb: A Pb217.0005 nm = A
total
217.0005 nm - (slope 217.0005 nm / slope 217.0458 nm). A
PO
217.0458 nm Eq. (4)
For wavelength integrated absorbance equivalent to 3 pixels, aspiration rate of the
ne-bulizer ixed initially at 5.0 ml min-1, analytical curves in the 0.1 – 1.0 mg L-1 Pb concentration range was always attained with linearity better than 0.9990. Calibration curves for phosphoric acid (PO) at 217.0005 and 217.0458 nm presented plots within the 1.0 – 7.5% H3PO4 with linear
coe-ficient better than 0.9980. Alternate wavelengths
were tested for PO at 216.9020 nm, 216.9940 nm and 217.0458 nm, but only the last one furnished
Ecl. Quím., São Paulo, 35(1): 19 - 24, 2010 22
Artigo Article
Ecl. Quím., São Paulo, 35(1): 19 - 24, 2010 23
Artigo Article
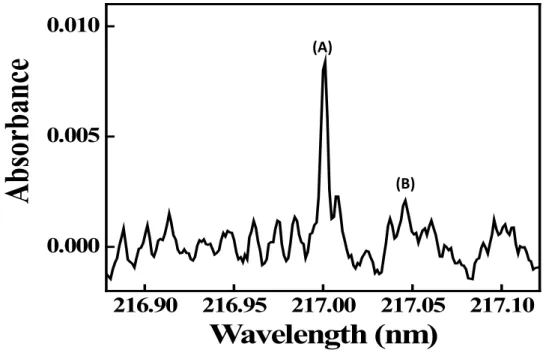
Additionally, it should be stressed that the line for PO at 217.0458 nm is within the spectral window for Pb at 217.0005 nm (Figure 1). The ratio between slopes of curves for PO (slope 217.0005 nm/slope 217.0458 nm) was calculated daily taking into consideration that changes in the operating parameters alter the mea-sured absorbance. However, ratios obtained in different days were usually within 1.23 – 1.29, but were
not signiicantly different at the 95% conidence level (paired t-test).
(A)
(B)
216.90
216.95
217.00
217.05
217.10
0.000
0.005
0.010
Absorbance
Wavelength (nm)
Figure 1. Spectrum recording for spiked Pb in phosphoric acid. (A) and (B) correspond to lines at 217.0005
nm and 217.0458 nm, respectively.
Analysis of test solutions and samples
The feasibility of the mathematical correc-tion for spectral and transport interferences was
veriied in the determination of Pb in test solu -tions and two phosphoric acid samples (Table 1). Results for samples were in agreement at a 95%
conidence level (paired t-test) with those obtai-ned by HR-CS FAAS using LSBC plus internal standardization. Precision and accuracy studies were also carried out using test solutions, or else, recovery experiments for diluted [1% – 7.5% (m/v)] phosphoric acid samples spiked with 100
and 400 μg L-1 Pb.
If no correction method is applied, the concentrations of Pb found were in the 140 – 230
μg L-1 and 420 – 480 μg L-1 intervals for spiked
samples with 100 and 400 μg L-1 Pb, respecti-vely. These results showed severe spectral inter-ference caused by PO affected measurements at 217.0005 nm causing a positive interference much more pronounced than the interference caused by the transport effect. On the other hand, when the mathematical equation approach was employed, the found concentrations of Pb were close to Pb spikes (recoveries in the 97.5 – 100% range), su-ggesting the usefulness of the proposal to elimi-nate spectral and transport interference. Relative standard deviations of measurements varied from 1.4 to 4.3% and 2.0 to 6.0% (n = 12) without and
with mathematical equation correction approach, respectively. The limit of detection calculated to analytical line at 217.0005 nm was 10 µg L-1 Pb.
table 1 Comparative results for Pb (n = 3) in commercial phosphoric acid samples and spiked Pb in test
solu-tions (mean ± standard deviation) determined by HR-CS FAAS at atomic line 217.0005 nm with and without mathematical equation approach.
Samples [Pb], µg L
-1
Without correction Proposed technique
Phosphoric acid
1 94.4 ±
3.5 51.2 ± 2.9
2 91.2 ±
4.2 49.8 ± 3.2
Test solutions
1.0% (m/v) H3PO4 + 100 µg L-1 140 ± 2 100 ± 2
5.0% (m/v) H3PO4 + 100 µg L-1 200 ± 7 100 ± 5
7.5% (m/v) H3PO4 + 100 µg L-1 230 ± 9 100 ± 6
1.0% (m/v) H3PO4 + 400 µg L-1 420 ± 13 400 ± 13
5.0% (m/v) H3PO4 + 400 µg L-1 440 ± 19 390 ± 19
7.5% (m/v) H3PO4 + 400 µg L-1 480 ± 18 390 ± 19
Conclusions
The accurate determination of Pb in high P
content samples such as phosphoric acid by lame AAS requires an eficient method of interference
correction. The alternate line for Pb at 283.3060 nm is usually recommended for the analyte deter-mination free of PO interference, but it is inter-fered by transport effects. With the mathematical equation approach proposed, the main line for Pb
at 217.0005 nm was eficiently employed for this
analytical task. The mathematical equation cor-The mathematical equation cor-rection approach is obviously not limited to the analyte and sample selected in this work.
Additional studies with others elements and samples are necessary to corroborate the general
application in lame AAS.
Acknowledgements
Authors would like to thank the Fundação de Amparo à Pesquisa do Estado de São Paulo for
inancially supporting this work and for the fello -wship to S.R.O. The authors are also grateful to Coordenação de Pessoal de Ensino Superior and the Conselho Nacional de Desenvolvimento
Cien-tíico e Tecnológico for fellowships to J.L.R.J.,
Ecl. Quím., São Paulo, 35(1): 19 - 24, 2010 24
Artigo
Article www.scielo.br/eq
Volume 35, número 1, 2010
25
resumo: Um método de correção de interferência espectral e de transporte é proposto, e foi aplicado para minimizar interferências por moléculas de PO produzidas em chama ar-acetileno e de transporte causada pela variação da concentração de ácido fosfórico. Átomos de Pb e moléculas de PO absorvem a 217,0005 nm, então Atotal217,0005 nm = A
Pb
217,0005 nm + A PO
217,0005 nm. Monitorando o comprimento de onda alternativo de PO em 217,0458 nm, é possível calcular a contribuição relativa de PO na absorbância total a 217,0005 nm: APb217,0005 nm = A
total
217,0005 nm - A
PO
217,0005 nm = A total
217,0005 nm - k (A PO
217,0458 nm). O fator de correção k é a razão entre os coeficientes angulares de duas curvas analíticas para P obtidas a 217,0005 e 217,0458 nm (k = b217,0005 nm/ b217,0458 nm). Fixando-se a taxa de aspiração da amostra em 5,0 ml min-1, e integrando-se a absor-bância no comprimento de onda a 3 pixels, curvas analíticas para Pb (0,1 - 1,0 mg L-1) foram obtidas com coeficientes de correlação típicos ≥ 0,9990. As correlações lineares entre absor-bância e concentração de P nos comprimentos de onda 217,0005 e 217,0458 foram ≥ 0,998. O limite de detecção de Pb foi 10 µg L-1. O método de correção proposto forneceu desvios padrão relativos (n=12) de 2,0 a 6,0%, ligeiramente menores que os obtidos sem correção (1,4-4,3%). As recuperações de Pb adicionado às amostras de ácido fosfórico variaram de 97,5 a 100% (com correção pelo método proposto) e de 105 a 230% (sem correção).
Palavras-chave: método de correção por equação matemática; espectrometria de absorção atômica com fonte contínua e de alta resolução; chumbo; ácido fosfórico.
Artigo/Article
PHoto-Fenton ProCeSS For treAting
BioLogiCAL LABorAtorY WASteWAter
ContAining FormALDeHYDe
Janaína Conrado L. Fonsecaa, Raquel F. Pupo Nogueirab, Mary Rosa Rodrigues Marchib*
a UNESP Waste Management Program, UNESP – Univ Estadual Paulista Rectory Ofice, 01049-010, São Paulo – SP, Brazil
b institute of Chemistry, uNESP – univ Estadual Paulista, P.O.Box 355, 14800-900, Araraquara - SP, Brazil.
*Corresponding author. Phone: +55-16-3301-6610. Fax: +55-16-3301 6692; e-mail address: [email protected]
Abstract: Laboratories consume great amounts of hazardous chemicals substances and con-sequently generate wastewater containing them, for example formaldehyde. This substance is widely utilized to preserve biological samples generating many liters of this residue every year. The present work proposes the use of the photo-Fenton process to treat formaldehyde wastewater using sunlight irradiation. Some aspects were investigated such as the iron source, sample and hydrogen peroxide concentration and also the use of stirred systems. The use of ferrioxalate (0.5 mmol L-1) improved the efficiency of the process in relation to the use of iron nitrate, while at least 1.0 mol L-1 H2O2 is necessary to treat the sample of the 500 mg C L-1. Under these conditions, every formaldehyde detectable was degradeted and 89% of the dissolved organic carbon was removed in two hours of exposure to sunlight. These results are satisfaction considerate for São Paulo State Environmental Agency.
Keywords: laboratory wastewater treatment, formaldehyde, photo-Fenton
introduction
A large number of biological laboratories use solutions of formaldehyde to preserve anato-mic pieces, generating many liters of formaldehy-de waste every year. In according to the literature formaldehyde is genotoxic in exposed cells in vi-tro or exposed tissues in vivo [1,2,3]
Although the concentration of formaldehy-de is just 3.7% w/w, discharging formalformaldehy-dehyformaldehy-de without treatment can cause serious damage from aquatic environment, due to its carcinogenicity [4] and there is no safe limit to exposition for this class (carcinogenic). Hence, these wastes require an appropriate treatment to avoid risks to the envi-ronment and human health.
The adequate treatment of wastes generated by industrial, agricultural or domestic activities is regulated by environmental agencies throughout
the world, [5,6] which the levels of speciic pa -rameters are limited and checked in the dischar-ged wastes. This is necessary due to large volu-mes of toxic generated wastes and consequently to the impacts that this cause. The formaldehyde, for example, is able to react with DNA, RNA and proteins, damaging cells and causing the death of microorganisms present in biological wastewater treatment plants [7,8].
Furthermore, the residues generated by Universities and Research Centers offers a special
challenge: present speciic treatments of different
wastes. The ideal solution would be an in situ
treatment of these wastes, avoiding storage and
references
[1] J.L. Raposo Jr, S.R. Oliveira, J.A. Nóbrega, J.A. Gomes Neto, Spectrochim. Acta Part B 63 (2008) 992.
[2] PLASUS Ingenieurbüro, Plasus Specline, Version 2.13, Königsbrun, Germany, 2005.
[3] Y. Y. Zong, P. J. Parsons, W. Slavin, Spectrochim. Acta, Part B 49 (1994) 1667.
[4] J.B. Willis, B.T. Sturman, J. Anal. At. Spectrom. 19 (2004) 706.
[5] S. M. Nelms, Inductively Coupled Plasma Mass Spectro-metry Handbook, first ed., Wiley-Blackwell, 2005.
[6] F. Laborda, M. P. Górriz, E. Bolea, J. R. Castillo, Spectro-chim. Acta Part B 61 (2006) 433.
[7] B. Welz, H. Becker-Ross, S. Florek, U. Heitmann, High-Resolution Continuum Source AAS: The Better Way to Do Atomic Absorption Spectrometry, first ed.,Wiley-VCH, Wein-heim, 2005.
[8] B.Welz, Anal. Bioanal. Chem. 381 (2005) 69.
[9] B. Welz, H. Becker-Ross, S. Florek, U. Heitmann, M.G.R. Vale, J. Braz. Chem. Soc. 14 (2003) 220.
[10] M.D. Huang, H. Becker-Ross, S. Florek, U. Heitmann, M. Okruss, J. Anal. At. Spectrom. 21 (2006) 338.
[11] D. H. Harris, Quantitative Chemical Analysis, seventh ed., W. H. Freeman and Company, New York, 2007.