to r. u fc. b r 1984-2201
Copyright © 2002, Universidade Federal do Ceará
ACCESSIBILITY INDEX ELABORATION BY
NETWORK GEOSPATIAL ANALYSIS
(*) CORRESPONDING AUTHOR
Address: PUC-MG, Rua Espírito Santo, 1059, Centro, Belo Horizonte - MG, Brasil. CEP 30160-922. Tel: (+55 21) 23340454 E-mail: [email protected]
ABSTRACT
The objective of this study is, by means of geoprocessing techniques, to prepare an accessibility index and
use it to evaluate the suitability of the public transport network ofered to the various regions and social
classes present in the metropolitan area of Rio de Janeiro (RMRJ). This study starts from the premise that there is a socio-spatial segregation, which is unlikely to change. Thus, the proposed accessibility index
aims to assess the quality of the public transport structure ofered regarding its connectivity to diferent locations and jobs as well as the ease (or diiculty) of access to diferent public transport modes. The
results indicate that the public transport system i is inefective as an instrument for overcoming socio
--spatial segregation, as there is a tendency for individuals with lower incomes to occupy areas with the lowest level on the proposed accessibility index. This tendency can be explained by the higher quality of public transport in the central regions and the increased value of areas with a better supply of transport, even in peripheral areas.
Keywords: Public transport; Accessibility; Geoprocessing.
RESUMO/ RESUMEN
ELABORAÇÃO DE ÍNDICE DE ACESSIBILIDADE A PARTIR ANÁLISE GEOESPACIAL EM REDE
Há o intento, por meio de técnicas de geoprocessamento, de elaborar um índice de acessibilidade e, através do mesmo, avaliar a adequação da rede de transporte público ofertada para as diversas regiões e classes sociais presentes na região metropolitana do Rio de Janeiro (RMRJ). Parte-se da premissa de que há uma segregação socioespacial, dessa forma o índice de acessibilidade proposto tem como objetivo avaliar a qualidade da estrutura de transporte público ofertado no que se refere à conectividade a diferentes
localidades e empregos, além da facilidade (ou diiculdade) de acesso a diferentes modos de viagem em transporte público. Os resultados obtidos demonstraram que o sistema de transporte público é ineiciente
como instrumento para a superação da segregação socioespacial, pois há uma tendência de indivíduos com menores rendas ocuparem áreas com menor nível do índice de acessibilidade proposto. Tal tendência pode ser explicada pela maior qualidade do transporte público nas regiões centrais e pela valorização de
regiões com oferta qualiicada de transporte, mesmo em regiões periféricas.
Palavras-chave: Transporte Público; Acessibilidade; Geoprocessamento..
PREPARACIÓN DE UN INDICE DE ACCESIBILIDAD CON EL APOYO DE ANÁLISIS GEO-ESPACIAL EN RED
El objetivo de este estudio es, a través de técnicas de Geoprocesamiento, proponer un índice de accesibilidad y, a través de él, evaluar la adecuación de la red de transporte público ofertada a las distintas regiones y clases sociales presentes en la Región Metropolitana do Río de Janeiro (RMRJ, siglas en portugués). Este
estudio partió de la premisa de que existe una segregación socio-espacial, que difícilmente será modiicada,
por lo que el índice de accesibilidad propuesta tiene como objetivo evaluar la calidad de la estructura de transporte público ofertado con respecto a la conectividad a diferentes lugares y locales de trabajo, además
de la facilidad (o diicultad) de acceso a los diferentes modos de transporte en el transporte público. Los resultados obtenidos demuestran que el sistema de transporte público es ineiciente como instrumento para la
superación de la segregación socio-espacial, ya que hay una tendencia a que las personas con ingresos más bajos ocupen áreas con niveles más bajos del índice de accesibilidad propuesto. Esta tendencia puede ser explicada por el hecho de que la mayor calidad del transporte público se encuentra en las regiones centrales
y por la valorización de regiones con oferta caliicada de transporte, incluso en las regiones periféricas.
Palabras clave: Transporte Público; Accessibilidad; Geoprocessamiento.
GIRÃO, Raphael e Silva;a * PEREIRA, Willian Alberto de Aquino;b FERNANDES, Pedro José Farias c
(a) MSc in Geology, Federal University of Rio de Janeiro (UFRJ). http://lattes.cnpq.br/7586926592488207
(b) MSc in Geology, Federal University of Rio de Janeiro (UFRJ). Sinergia Estudos e Projetos - SINERGIA LTDA. (c) MSc in Remote Sensing . Instituto Nacional de Pesquisas Espaciais (INPE). http://lattes.cnpq.br/2280138386356775
A rti cl e h is tor y: Re ce ive
d 04 M
arc
h, 2017
A
cc
ept
ed 1
w
w
w
.me
rca
to
INTRODUCTION
According to Echenique (1975), the urban spatial structure is the result of two
interdepen-dent processes allocating objects and activities in certain places, processes that occur at diferent
times, because activities change faster than physical objects. Therefore, the urban spatial structure
comprises both physical and functional structures, interacting with each other, creating lows and
movements, allowing the emergence of new structures and making urban space an extremely dyna-mic system (FRANCE, 2004). In this way, transport has a primordial function in the organization and structuring of urban space, being one of the variables that guide the allocation of objects and activities in this space.
The existence or not of a quality transport network inluences the way urban space is appro -priated, its functionality and which agents occupy it. In view of this, transport plays an increasingly important role in the attribution of value to urban space, since with the increasing urbanization of the population and the growth of cities accessibility has become an important factor for the citizen’s quality of life. In this context, according to Vasconcellos (1996), the uncontrolled growth of large cities has led to socioeconomic segregation, so that the poorest sectors have been displa-ced to peripheral areas, generally characterized by fewer opportunities and higher costs related to displacement., which means a loss of quality of life for this part of the population. In cities
in developing countries there is a signiicant disadvantage of access to workplaces by low-income
groups. These disadvantages are caused by the cost of housing in areas where there is a
concentra-tion of jobs or the ofer of qualiied access to them, which leads individuals from low-income social
classes to occupy suburbs where the quality and supply of transport systems are inadequate. The unfavorable conditions of accessibility to low-income workplaces in cities in developing countries are a consequence of a historical process in which the dynamics of urban development were / are shaped by speculations in the real estate market, associated with public planning policies that did not contemplate social equity (SILVA, 2011).
The need to attenuate such social and spatial inequalities is imperative. In this sense, Rosa (2006) emphasizes the importance of public transport as one of the tools to overcome this problem,
facilitating the access of segregated classes to a greater number of job ofers and other services /
activities present in the most central areas of urban space. Therefore, it is also necessary to develop
tools that facilitate the assessment of the transportation network on ofer and serve as a guideline
for planning.
One of the most pertinent ways to evaluate the suitability of a transport network is to analyze
the accessibility that such a network ofers to the diferent regions and social classes present in the
urban space. According to Goto (2000), the study of accessibility has great importance for urban planning, because it is an instrument to identify areas with inequalities in the provision of basic transportation infrastructure, which, according to Vasconcellos (2000), makes this theme of study directly related to the citizens’ quality of life.
There is a great diversity of concepts that deine accessibility, developed by diferent authors:
Hansen (1959); Ingram (1971); Vieckman (1974); Koeing (1980); Gutierrez and Urban (1996); Vas-concellos (1996); Almeida and Gonçalves (2002); Kim and Hewings (2003); Sanches and Ferreira
(2003); Santos et al. (2004); Castro (2010). One of the pioneering deinitions of accessibility is by
Hansen (1959). For this author, accessibility is the potential for opportunities of spatial interaction, that is, it is a measure of the spatial distribution of activities in relation to a point, adjusted to the ability and desire of people or businesses to overcome spatial separation. Ingram (1971), for example,
deines accessibility as an inherent characteristic of a place in relation to overcoming some form of
spatial friction. In turn, Kim and Hewings (2003) conceptualize accessibility as a facility in spatial
integration or the potential for contact between the diferent region’s activities.
Each concept of accessibility diverges in terms of how the theme should be studied and the
to
r.
u
fc.
b
r
adopted, in which accessibility is understood as the ease of movement between places, so that the more the travel cost (in terms of the general cost of travel) between two places decreases, the more accessibility increases, as long as the attraction of the location is maintained. Thus, accessibility is what measures the ease of access of individuals to workplaces, leisure, study, and public facilities,
among others, and is related both to land use and the coniguration of the transportation system
(RAIA JR et al. ., 1997).
In the present study accessibility has been divided further into two complementary concepts: accessibility to transport facilities, which refers to the ease of access to facilities such as bus stops, train stations, subway stations, etc.. Secondly, accessibility to destinations, which refers to how
easy it is to reach a particular location or diferent destinations, from a departure point.
One way to assess accessibility is to quantify it using indicators. In addition to several con-cepts, there are also a number of indicators to measure and classify accessibility: Lee and Goulias (1997) divide accessibility indicators into: (i) simple separation measures; (ii) measurements of
the gravitational type; and (iii) isochronic measurements. Raia Jr. (2000) proposes a classiication
divided into: (i) indicators of the attribute type of networks; (ii) indicators of the spatial separation type; (iii) travel-type indicators; (iv) supply-type indicators of the transport system; (v) indicators using aggregate data combining aspects of transport and land use; and (vi) indicators that use disa-ggregated data that combine aspects of transport and land use. Geurs and Wee (2004) propose the
classiication of accessibility indicators by: (i) infrastructure measurements; (ii) site-based measu -rements; (iii) accessibility measurements based on the individual; and (iv) measurements based on
utility. Finally, Curtis and Scheurer (2010) suggest a classiication as follows: (i) measurements of
spatial separation; (ii) contour measurements; (iii) gravitational measurements; (iv) competition measurements; (v) time-space measurements; (vi) measurements based on utility; and (vii) network measurements.
Thus, it is evident that the great diversity of indicators varies according to the purpose and approach of the study; Kwan (1998) writes that each proposal to quantify accessibility only covers
a part of what it represents. So, the diferent measurements of accessibility complement each other,
describing how individuals behave in relation to the spatial distribution of activities, travel destina-tions and the characteristics of the transport system. This range of indicators can be combined into an accessibility index, which according to Saisana et al. (2005) makes it possible to aggregate a greater amount of information into a single measure that is easier to interpret and more sophistica-ted. An index allows complex measurements to be summarized, helping to simplify questions and
classiications, but may result in overly simplistic conclusions, which makes it important never to
lose sight of the indicators that originated it.
Therefore, the objective of this study is to elaborate an accessibility index using geoprocessing
techniques, and use it to evaluate the adequacy of the public transportation network ofered to the diferent regions and social classes found in the Metropolitan Region of the state of Rio de Janeiro.
The purpose of this index is to serve as a tool for public authorities in the planning of a collective transportation network with the objective of overcoming socio-spatial inequalities, by employing a combination of simple acquisition indicators.
STUDY AREA
w
w
w
.me
rca
to
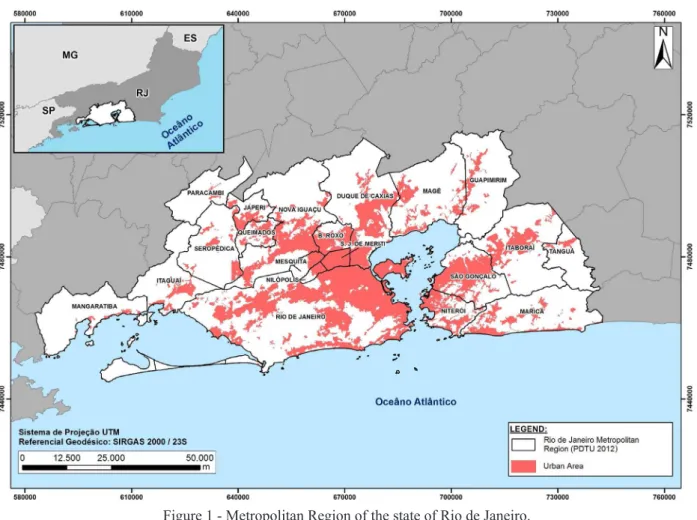
Mesquita, Niteroi, Niterói, Nova Iguaçu, Paracambi, Queimados, Rio de Janeiro, São Gonçalo, São João de Meriti, Seropédica and Tanguá (Figure 1).
Figure 1 - Metropolitan Region of the state of Rio de Janeiro.
The study area has a population of about 11,820,000 inhabitants and an area of approximately 5,680 km². The occupation process in the RMRJ is similar to the process that has occurred in other Brazilian metropolitan regions: a permanent low-density horizontal expansion, focused on road transport, where, in most cases, urban expansion has not been accompanied by a structural network of high-capacity public transport (BARANDIER, 2012). Since the 1980s it has been observed that
in the RMRJ there has been an intensiication in the process of occupation of the peripheries and
urban conurbation, encouraged by housing policies. Road investments, coupled with the
capilla-rity of the bus system and the growing leet of cars, have resulted in a larger urban sprawl and the
consequent freeing up of land use to structural accessibility through high capacity collective modes (PDTU, 2012).
This process of urban expansion, unaccompanied by a high-capacity structural transport network and combined with the rising prices of urban land due to real estate speculation, mainly
afected low-income social classes that were pushed out to peripheral regions.
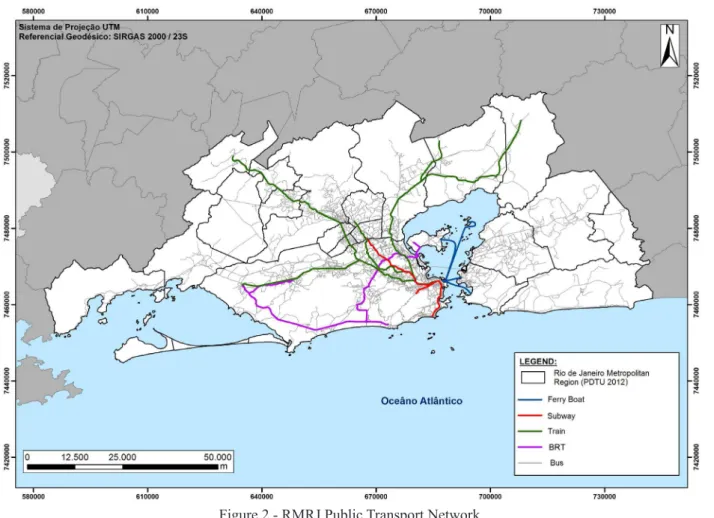
Currently, RMRJ has ive basic regulated public transport systems: Metro, Train, Ferries,
BRTs and Buses (Figure 2). The subway network is composed of two lines with 35 stations, all located in the city of Rio de Janeiro, and 39 compositions with a capacity of up to 1,800
passen-gers per composition. The train network has eight diferent branches with 99 stations, located in
to
r.
u
fc.
b
r
Figure 2 - RMRJ Public Transport Network.
It is worth mentioning that since 2009, the Government of the State of Rio de Janeiro has
implemented a single tarif system that allows intermodal integration with the payment of a single tarif throughout the RMRJ (PDTU, 2012).
MATERIALS AND METHODS
ELABORATION OF AN ACCESSIBILITY INDEX
In the elaboration of an accessibility index, the choice of indicators that will compose this
index is an essential step. Accessibility can be facilitated or hampered by diferent temporal, spatial, economic or socioeconomic factors (SILVA, 2011). Thus, the irst step in choosing the indicators
used is to clearly delimit which part of the comprehensive concept of accessibility will be measured.
Essentially, the present study aims to measure the accessibility ofered by the public transport
network. Taking into account that socio-spatial segregation is a fait accompli in most Brazilian metropolitan regions, it is intended, through an accessibility index, to evaluate the adequacy of public transport in contributing to overcoming this segregation. Thus, in the elaboration of the
proposed index, the factor of distance between diferent localities had no relevance, but instead the
connectivity between these places and how this connection is made.
In other words, the study started from the premise that there is socio-spatial segregation, where low-income social classes are pushed out to peripheral areas. Since these individuals occupy the most peripheral regions, the proposed accessibility index aims to evaluate the quality of the public
transport structure ofered to them in terms of connectivity to diferent locations and jobs, as well as the ease (or diiculty) of access to diferent modes of travel by public transport. Next, the use
w
w
w
.me
rca
to
• Spatial coverage of the various modes of public transport ofered;
• Connectivity to diferent locations by the various means of public transport ofered; • Connectivity to job posts by the various ways of public transport ofered;
It is important to emphasize that the proposed index does not cover economic factors such as
tarif value, since the single tarif system implemented in RMRJ allows diferent integrations and journeys for the same tarif value. Finally, it is important to note that an important premise in the
elaboration of the accessibility index is that each mode of transport has a degree of importance in facilitating displacements according to their capacity and speed.
Indicator 1 - Spatial ofer and coverage of the various modes of public transport travel ofered The irst indicator selected to compose the proposed accessibility index aims to measure the spatial range of the diferent public transport modes on ofer. This indicator assumes that the greater the spatial range of the diferent modes of travel being ofered to a particular locality and how easy
it is to reach these modes in that locality, the greater the accessibility.
Thus, the calculation of indicator 1 consists of the sum of the results of the multiplications between the coverage ratio of each mode of travel / total area of a given location and the weight assigned to the respective modal:
Equation I
�1=∑ (�����
���� ��)
�
�=1
Where:
I1: Indicator 1;
����� : Area of coverage of each mode of travel in a given location; ����: Total area of the respective location;
Wm: Weight assigned to each travel mode; k: Number of travel modes.
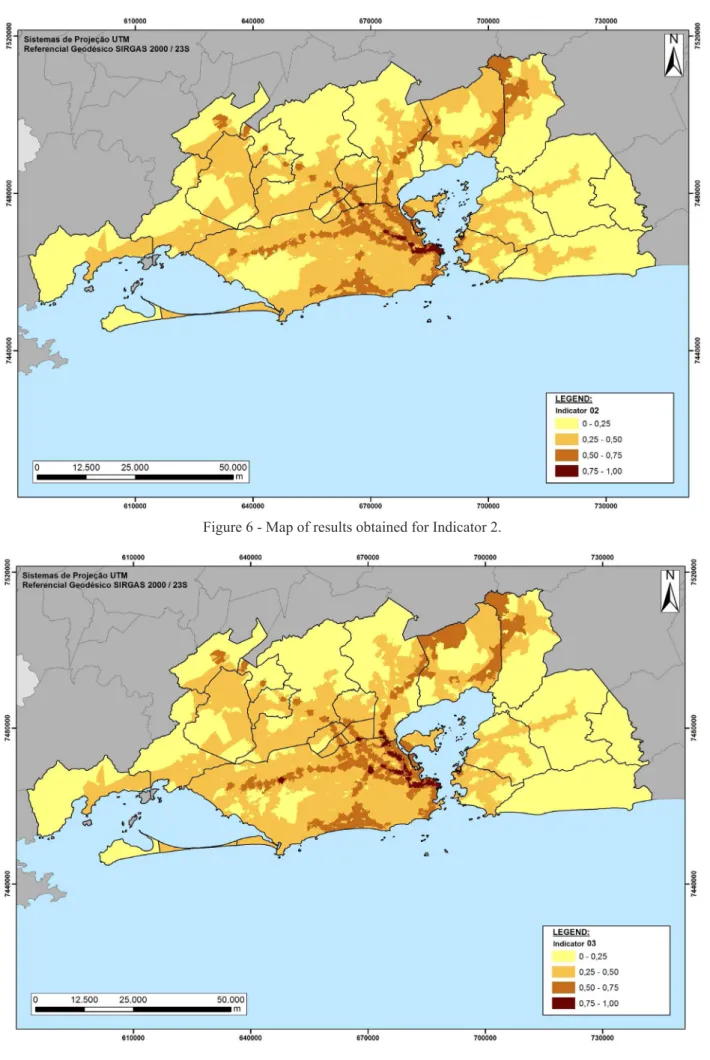
Indicator 2 - Connectivity to diferent locations through the various public transport modes ofered
The second indicator selected to compose the proposed accessibility index measures the
con-nectivity to diferent locations ofered by the diferent modes of travel to a given location, that is, the objective is to quantify the number of locations with which a speciic location is connected by diferent modes on a journey. This indicator assumes that, from a given location, the greater the number of destinations reached by diferent modes of travel, the greater the access to various parts
of the study area, the greater the accessibility.
Thus, the calculation of indicator 2 consists of the sum of the products of the multiplications between the numbers of destinations reached by a given location through each mode of travel and the weight assigned to the respective modal:
Equation II
�2=∑(���×��)
�
�=1
Where:
to
r.
u
fc.
b
r
��� : Number of destinations reachable by each mode of travel from a given location;
Wm: Weight assigned to each mode of travel; k: Number of travel modes.
Indicator 3 - Connectivity to job posts through the various modes of public transport travel ofered
The third indicator selected to compose the proposed accessibility index aims to measure the
connectivity to job posts ofered by the various modes of travel to a given location. In this way, the objective is to express the number of job posts that a speciic place can reach using the dife -rent modes of travel. This indicator assumes that the greater the number of job posts reachable by
diferent modes of travel, from any location, the greater the possibility of the individuals from that
locality occupying these positions and the easier their locomotion to their jobs, the more accessi-bility increases.
Therefore, the calculation of indicator 3 consists of the sum of the products of the
multiplica-tions between the job posts reachable by a speciic location by means of each mode of travel and
the weight assigned to the respective mode:
Equation III
�3=∑(���×��)
�
�=1
Where: I
3: Indicator 3;
��� : Number of jobs reachable by each mode of travel from a particular location; Wm: Weight assigned to each mode of travel;
k: Number of travel modes.
Weight Assigned to Each Travel Mode (Wm)
As already mentioned, an important premise in the elaboration of the proposed accessibility index is that each mode of transport has a degree of importance in facilitating displacements accor-ding to their capacity and speed. Thus, for each modal, a weight was calculated to be used in the calculation of the indicators, a weight was also calculated for each mode of integration between buses and other modes.
For the calculation of the weight for each mode of public transportation, the criteria used to assign greater or lesser weight refer to the capacity and speed of each modal, thus the following equation was used:
Equation IV
����=(
�� ����
+ ��
����)
÷ 2
Where:
���� : Weight assigned to the modal (without integration);
C
m: Modal average capacity;
Cmax: Medium capacity of the largest capacity modality; Vm: Average speed of the modal;
w
w
w
.me
rca
to
In order to calculate the weight of each mode of integration between buses and other modals, the arithmetic average between the weight assigned to the bus modal and the weight assigned to the respective integration modal was used, as shown in the following equation:
Equation V
����� =(
����+����
2 )
Where:
����� : Weight attributed to the mode of integration between buses and other modals;
���� : Weight assigned to modal bus; ����: Weight assigned to integration modal.
Indicators Normalization
All the indicators were normalized with the objective of making them compatible with the same interval, varying on a scale of 0 to 1. This normalization is done from the following equation:
Equation VI
��=( � − ����
����− ����)
Where:
Xn: Normalized value; X: Value to be normalized;
Xmin: Lower value of the referent indicator; Xmax: Higher value of the referent indicator.
Index Composition
The composition of the accessibility index took into account that accessibility can be divided into two complementary concepts, as already mentioned: accessibility to transport facilities and
ac-cessibility to destinations, with indicator 1 referring to the irst and indicators 2 and 3 to the second.
Thus, the index composition was based on the sum of the product between each indicator and its weight, which was attributed considering that the accessibility to the transport facilities and the accessibility to the destinations have equal weights in the index composition, therefore the indicator
1 is assigned the full weight of the irst and the indicators 2 and 3 divide the weight of the second:
Equation VII
IA= (I1×0,5) + (I2×0,25) + (I3×0,25)
Where:
IA: Accessibility Index; I
to
r.
u
fc.
b
r
ACCESSIBILITY INDEX CALCULATION
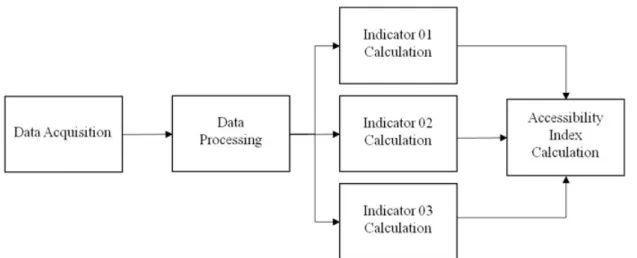
The methodology to calculate the proposed accessibility index can be divided into four main steps: data acquisition; treatment and processing of data; calculation of the indicators; accessibility index calculation (Figure 3). It is important to highlight that the standard spatial unit used in this study corresponds to the census tracts of the 2010 Census / IBGE.
Figure 3 – Main steps lowchart of the accessibility index calculation.
Data Acquisition
The present study proposes the use of easily acquired data, so that the accessibility index
calcu-lation does not demand great resources. Thus, georeferenced public data (in the shapeile format) and
alphanumeric data (in the xlsx format) available at the state and federal levels were used (Table 1):
Table 1 - Data used in the present study
Data Type Information Source
Georeferenced Data
Census Sectors Censo - IBGE 2010
Transport Network (Bus, Subway,
Train, Ferry Boat e BRT). PDTU - 2012
Road Network PDTU - 2012
Traic Zone PDTU - 2012
Alphanumeric Data
Population
(Census Sectors)
Censo - IBGE 2010
Per Capita Income
(Census Sectors)
Censo - IBGE 2010
Jobs (Traic Zone) PDTU - 2012
Treatment and Data Processing
The irst step of the data treatment and processing was the conversion of the georeferenced
data to the same geodetic reference and projection system to avoid compatibility errors in future spatial analysis. Thus, all the georeferenced data were converted to the SIRGAS 2000 geodetic reference and to the UTM projection system.
Secondly, the alphanumeric data were related to their respective georeferenced data through
w
w
w
.me
rca
to
attribute the population and the per capita income of each sector, just as the shapeile of the traic
zones began to have the jobs in each zone as an attribute.
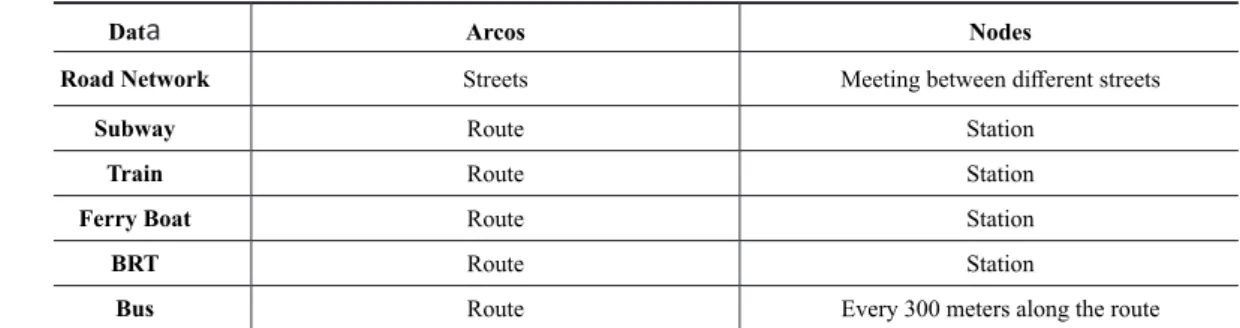
Finally, the road network and the transport network were processed in the GIS to generate a single network. According to Câmara et al. (2001), in geoprocessing, the concept of network de-notes the information associated with: utility services (water, electricity and telephone), drainage (river basins), highways and so on. In the case of networks, each geographical object (e.g. telephone cable, subway station, water pipe) has an exact geographical location and is always associated with descriptive attributes present in the database. Network graphical information is stored in vector coordinates, with arc-node topology, that is, network topology is a graph, which stores information
about resources that low between diferent geographic locations. For the present study, the network was conigured as follows (Table 2):
Table 2 - Network coniguration of the present study:
Data Arcos Nodes
Road Network Streets Meeting between diferent streets
Subway Route Station
Train Route Station
Ferry Boat Route Station
BRT Route Station
Bus Route Every 300 meters along the route
Calculationb of Indicators
a) Area covered by each mode of travel and the deinition of the weights (Wm) used to calculate indicators
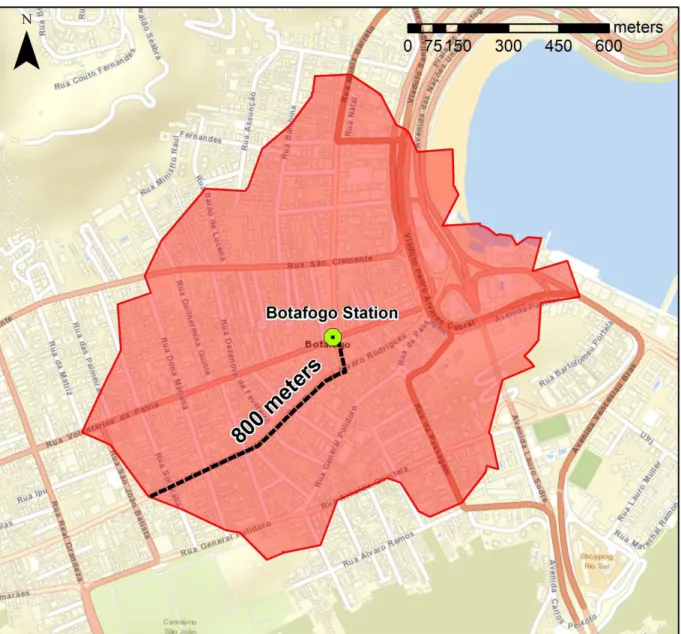
The delimitation of the area covered by each mode of travel was performed through network analysis and is fundamental to calculate the indicators, because the scope of each mode determines which areas they meet. For the BRT, subway, train and boat modalities the walking distance of 800 meters, in which the user traverses the existing routes from their origin to the stations (Figure 4), was considered as a limit. In the case of the bus modal, the maximum walking distance of 500 meters was considered for the bus stops, which were allocated every 300 meters along the routes of the lines.
The coverage area was also important to identify the lines of each integration mode. In this way, the lines included in the coverage area of a particular modal station, were considered lines of integration with it. In addition, when the coverage area of the line covers another line’s bus stops, they were considered to be integrated.
In order to deine the weight of each modal (����) it was necessary, irstly, to deine its ave
-rage capacity and speed. These data were determined according to the information provided by the concessionaires responsible for each mode, with the exception of the average speed of the bus modal, determined from the historical average speed of the main routes of the study area according to the Google Maps application (between 7hrs and 9hrs). Thus, the data used and the results of the
to
r.
u
fc.
b
r
Figure 4 - Coverage area of Botafogo subway station
Table 3 - Data used to calculate the weight of each mode of transport ( ���� )) and the results
Modal Average Capacity (Persons) Average Speed (km/h) ()
Bus 75 38,86 0,34
BRT 160 60 0,54
Ferry Boat 1500 24 0,62
Train 1600 40 0,78
Subway 1800 60 1,00
Once the weight of each transport mode was calculated ( ���� )), the weight of each integration
w
w
w
.me
rca
to
Table 4 - Each mode of integration weight (�����)
Integration ()
Bus + Bus 0,34 Bus + BRT 0,44 Bus + Ferry Boat 0,48 Bus + Train 0,56 Bus + Subway 0,67
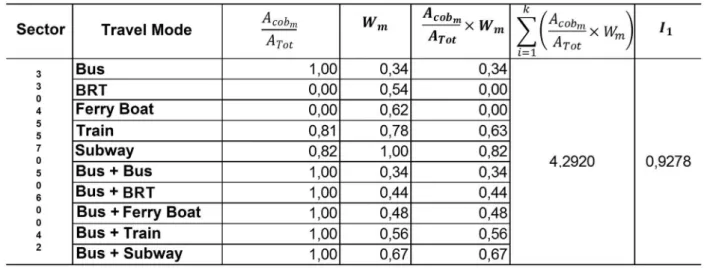
b) Indicator 1 Calculation
The calculation of the spatial supply and coverage of the various modes of travel was perfor-med by means of Equation I, so that it was considered the area of coverage of each mode of travel. Therefore, for a given census sector, the ratio between the spatial range of each mode of travel of the coverage area in the sector and the total area of the sector was calculated; the resulting values were multiplied by the weight corresponding to each mode of travel and these results were summed. Finally, the value generated was normalized to produce indicator 1.
For example, the sector 330455705060042 has the following characteristics: it is fully covered by the area reached by the bus modal and by all integration modes. It is partially covered by the subway and train modals and is not covered by the BRT and boats modals. In this case, the calcu-lation memory of Indicator 1 for sector 330455705060042 is shown in table 5:
Table 5 - Memory of Indicator 1 calculation for the sector 330455705060042
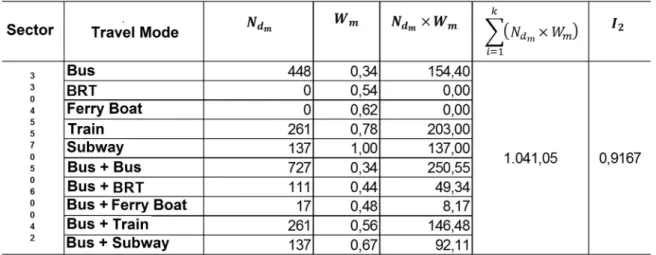
c) Indicator 2 Calculation
The calculation of the connectivity to diferent locations by the diferent modes of travel in
public transport was carried out through Equation II, so that it also considered the area covered
of each mode of travel. The number of traic zones connected to a given sector was calculated
for each mode of travel, these values were multiplied by the weight corresponding to each mode of travel and these results were added together. Finally, the resulting values were normalized to produce indicator 2.
It is worth mentioning that in this study, a census sector and a traic zone are considered to be
to
r.
u
fc.
b
r
Table 6 - Memory of Indicator 2 calculation for the sector 330455705060042
d) Indicator 3 Calculation
The calculation of the connectivity to job posts by the diferent modes of travel in public
transport was carried out by means of Equation III. As with the other indicators, it considered the area of coverage of each travel mode. The number of jobs connected to a particular sector was calculated for each travel mode, these values were multiplied by the weight corresponding to each mode of travel and these results were added together. Finally, the resulting values were normalized to give indicator 3.
It is worth noting that in this study, the number of jobs is spatially distributed in the form of
traic zones, that is, each traic zone has an “x” number of jobs. Thus, a census sector is considered connected to an “x” number of job posts when it and the traic zone with “x” jobs are inserted in
the area of coverage of the same modal or mode of integration.
As an example, Table 7 demonstrates the memory of Indicator 3 calculation for sector 330455705060042:
Table 7 - Memory of Indicator 3 calculation for the sector 330455705060042
Accessibility Index Calculation
w
w
w
.me
rca
to
Table 8 - Memory of the Accessibility Index calculation for the sector 330455705060042
RESULTS
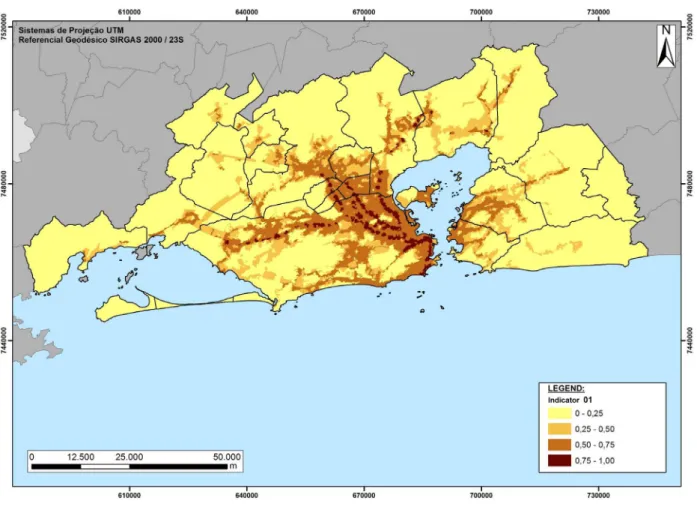
The results obtained for indicator 1 show that the highest values are concentrated around the train or subway stations and, mainly, in the central portion of the RMRJ. It should be noted that the main road axes of the study area also show results above 0.5 for indicator 1 (Figure 5). Regarding the results obtained for indicator 2, the highest values are concentrated in the areas simultaneously served by train and subway stations, mainly in the central portion of the city of Rio de Janeiro. The surroundings of the other subway, train and boat stations present, for the most part, results higher than 0.5 for indicator 2 (Figure 6). Finally, the analysis of the results of indicator 3 shows a simi-larity with the results of indicator 2, so that the highest values are also concentrated mainly in the surroundings of the train or subway stations. However, it is important to note that the areas served by boat stations did not obtain results higher than 0.5 for indicator 3 (Figure 7).
Figure 5 - Map of results obtained for Indicator 1.
to
r.
u
fc.
b
r
w
w
w
.me
rca
to
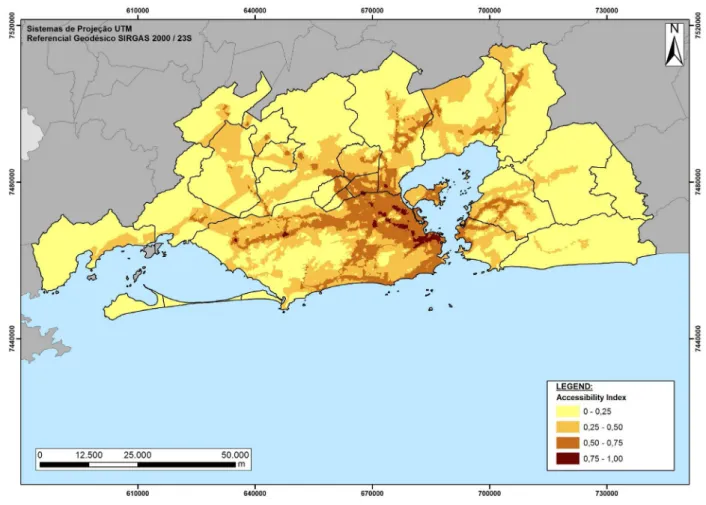
the city of Rio de Janeiro, as well as the southern portion of the Baixada Fluminense, including the cities of Nilópolis, Mesquita, São João de Meriti and the southern part of Duque de Caxias. This result is explained by the presence of several high capacity modals serving this region, mainly train and subway.
From the central portion of RMRJ, there are several axes with values above 0.5 following the train, subway and BRT lines and around the main road corridors.
As expected, areas served by high capacity modals obtained better results on the accessibility index and areas not served by high capacity modals recorded the worst results, thus, cities of the East Fluminense, such as Tanguá and Maricá, presented a large predominance of values below 0.25.
The average of the indicators and the accessibility index by municipality reinforces the pre-vious analysis, evidencing that the municipalities of Rio de Janeiro, São João de Meriti, Nilópolis, Mesquita and Duque de Caxias have the highest averages related to the accessibility index. The municipalities with the lowest averages for the accessibility index are Tanguá, Maricá, Itaboraí, Seropédica and Mangaratiba, which are peripheral municipalities not served by any high capacity modal (Table 9).
The majority of the population (59%) is located in areas with values between 0.5 and 0.75 for indicator 1, only 11% of the population is located in areas with values above 0.75. As regards indicators 2 and 3, the majority of the population, 62% and 60% respectively, occupies areas with values between 0.25 and 0.5. Concerning the accessibility index, more than half of the population (51%) is in areas that register values between 0.5 and 0.75; 33% of the population is in areas with values between 0.25 and 0.5; 13% of the population is in areas with values between 0 and 0.25, and only 3% of the population is in areas with values above 0.75 (Figure 9).
As mentioned above, the present study started from the premise that socio-spatial segregation is an accomplished fact in the study area, where low-income social classes are pushed out to
to
r.
u
fc.
b
r
Table 9 - Average Indicators and Accessibility Index by municipality
Figure 9 - Percentage of Population X Range of the indicators value and the Accessibility Index.
Counties Indicator 1 Indicator 2 Indicator 3 Accessibility Index Rio de Janeiro 0,6123 0,4866 0,4851 0,5490
São João de Meriti 0,6036 0,4680 0,4725 0,5369
Nilópolis 0,5956 0,4565 0,4788 0,5316
Mesquita 0,5653 0,4533 0,4821 0,5165
Duque de Caxias 0,4898 0,4150 0,4166 0,4528
Niterói 0,4765 0,3714 0,3250 0,4124
Nova Iguaçu 0,4482 0,3558 0,3882 0,4101
Belford Roxo 0,4551 0,3507 0,3671 0,4070
Magé 0,3650 0,3724 0,4034 0,3765
Itaguaí 0,3966 0,3156 0,3338 0,3607
São Gonçalo 0,4097 0,3066 0,2686 0,3486
Paracambi 0,3211 0,3132 0,3851 0,3351
Guapimirim 0,2924 0,3426 0,3861 0,3284
Queimados 0,3396 0,2592 0,3125 0,3127
Japeri 0,3025 0,2690 0,3306 0,3011
Mangaratiba 0,2780 0,2126 0,2462 0,2537
Seropédica 0,2159 0,2538 0,2597 0,2363
Itaboraí 0,2106 0,1462 0,1247 0,1730
Maricá 0,1551 0,1010 0,0542 0,1163
w
w
w
.me
rca
to
of the distance traveled. However, without taking into account the “degree of expulsion” of low --income social classes to peripheral areas of the RMRJ, the results of the indicators and the acces-sibility index show that there is a direct correlation between income and the quality of the public
transportation system ofered.
In Figure 10, it can be seen that the higher the per capita household income, the higher the average values of the indicators and the accessibility index itself. Figure 11 reinforces the direct
correlation between income and quality of the public transportation system on ofer by showing that
the higher the accessibility index, the higher the average per capita household income in the RMRJ.
Figure 10 - Indicators and Accessibility Index X Average per capita household income in minimum wage numbers.
Figure 11 - Average per capita household income in numbers of minimum wages X Average of the Accessibility Index.
Thus, it is clear that socio-spatial segregation in the RMRJ, where the lower the income, the greater the tendency to occupy the more peripheral areas, is repeated in relation to the service of the public transportation system. Therefore, individuals with higher incomes tend to occupy areas with better public transportation service than individuals with lower incomes in the RMRJ.
FINAL CONSIDERATIONS
The present study demonstrated that the public transportation system in the RMRJ is ineicient
as an instrument to overcome socio-spatial segregation, since the tendency is for individuals with lower incomes to occupy areas with lower levels on the proposed accessibility index. This trend can be explained by the higher quality of pubic transport in the central regions and by the increase
to
r.
u
fc.
b
r
A relevant but unaddressed consequence of the spatial heterogeneity of the level of accessibility
ofered by the public transport system is the formation of irregular land occupations in the form
of subnormal clusters in the most central areas by low-income social groups and the highest use of private cars by social groups with a greater purchasing power; these factors generate a series of housing, environmental and urban mobility problems.
The presence of high capacity modals (train, subway, boats and BRT) was an important factor in obtaining good results in the indicators and the index of the present study. Thus, regions lacking high capacity modes tended to present lower results; this could mainly be observed in the East Fluminense region.
The proposed accessibility index met the objective of the present study, but it does not presume to fully comprehend the broad meaning of accessibility, so other indicators can be considered for
later studies with diferent objectives or aiming to improve this index. Another important point is
that the accessibility index can gain a greater practical usefulness when compared with data on the demand for journeys.
It is important to stress once again that the proposed accessibility index aims to serve as an instrument for the public authorities to plan a collective transport system whilst requiring few
re-sources, which is why we chose to use simple criteria to deine the weight of each mode of travel
and for each indicator in the composition of the accessibility index. Therefore, more in-depth
stu-dies are recommended in the future to deine these weights according to the purpose of each study.
Finally, the geoprocessing techniques were fundamental to enable and streamline the analysis and processes demanded in this study, besides allowing the compatibility of a wide range of data
from diferent sources.
BIBLIOGRAPHIC REFERENCES
ALMEIDA, L. M. W.; GONÇALVES, M. B. Determinação de índices de acessibilidade a serviços escola-res. In: CONGRESSO PANAMERICANO DE ENGENHARIA DE TRÂNSITO E TRANSPORTE, 2002, Gramado, Anais... Gramado: PANANM, 2002.
BARANDIER, J. R. Acessibilidade da População Alvo do Programa Habitacional para Baixa Renda na Cidade do Rio de Janeiro. Dissertação (Mestrado em Engenharia de Transportes) - Universidade Federal do Rio de Janeiro, Rio de Janeiro, 2012.
CÂMARA, G.; DAVIS.C.; MONTEIRO, A.M.; D’ALGE, J.C. Introdução à Ciência da Geoinformação. São José dos Campos: INPE, 2001.
CASTRO, N. Logistic costs and Brazilian regional development. [S.l.]: Social Science Research Network, 2004.
CURTIS, C.; SCHEURER, J. Planning for sustainable accessibility: developing tools to aid discussion and decision-making. Progress in Planning, l. 74, n. 2, p. 53-106, 2010.
ECHENIQUE, M. El concepto de sistemas, modelos y teorías en los estudios urbanos. In: ECHENIQUE, M. (Ed.). Modelos matemáticos de la estructura espacial urbana: aplicaciones en América Latina. Buenos Aires: Ediciones Nueva Visión S.A, 1975.
FRANÇA, A. Indicadores de desempenho espacial estudo de caso: a cidade de Cutitibanos – SC. Dis-sertação (Mestrado em Planejamento Urbano e Regional) - Universidade Federal do Rio Grande do Sul, Porto Alegre, 2004.
GEURS, K. T.; WEE, B. Accessibility evaluation of land-use and transport strategies: review and research directions. Journal of Transport Geography, v. 12, n. 2, p. 127-140, 2004.
w
w
w
.me
rca
to
GUTIERREZ, J.; URBAN, P. Accessibility in the European Union: the impact of the trans-European road
network. Journal of Transport Geography, v. 4, n. 1, p. 15-25, 1996.
HANSEN, W. How accessibility shapes land use. Journal of the American Institute of Planners, v. 25, n. 2, p. 73-76, 1959.
INGRAM, D. The concept of Accessibility: a search for an operational form. Regional Studies, v. 5, p. 101-107. 1971.
KIM, E.; HEWINGS, G. J. D. An application of integrated transport network: multiregional CGE model II:
calibration of network efects of highway. Urbana: University of Illinois at Urbana-Champaingn, 35 p., 2003.
KOENIG, J. G. Indicators of urban accessibility: theory and application. Transportation Research, v. 9, n. 2, p. 145-172, 1980.
KWAN, M-P Space time and integral measures of individual accessibility: a comparative analysis using a point-based framework. Geographical Analysis, vl. 30, n. 3, p. 191-216, 1998.
LEE M. S; GOULIAS, K. G. Accessibility indicators for transportation planning using GIS. In: TRANS-PORTATION RESEARCH BOARD ANNUAL MEETING, 76TH, Washington, 1997.
RAIA JR., A. A.; SILVA, A.N.R.; BRONDINO, N. C. M. Comparação entre medidas de acessibilidade para aplicação em cidades brasileiras de médio porte. In: PANORAMA NACIONAL DE PESQUISA EM TRANSPORTES 1997, VII ANPET, 1997, Rio de Janeiro. Anais... Rio de Janeiro: Associação Nacional de Ensino e Pesquisa em Transportes, 1997, p. 541-552.
RAIA JR, A. A. Acessibilidade e mobilidade na estimativa de um índice de potencial de viagens utili -zando Redes Neurais Artiiciais e Sistemas de Informações Geográicas. Tese (Doutorado em Engenharia Civil) - Universidade de São Paulo, São Carlos, 2000.
ROSA, S. Transporte e exclusão social: a mobilidade da população de baixa renda da Região Metropolitana de São Paulo e trem metropolitano. Dissertação (Mestrado Em Engenharia de Transportes) - Universidade de São Paulo, São Paulo, 2006.
SAISANA, M. et al. Knowledge Economy Indicators: State-of-the-Art Report on Composite Indicators for the Knowledge-based Economy. Joint Research Centre, European Commission, Ispra: Italia, 2005. SANCHES, S. P.; FERREIRA, M. A. G. Avaliação do padrão de acessibilidade em um sistema de transporte
de alunos na Zona Rural. In: CONGRESSO DE PESQUISA E ENSINO EM TRANSPORTES, 17., Rio de
Janeiro. Anais... Rio de Janeiro: ANPET, 2003.
SANTOS, A. C.; ZANDONADE, E.; CAMPOS, V. B. G. Proposta de um modelo para análise de acessibi -lidade no transporte de cargas. In: CONGRESSO DE PESQUISA E ENSINO EM TRANSPORTES, 18., Florianópolis. Anais...\Rio de Janeiro: ANPET, 2004.
SILVA, M. A. Estudo da Incorporação da Acessibilidade à Atividade na Análise de Demanda por Viagens Encadeadas. Tese (Doutorado em Engenharia Civil). Escola de Engenharia de São Carlos, Universidade de São Paulo, São Carlos, 2011.
VASCONCELLOS, E. A. Transporte Urbano, Espaço e Equidade. Análise das políticas públicas. São Paulo: NetPress. 1996.
VASCONCELLOS, E. A. Transporte Urbano nos Países em Desenvolvimento: relexão e propostas. São Paulo: Annablume. 2000.