Evaluation of RDW-CV, RDW-SD,
and MATH-1SD for the detection of erythrocyte
anisocytosis observed by optical microscopy
Avaliação de RDW-CV, RDW-SD e MATH-1SD na detecção da
anisocitose dos eritrócitos visualizados na microscopia óptica
Fernando Augusto Caporal1; Samuel Ricardo Comar2
First submission on 16/01/13; last submission on 16/01/13; accepted for publication on 14/03/13; published on 20/10/13
1. Biochemistry/Pharmacy graduate of Universidade Federal do Paraná (UFPR); specialist in Advanced Hematology from Faculdade Ceres (FACERES) and Academia de Ciência e Tecnologia (AC&T); attending Multiprofessional Residency in Hospital Care – area of Hematology/Oncology at Hospital de Clínicas of UFPR (HC-UFPR).
2. Biochemistry/Pharmacy graduate of UFPR; master’s degree in Pharmaceutical Scienses – area of Clinical Laboratory Science – from UFPR; specialist in Laboratory Hematology from Sociedade Brasileira de Análises Clínicas (SBAC); lecturer of Multiprofessional Residency in Hospital Care – area of Hematology/Oncology – at HC-UFPR; biochemist/pharmacist of the Hematology Laboratory at the Support and Diagnosis Unit of HC-UFPR.
ABSTRACT
Introduction and objective: To evaluate the performance of red cell distribution width reported statistically as coeficient of variation (RDW-CV), standard deviation (RDW-SD), and mathematical deduction of 1 standard deviation (SD) around mean corpuscular volume (MATH-1SD) in identifying anisocytosis in automated blood counts when compared with the manual quantiication of erythrocyte
anisocytosis in peripheral blood smears. Material and methods: 806 routine samples obtained from the hematology laboratory of
Hospital de Clínicas da Universidade Federal do Paraná (HC-UFPR) were analyzed. Performance evaluations were carried out by dividing samples into microcytic, normocytic and macrocytic mean corpuscular volume (MCV). For each MCV range, sensitivity, speciicity, positive predictive value (PPV), negative predictive value (NPV), and eficiency were calculated. In addition, the Youden index (Y) was obtained and a comparative analysis with receiver operating characteristic (ROC) curves was done to evaluate the performance of RDW-SD, RDW-CV, and
MATH-1SD on different MCV ranges. Results and discussion: RDW-CV had the best sensitivity (86.8%) and eficiency (86.8%) in detecting
anisocytosis in microcytic MCV ranges. RDW-SD and MATH-1SD were more sensitive and eficient in normocytic (82.9% and 83.3%; 92.1% and 92.3%, respectively) and macrocytic (90.2% and 90.2%; 95.1% and 95.1%, respectively) MCV ranges. A ROC curve analysis indicated that
RDW-CV was more eficient in detecting anisocytosis in microcytic MCV ranges (p < 0.05 vs. RDW-SD and MATH-1SD). In normocytic and
macrocytic MCV ranges, RDW-SD and MATH-1SD showed similar eficiency in detecting anisocytosis (p < 0.05 vs. RDW-CV). Conclusion:
RDW-SD, RDW-CV, and MATH-1SD deliver different performances in detecting blood smear anisocytosis according to MCV values. They are parameters that complement each other and should be used together to identify erythrocyte size heterogeneity.
Key words:laboratory automation; RDW-CV; RDW-SD; mean corpuscular volume; cellular analysis.
INTRODUCTION
Since Antonie van Leeuwenhoek’s discovery of human red blood cells in 1674, many researchers have reported observations about the mean diameter of erythrocytes. However, the exact diameter was
The electrical impedance method, developed by Wallace Henry Coulter in 1949 and employed on the Model A Coulter cell counter in 1956, suggested that cell size and cell counts could be determined simultaneously, because the magnitude of the electrical impulse was proportional to cell volume. As this and other new technologies were created and improved, routine counts became faster and more accurate. Besides, new parameters were made available, such as the red cell distribution width (RDW),
which correlates with the degree of homogeneity/heterogeneity of
erythrocyte size and is equivalent to anisocytosis in blood smears. RDW was irstly measured by the analyser Coulter Counter Model S-Plus II, being expressed as coeficient of variation (RDW-CV) and, more recently, as standard deviation (RDW-SD), especially in analysers Sysmex (Kobe, Japan), Beckman Coulter (Brea, USA)
and Mindray (Shenzhen, China)(11, 12, 15).
Anisocytosis is a medical term meaning the size variation among microscopically observed erythrocytes in a blood smear. It frequently, but not always, correlates with RDW. Samples with high presence of alterations in erythrocyte shape indirectly affect the automated determination of RDW. Other factors that make spurious RDW alterations are long-term sample storage, erythrocyte agglutinins, hyperglicemia, erythrocyte fragmentation, high lymphocyte counts, the presence of giant platelets, platelet aggregates and intense microcytosis(3, 14, 22). Since this last fator
affects principally RDW-CV, because it is inversely proportional to
MCV, Walters et al.(29) suggested using the parameter MATH-1SD,
which represents the mathematical deduction of 1 SD around MCV. The microscopic classiication of erythrocyte size variation is generally described, in semiquantitative terms, as mild, moderate or severe, or graded from 1+ to 4+. When appropriately carried out, consistently and systematically, it helps reach a correct diagnosis, at least in some cases. Signiicant anisocytosis may be observed in several clinical conditions, including situations with
intense production of reticulocytes, megaloblastic anemia, blood
transfusions, and serious iron deiciency anemia. The microscopic assessment of anisocytosis may be affected by visual limitations of the human eye, as described by Weber-Fechner’s Law, and by the possible occurrence of different hemoglobin concentrations in erythrocytes. These concentrations alter the lattening effect of these cells in the glass of microscope slides(13, 16, 21, 29).
Although the automated quantiication of anisocytosis suggested by RDW presents advantages, visual inspection of a properly prepared and stained blood smear is still an important action to search for signiicant hematologic alterations, both for clinical conduct and for comparing and assessing values delivered by hematology analysers. With this in mind, this work was aimed at assessing the performance of RDW-CV, RDW-SD and MATH-1SD
in identifying erythrocyte anisocytosis in automated blood counts, when compared to the manual method of microscope slides, in situations of low, normal and high MCV.
MATERIAL AND METHODS
Study site and sample preparation
The investigation was conducted at the hematology laboratory of the Support and Diagnosis Unit of Hospital de Clínicas da UFPR (HC-UFPR), after approval by the local ethics committee. Representing two consecutive days of laboratory routine, 806 whole blood samples were used. The samples were collected in vials containing dipotassium ethylenediaminetetraacetic acid
(EDTA-K2)(1.8 mg/ml) (Vacutainer - Becton, Dickinson and
Company, USA) and were analysed within three hours after collection, using hematology analysers XE-2100D or XT-2000i (both Sysmex Corporation, Japan). For each sample, a blood smear was prepared and stained by means of the slide maker/stainer SP-1000i (Sysmex Corporation, Japan) in no more than three hours after collection. Samples containing low-volume whole blood
were manually prepared by means of the wedge-spread ilm.
The staining technique employed in both the automated and the
manual method was that of May Grünwald & Giemsa(19).
Determination of RDW-CV, MATH-1SD and RDW-SD
RDW-CV is calculated from the erythrocyte volume
distribution histogram. It represents the coeficient of variation of erythrocyte volume around MCV. It is calculated as follows: RDW-CV (%) = 1 SD (femtoliters [l])/MCV (l) × 100, where 1 SD = 1 SD in relation to MCV, which is obtained at a height of 68.2% above
the base of the erythrocyte volume distribution histogram.
MATH-1SD is a parameter that represents the mathematical deduction of 1 SD around MCV and is calculated as follows: MATH-1SD (l) = RDW-CV (%) × MCV (l)/100. RDW-SD is determined from the
width of erythrocyte volume distribution curve at level 20% above
baseline and is expressed in femtoliters(29). The Figure shows the
obtainment of these parameters.
Manual method for quantification of erythrocyte
anisocytosis
After that, the average number of microcytes and macrocytes per ield was calculated. These values were added, and anisocytosis was
quantiied according to Table 1.
FIGURE – Obtainment of RDW-CV, MATH-1SD and RDW-SD from erythrocyte volume distribution histogram (1 SD)
RDW-CV: coeficient of variation of red cell distribution width; RDW-SD: standard deviation of red cell distribution width; SD: standard deviation; MCV: mean corpuscular volume.
50 100 150
and RDW-SD > 46.1 l. If a sample was considered positive for one of these screening criteria and in the manual quantiication of erythrocyte anisocytosis it contained a signiicant number of microcytes and macrocytes (Table 1), the sample was classiied as true positive (TP). If a sample was positive for any screening criterion and contained no relevant anisocytosis in the microscope counterpart, the sample was classiied as false positive (FP). If a sample was negative for any screening criterion and contained any signiicant anisocytosis in the microscopic analysis, it was classiied as false negative (FN). Finally, if a sample was negative for any screening criterion and did not present any relevant indind
on the slide, the sample was classiied as true negative (TN)(2, 26).
Considerations
Hematologic quality assurance and quality control procedures were followed to ensure good operating conditions for the hematology analysers employed in this study. All adjustments and settings of hematology analysers were provided by the manufacturer’s technical and scientiic assistance service. Manual microscopic classiications of erythrocyte anisocytosis were
performed using an optical microscope Olympus BX-41 (Olympus
Corporation, Japan) with magniication of 1,000×. Erythrocyte size may be microscopically determined by comparing their diameters to those of lymphocyte nuclei. Normal erythrocytes are approximately the same size as the nucleus of a small
lymphocyte(28). Performance evaluations were carried out by
categorizing samples into microcytic (MCV < 80), normocytic (80 ≤ MCV ≤ 99) and macrocytic (MCV > 99), in an effort to
examine the behavior of parameters in different MCV ranges(6).
TABLE 1 – Criteria for erythrocyte anisocytosis quantiication in blood smears Anisocytosis
quantiication 1+ 2+ 3+
Condition
5%-25% of microcytes and
macrocytes
25.1%-50% of microcytes and
macrocytes
> 50% of microcytes and
macrocytes 200 erythrocytes
per ield 10 to 50 cells 51 to 100 cells > 100 cells 150 erythrocytes
per ield 8 to 37 cells 39 to 75 cells > 75 cells 100 erythrocytes
per ield 5 to 25 cells 26 to 50 cells > 50 cells Adapted from Gulati (2009)(15) and O’Connor (1984)(20).
1+: one cross (+); 2+: two crosses (++); 3+: three crosses (+++). Frequency in which
a certain MCV value appears in the analysed
erythrocyte population
MATH-1SD = 1 SD = width of the histogram, in femtoliters, at approximately the 68.2% frequency MCV
RDW-SD = histogram index at the 20% frequency level = RDW-CV
1 SD MCV
MCV (l) 100%
20%
Sample classification criteria
First, reference ranges for CV, MATH-1SD and RDW-SD were calculated in 221 samples of normal subjects, who underwent regular routine examinations, according to the guidelines recommended in document C28-A3 of the Clinical and
Laboratory Standards Institute (CLSI)(7). The obtained values were:
Statistical analyses
Sensitivity, speciicity, positive predictive value (PPV), negative predictive value (NPV) and eficiency for parameters RDW-CV, RDW-SD and MATH-1SD in relation to the reference manual method were calculated as follows: sensitivity (%) = (TP/TP + FN) × 100; speciicity (%) = (TN/TN + FP) × 100; NPV (%) = (TN/TN + FN) × 100; PPV (%) = (TP/TP + FP) × 100; and eficiency (%)
= (TP + TN/TP + FP + FN + TN) × 100(25). ROC curves, as well as
statistical comparisons of ROC curves, were performed by program
MedCalc® version 7.3.0.1 (MedCalc Software, Belgium). The
Youden index (Y) was calculated by the formula: Y = sensitivity + (speciicity - 1)(6, 27).
RESULTS
Among the 806 samples used in this work, 395 (49%) were considered positive and 411 (51%), negative for the presence of anisocytosis by the manual microscopic method. The results obtained in the calculation of RDW-CV, RDW-SD and MATH-1SD
are displayed on Table 2. Samples were divided, according to
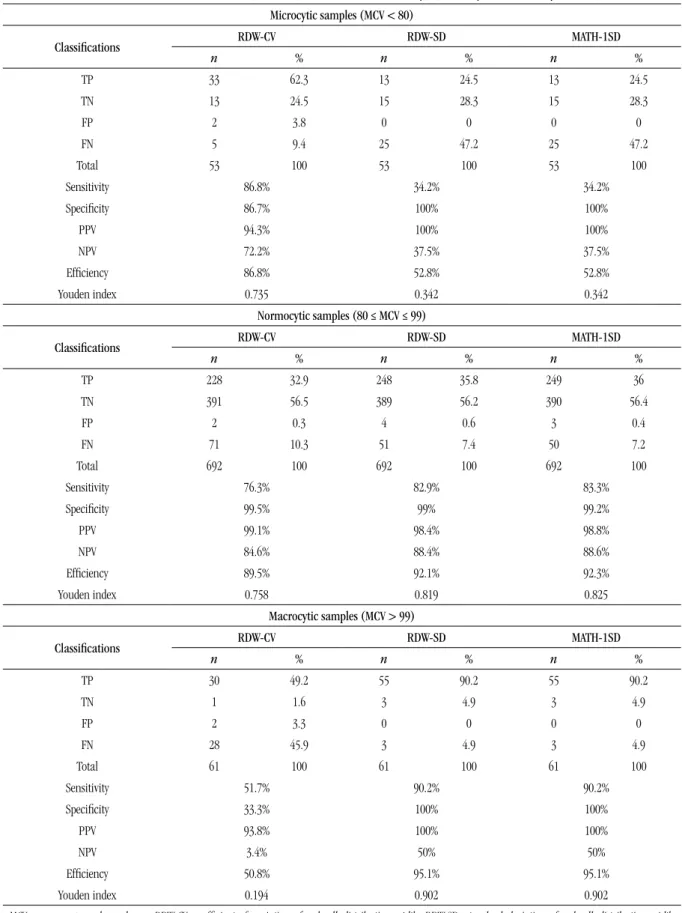
MCV ranges, into microcytic (MCV < 80), normocytic (80 ≤ MCV ≤ 99) and macrocytic (MCV > 99). RDW-CV had the highest sensitivity when it detected anisocytosis in microcytic samples (86.8%). For normocytic and macrocytic samples, RDW-SD and MATH-1SD showed similar sensitivity values, higher than those of RDW-CV (82.9% and 83.3% in normocytosis and 90.2%-90.2% in macrocytosis, respectively). RDW-CV presented NPV of 72.2% in microcytic samples, whereas RDW-SD and MATH-1SD presented the same value of 37.5%. This indicates that the use of RDW-CV in evaluation of microcytosis increases the probability of not inding anisocytosis with a value below cut-off point (≤ 14.3%).
The Youden index is a function of sensitivity and speciicity and ranges between 0 and 1, with 1 indicating the best relationship between sensitivity and the false-positive fraction,
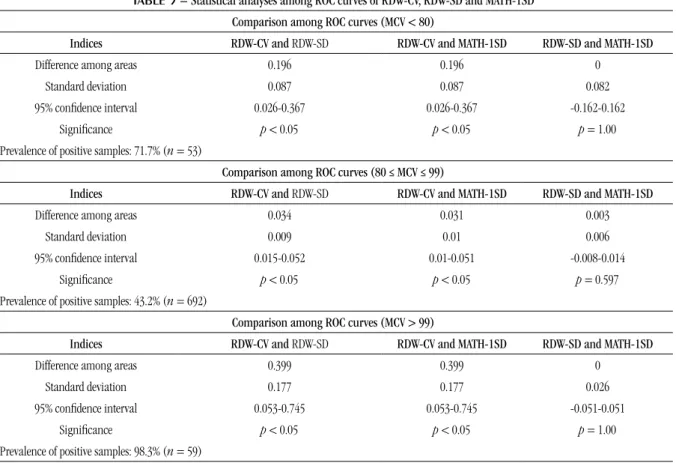
and 0, the worst. Table 3 shows the statistical analyses among
ROC curves of RDW-CV, RDW-SD and MATH-1SD. In microcytosis, RDW-CV presented statistical difference from RDW-SD and
MATH-1SD to reveal anisocytosis (p < 0.05); in normocytosis
and macrocytosis, RDW-SD and MATH-1SD presented statistical
difference from RDW-CV to reveal anisocytosis (p < 0.05).
However, RDW-SD and MATH-1SD presented no statistical difference to show anisocytosis in microcytosis, normocytosis
and macrocytosis.
DISCUSSION
Erythrocyte morphology is traditionally assessed in blood smears. To this end, they are irst examined in relation to staining quality and to uniform cell distribution on the microscope slide. After selection of an adequate microscopic ield, erythrocytes are examined taking into account size, deviations in shape, color or hemoglobin content, and the presence of inclusions and precursor cells. Anisocytosis is one of the most frequent erythrocyte anomaly, a non-speciic change in severe forms of anemia, yet no conclusion may be drawn about its origin. Although modern hematology analysers supply information on erythrocytes, there are still morphological abnormalities critical for the diagnosis of anemia which are only observed in the microscopic analysis of peripheral blood(1, 23).
Little advantage has been taken of the erythrocyte volume distribution histogram, which may provide useful information in monitoring reliability of results generated by analysers, investigating the potential causes of erroneous automated results and reaching a presumptive diagnosis. For example, the presence of fragmented erythrocyte or erythrocyte agglutination, which could not be identiied without the microscopic examination of peripheral blood, may be presumably detected on the red cell histogram. Similarly, in
patients with iron deiciency anemia or megaloblastic anemia in
treatment, sequential histograms may early evidence the gradual appearence of a new erythrocyte population(9).
A marked anisocytosis is almost always accompanied by an increase in RDW, however, the other way around is not always
true, particularly when accompanied by signiicant poikilocytosis.
RDW is considered a quantitative, not subjective, measure of
anisocytosis viewed on complete blood count, however it is only proportional to anisocytosis if erythrocyte volume has a Gaussian distribution. If volume distribution is falsely biased to left or right of the histogram curve, RDW may not be an adequate marker of anisocytosis and must be superseded by microscopic examination. Although there are several factors that cause spurious changes in RDW, as already mentioned, recognising the type of modiication provoked in the pattern of erythrocyte volume distribution curve
may help identify the causes, despite RDW value(3, 10). According
to Constantino(9), the presence of a bump on the right side of
the histogram generally corresponds to reticulocytosis, and a tail on the far right of the histogram correlates with erythrocyte agglutination. A displacement to the left in the erythrocyte histogram means microcytosis; to the right, macrocytosis. Bimodal red cell histograms are normally associated with blood transfusions, response to the treatment of deiciency-related
TABLE 2 – Evaluation of RDW-CV, RDW-SD, and MATH-1SD in microcytic, normocytic and macrocytic MCV
Microcytic samples (MCV < 80)
Classifications RDW-CV RDW-SD MATH-1SD
n % n % n %
TP 33 62.3 13 24.5 13 24.5
TN 13 24.5 15 28.3 15 28.3
FP 2 3.8 0 0 0 0
FN 5 9.4 25 47.2 25 47.2
Total 53 100 53 100 53 100
Sensitivity 86.8% 34.2% 34.2%
Speciicity 86.7% 100% 100%
PPV 94.3% 100% 100%
NPV 72.2% 37.5% 37.5%
Eficiency 86.8% 52.8% 52.8%
Youden index 0.735 0.342 0.342
Normocytic samples (80 ≤ MCV ≤ 99)
Classifications RDW-CV RDW-SD MATH-1SD
n % n % n %
TP 228 32.9 248 35.8 249 36
TN 391 56.5 389 56.2 390 56.4
FP 2 0.3 4 0.6 3 0.4
FN 71 10.3 51 7.4 50 7.2
Total 692 100 692 100 692 100
Sensitivity 76.3% 82.9% 83.3%
Speciicity 99.5% 99% 99.2%
PPV 99.1% 98.4% 98.8%
NPV 84.6% 88.4% 88.6%
Eficiency 89.5% 92.1% 92.3%
Youden index 0.758 0.819 0.825
Macrocytic samples (MCV > 99)
Classifications RDW-CV RDW-SD MATH-1SD
n % n % n %
TP 30 49.2 55 90.2 55 90.2
TN 1 1.6 3 4.9 3 4.9
FP 2 3.3 0 0 0 0
FN 28 45.9 3 4.9 3 4.9
Total 61 100 61 100 61 100
Sensitivity 51.7% 90.2% 90.2%
Speciicity 33.3% 100% 100%
PPV 93.8% 100% 100%
NPV 3.4% 50% 50%
Eficiency 50.8% 95.1% 95.1%
Youden index 0.194 0.902 0.902
TABLE 3 – Statistical analyses among ROC curves of RDW-CV, RDW-SD and MATH-1SD
Comparison among ROC curves (MCV < 80)
Indices RDW-CV and RDW-SD RDW-CV and MATH-1SD RDW-SD and MATH-1SD
Difference among areas 0.196 0.196 0
Standard deviation 0.087 0.087 0.082
95% conidence interval 0.026-0.367 0.026-0.367 -0.162-0.162
Signiicance p < 0.05 p < 0.05 p = 1.00
Prevalence of positive samples: 71.7% (n = 53)
Comparison among ROC curves (80 ≤ MCV ≤ 99)
Indices RDW-CV and RDW-SD RDW-CV and MATH-1SD RDW-SD and MATH-1SD
Difference among areas 0.034 0.031 0.003
Standard deviation 0.009 0.01 0.006
95% conidence interval 0.015-0.052 0.01-0.051 -0.008-0.014
Signiicance p < 0.05 p < 0.05 p = 0.597
Prevalence of positive samples: 43.2% (n = 692)
Comparison among ROC curves (MCV > 99)
Indices RDW-CV and RDW-SD RDW-CV and MATH-1SD RDW-SD and MATH-1SD
Difference among areas 0.399 0.399 0
Standard deviation 0.177 0.177 0.026
95% conidence interval 0.053-0.745 0.053-0.745 -0.051-0.051
Signiicance p < 0.05 p < 0.05 p = 1.00
Prevalence of positive samples: 98.3% (n = 59)
ROC: receiver operating characteristic curve; MCV: mean corpuscular volume; RDW-CV: coeficient of variation of red cell distribution width; RDW-SD: standard deviation of red cell distribution width; MATH-1SD: mathematical deduction of 1 standard deviation (SD) around MCV.
RDW within reference ranges indicates that erythrocytes follow a pattern of size distribution that approaches the normal of a population of individuals. This suggests the presence of a homogeneous cell population, but not necessarily that all cells have normal size. So, it is important to make it clear that a normal RDW does not exclude the presence of a signiicant amount of cells that are much larger than the majority cell population. It does not mean that the majority erythrocyte population is normal either. There is a natural desire to use the several possible combinations of MCV and RDW to conduct to possible diagnoses of anemias, but this practice may produce errors and must never substitute more speciic laboratory investigations, including the analysis of peripheral blood slides(3, 4, 13).
RDW reference intervals, calculated for healthy individuals, differ when obtained by analysers of different manufacturers, and sometimes, even on different models of the same manufacturer. This may be explained by the fact that analysers use different algorithms to analyse cell distribution. These algorithms are essential to eliminate extreme values, normally due to artifacts. Any consideration about the clinical use of RDW must be evaluated,
preferably by comparison with reference ranges established for
each hematology analyser model(18).
The present study evaluated the performance of RDW-CV, RDW-SD and MATH-1SD in detecting anisocytosis on peripheral
blood smear. These parameters were provided by Sysmex®
hematology analysers. In order to obtain consistency in manual classiications, a standardized system of erythrocyte anisocytosis quantiication in blood smears was created (Table 1). There are several classiication systems, yet there is not the best one. In order to follow good clinical and laboratory practices and the recommendations of laboratory accreditation agencies, it is important to keep consistency in the chosen system and ensure that all professionals in the laboratory use it as the standard. The classiication system has clinical importance in some cases of abnormal indings such as, for example, three crosses (3+) of
microcytes for patients with iron deiciency anemia, and 3+ of
dacrocytesfor patients with megaloblastic myeloibrosis(16).
relationship to it. Besides, when dividing 1 SD by MCV, there is a tendency towards a falsely normal coeficient of variation (RDW-CV), that is, RDW-CV may be normal, but erythrocytes may be microcytic or macrocytic on the slide(29). In this study, this was particularly
observed in macrocytic MCV, perhaps because the higher the MCV, the more likely the RDW-CV is within reference ranges. In microcytic MCV (Tables 2 and 3), RDW-CV presented higher sensitivity and relative eficiency to detect anisocytosis when compared to the manual method. Perhaps this performance is due to the fact that microcytic MCV highlight RDW-CV values, what may, however, have caused decrease in speciicity in relation to RDW-SD and MATH-1SD.
RDW-SD, as well as MATH-1SD, is not affected by MCV. It differentiates from this because it is the direct measurement,
in femtoliters, of the curve variation at the 20% level above baseline of the erythrocyte volume distribution histogram, instead of the 68.2% height in the case of MATH-1SD. The 20% height was chosen because at this level a greater size variation occurs among the erythrocytes of an individual(29). In relation
to RDW-CV, RDW-SD obtained better eficiency and better relationship between sensitivity and the false positive fraction in identifying anisocytosis, when compared to the manual method, in normocytic and macrocytic MCV ranges.
MATH-1SD was used in an attempt to eliminate the dependence of RDW-CV on the average size of erythrocytes, what was conirmed by the presented results. However, MATH-1SD obtained a performance similar to that of RDW-SD when it indicated anisocytosis in microcytic, normocytic and macrocytic
ACKNOWLEDGEMENTS
The authors would like to thank the staff of the Hematology Laboratory of HC-UFPR for their cooperation to perform this study.
TABLE 4 – Criteria for quantiication of erythrocyte anisocytosis in peripheral blood smears
Parameters
Quantiication of erythrocyte anisocytosis in peripheral blood smears
1+ 2+ 3+
RDW-CV (%) 15.5-19 19.1-24 > 24 RDW-SD (l) 47-62 62.1-75 > 75 MATH-1SD (l) 12.8-16 16.1-19.7 > 19.7 1+: one cross (+); 2+: two crosses (++); 3+: three crosses (+++); RDW-CV: coeficient of variation of red cell distribution width; RDW-SD: standard deviation of red cell distribution width; MATH-1SD: mathematical deduction of 1 standard deviation (SD) around MCV.
MCV ranges (p = 1, 0.597 and 1, respectively). Thus, since
MATH-1SD is not provided by hematology analysers, it is of limited
usefulness.
We can conclude that RDW-CV, RDW-SD and MATH-1SD must be used in association, so as to help identifying the heterogeneity of erythrocyte size. Along with good assessment of the histogram shape, they may lead to an excellent morphologic analysis of erythrocytes.
At last, by grouping the obtained data, we suggested cut-off points for each parameter studied in this article, giving them a scale of crosses to be routinely used in hematology laboratories
(Table 4).
RESUMO
Introdução e objetivo: Avaliar o desempenho do red cell distribution width expresso em coeiciente de variação (RDW-CV) e desvio padrão (RDW-SD) e da dedução matemática de 1 desvio padrão (DP) ao redor do volume corpuscular médio (MATH-1SD) ao identiicar anisocitose nos hemogramas automatizados, quando comparados com o método manual de quantiicação da
anisocitose eritrocitária em lâmina. Material e métodos: Foram analisadas 806 amostras obtidas da rotina laboratorial da
Seção de Hematologia do Hospital de Clínicas da Universidade Federal do Paraná (HC-UFPR). As avaliações de desempenho foram realizadas dividindo-se as amostras em volume corpuscular médio (VCM) microcítico, VCM normocítico e VCM macrocítico. Para cada faixa de VCM, sensibilidade, especiicidade, valor preditivo positivo (VPP), valor preditivo negativo (VPN) e eiciência foram determinados. Além disso, o índice de Youden foi calculado e uma análise comparativa de curvas de características de operação
do receptor (curvas ROC [receiver operating characteristic]) foi realizada para veriicar o desempenho de RDW-CV, RDW-SD e
MATH-1SD em diferentes faixas de VCM. Resultados e discussão: O RDW-CV obteve a melhor sensibilidade (86,8%) e eiciência
(86,8%) ao detectar anisocitose em faixas de VCM microcítico. O RDW-SD e o MATH 1SD foram mais sensíveis e eicientes em VCM normocítico (82,9% e 83,3%; 92,1% e 92,3%, respectivamente) e macrocítico (90,2% e 90,2%; 95,1% e 95,1%, respectivamente).
A comparação de curvas ROC demonstrou que o RDW-CV foi mais eiciente ao detectar anisocitose em VCM microcítico (p < 0,05
REFERENCES
1. BAIN, B. J. Diagnosis from the blood smear. N Engl J Med, v. 353, n. 5, p. 498-507, 2005.
2. BARNES, P. W. et al. The international consensus group for hematology review: suggested criteria for action following automated CBC and WBC differential analysis. Lab Hematol, v. 11, n. 2, p. 83-90, 2005.
3. BESSMAN, J. A. Red cells. In: BESSMAN, J. A. (Ed.). Automated blood
counts and differentials: a practical guide. Baltimore: The Johns
Hopkins University Press, 1986. p. 5-56.
4. BUTTARELLO, M.; PLEBANI, M. Automated blood cell counts: state of the art. Am J Clin Pathol, v. 130, n. 1, p. 104-16, 2008.
5. CAPORAL, F. A.; COMAR, S. R. Evaluation of RDW-CV, RDW-SD, and MATH-1SD for the detection of erythrocyte size heterogeneity observed by optical microscopy. Int J Lab Hematol, v. 35, suppl. 1, p. 44, 2013. 6. CLINICAL and Laboratory Standards Institute (CLSI). Assessment of the diagnostic accuracy of laboratory tests using receiver operating characteristic curves: approved guideline. 2. ed. Wayne, PA: CLSI Document EP24-A2, 2011.
7. CLINICAL and Laboratory Standards Institute (CLSI). Deining,
establishing, and verifying reference intervals in the clinical
laboratory: approved guideline. 3. ed. Wayne, PA: CLSI Document C28-A3, 2008.
8. COMAR, S. R. Existe mais de um tipo de RDW e quais as diferenças? In: MARTINHO, M. S. C. (Org.). Hematologia em laboratório clínico
(Coleção 156 perguntas e respostas). São Paulo: Sarvier, 2012. p. 216-8. 9. CONSTANTINO, B. T. The red cell histogram and the dimorphic red cell population. Lab Medicine, v. 42, p. 300-8, 2011.
10. CORNBLEET, J. Spurious results from automated hematology cell counters. Lab Med, v. 14, p. 509-14, 1983.
11. COULTER, W. H. High speed automatic blood cell counter and cell size analyzer. Proc Natl Electron Conf, v. 12, p. 1034-40, 1956.
12. COULTER, W. H. Means for counting particles suspended in a luid. U.S. patent no. 2656508. Filed August, 1949.
13. ENGLAND, J. M. Blood cell sizing. In: KOEPKE, J. A. (Ed.). Practical laboratory hematology. New York: Churchill Livingstone, 1991. p. 109-30. 14. FLYNN, M. M.; REPPUN, T. S.; BHAGAVAN, N. V. Limitations of red blood cell distribution width (RDW) in evaluation of microcytosis. Am J Clin Pathol, v. 85, n. 4, p. 445-9, 1986.
15. GRONER, W.; SIMSON, E. History of cell counting. In: GRONER, W.; SIMSON, E. Practical guide to modern hematology analyzers. Chichester: John Wiley & Sons Ltd, 1995. p. 1-19.
16. GULATI, G. Red cell morphology. In: GULATI, G.(Ed.). Blood cell
morphology: grading guide. Hong Kong: ASCP Press, 2009. p. 3-45.
17. GULLIVER, G. The works of William Hewson. London: Sydenham Society, 1846. 360 p.
18. HOFFMANN, J. J. Red cell distribution width and mortality risk. Clin Chim Acta, v. 413, n. 7-8, p. 824-5, 2012.
19. HOUWEN, B. Blood ilm preparation and staining procedures. Clin Lab Med, v. 22, n. 1, p. 1-14, 2002.
20. JURIN, J. An account of some experiments relating to the speciic gravity of human blood. Phil Trans Roy Soc London, v. 30, p. 1000-14, 1718.
21. O’CONNOR, B. H. Manual peripheral blood differential procedure.
In: O’CONNOR, B. H. (Ed.). A color atlas and instruction manual of peripheral blood cell morphology. Canada: Lippincott Williams & Wilkins, 1984. p. 20-31.
22. PARK, K. I.; KIM, K. Y. Clinical evaluation of red cell volume distribution width (RDW). Yonsei Med J, v. 28, n. 4, p. 282-90, 1987. 23. PIERRE, R. V. Red cell morphology and the peripheral blood ilm.
Clin Lab Med, v. 22, n. 1, p. 25-61, 2002.
24. PRICE-JONES, C. Red blood cell diameters. London: Oxford
University Press, 1933. 82 p.
25. PRICE-JONES, C. The variation in sizes of red blood cells. Brit Med J,
v. 2, p. 1418-9, 1910.
26. RUZICKA, K. et al. The new hematology analyzer Sysmex XE-2100: performance evaluation of a novel white blood cell differential technology.
Arch Pathol Lab Med, v. 125, p. 391-6, 2001.
27. SIRECI, A.; SCHLABERG, R.; KRATZ, A. A method for optimizing and validating institution-speciic lagging criteria for automated cell counters. Arch Pathol Lab Med, v. 134, n. 10, p. 1528-33, 2010. 28. TKACHUK, D. C.; HIRSCHMANN, JV. Approach to the microscopic evaluation of blood and bone marrow. In: TKACHUK, D. C.; HIRSCHMANN, J. V. (Eds). Wintrobe’s atlas of clinical hematology. Marceline, Missouri:
Lippincott Williams & Wilkins, 2007. p. 275-328.
29. WALTERS, J. G.; GARRITY, P. F. RDW-SD and RDW-CV: their relationship to RBC distribution curves and anisocytosis. Sysmex J Int, v. 3, n. 1, p. 40-5, 1993.
MAILING ADDRESS
Samuel Ricardo Comar
Rua Padre Camargo, 280; Alto da Glória; CEP: 80060-240; Curitiba-PR, Brazil; Tel.: (41) 3360-7973; e-mail: [email protected].
detectar anisocitose (p < 0,05 vs. RDW-CV). Conclusão: RDW-CV, RDW-SD e MATH-1SD possuem desempenhos diferentes ao detectar anisocitose em lâmina conforme a faixa de VCM. São parâmetros que se complementam e que devem ser utilizados em conjunto na identiicação de heterogeneidade dos tamanhos eritrocitários.