*e-mail: [email protected]
Received: 21 August 2013 / Accepted: 03 June 2014
Evaluation of nuclear magnetic resonance spectroscopy variability
Felipe Rodrigues Barreto, Maria Concepción García Otaduy, Carlos Ernesto Garrido Salmon*
Abstract Introduction: The intrinsically high sensitivity of Magnetic Resonance Spectroscopy (MRS) causes considerable variability in metabolite quantii cation. In this study, we evaluated the variability of MRS in two research centers using the same model of magnetic resonance image scanner. Methods: Two metabolic phantoms were created to simulate magnetic resonance spectra from in vivo hippocampus. The phantoms were i lled with the same basic solution containing the following metabolites: N-acetyl-aspartate, creatine, choline, glutamate, glutamine and inositol. Spectra were acquired over 15 months on 26 acquisition dates, resulting in a total of 130 spectra per center. Results: The phantoms did not undergo any physical changes during the 15-month period. Temporal analysis from both centers showed mean metabolic variations of 3.7% in acquisitions on the same day and of 8.7% over the 15-month period. Conclusion: The low deviations demonstrated here, combined with the high specii city of Magnetic Resonance Spectroscopy, coni rm that it is feasible to use this technique in multicenter studies in neuroscience research.
Keywords Magnetic resonance spectroscopy, Quality assurance, Brain metabolites.
Introduction
Localized Magnetic Resonance Spectroscopy (MRS) is a nuclear magnetic resonance-based technique
that allows in vivo non-invasive measurements of
biomolecules. The feasibility of acquiring quantitative biochemical information from a certain region of
interest makes this technique widely used in magnetic
resonance (MR) centers, especially in neuroscience. Multicenter studies have a major role in increasing
the power of neuroscience studies because they allow
the acquisition of large data sets in short periods of
time and can also show that a method is robust and
has clinical potential. Several studies have analyzed MRS variability considering different aspects, such as voxel localization (Bovée et al., 1998; Burtscher et al.,
1999), quantii cation techniques (De Beer et al., 1998), spectral quality and specii c artifacts (Kreis, 2004). However, few studies have evaluated the spectral
stability over time over a period of months or years.
Despite the good specii city of MRS, its intrinsically
high sensitivity causes considerable variability,
which can affect data quality. The aim of this study was to evaluate the reproducibility of MRS and the
feasibility of using data from different facilities in a multicenter study. To avoid the inherent variability of
brain metabolism, phantoms were created to simulate
MR spectra from in vivo human hippocampus.
Methods
Two spherical glass phantoms of approximately 300 mL (Figure 1) and 8.5 cm in external diameter were created and fully i lled with a base solution
containing the metabolite concentrations described in Table 1.
Sodium salts (Na2HPO4 and NaH2PO4) were used
to create a buffer solution with a pH of 7.2, and sodium azide (NaN3) was used to prevent microorganism
proliferation. The metabolic concentrations of the phantom solution reproduced the basic neurochemical
proi le from a healthy human brain hippocampus
(Govindaraju et al., 2000).
Data acquisition was performed in two identical 3T MR scanners (Philips, Achieva) from two different
centers, named here as center A and center B. The
phantoms were placed inside a thermal container i lled with water during spectra acquisition to reduce
the chemical shifts created by temperature changes
and susceptibility effects. Water suppression was
achieved using a CHESS scheme. A PRESS sequence
with TE/TR=35/1500 ms, a bandwidth of 1725 Hz,
2048 points, 128 averages, second order shimming and
a volume of interest (VOI) of 40x15x10 mm3 placed
in the center of the phantom was used for spectra acquisition. One spectrum without water suppression was acquired for absolute concentration quantii cation.
The motivation for testing the protocol described above
was its common use in clinical routines. Spectra were acquired over 15 months in both centers, comprising 26 acquisition dates for a total of 130 spectra (5 spectra from each acquisition date without removing the
phantom from the scanner). The signal-to-noise ratio
automatically using the software LCModel. Briely, the software estimates the absolute concentrations using the unsuppressed water signal as an internal reference (Barreto and Salmon, 2010; Graaf, 2007). The absolute concentrations were not corrected for
relaxation effects because the main goal of this study
was not to evaluate variability from the quantiication process. The estimated concentrations were deined
as the mean concentrations from all acquisitions from
each center. The intra coeficient (Intra Coef., Table 2) was deined as the mean coeficient of variation (CV)
calculated from the CVs of each acquisition date and demonstrates the variability on each acquisition
date. The inter coeficient (Inter Coef., Table 2) was deined as the CV calculated from all the acquisitions
and demonstrates the technique’s variability over the
entire 15-month period. The maximum deviation (Max. deviation, Table 2) was deined as the maximum variation for each metabolite with respect to its mean
value over the entire analysis period.
Results
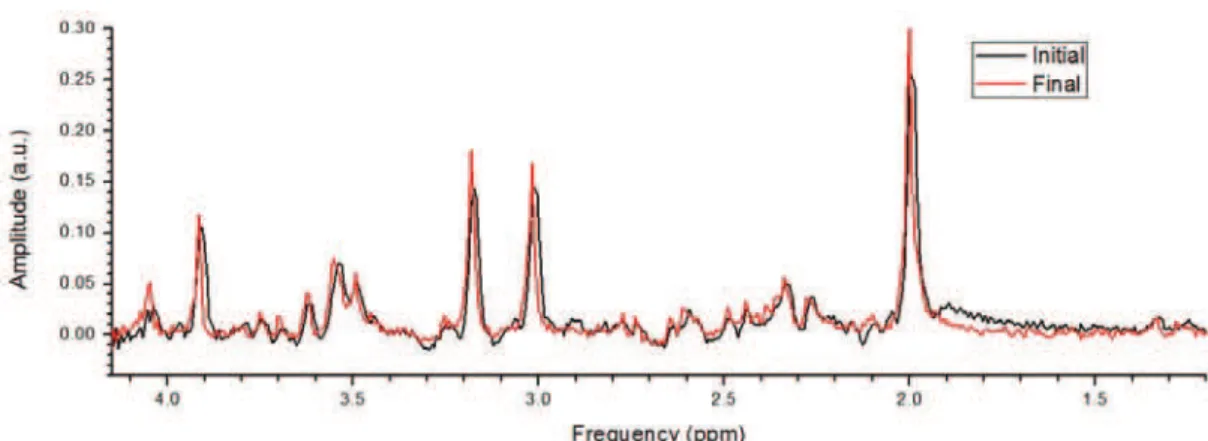
No metabolic changes were detected over the 15 months of analysis, and the phantom did not suffer
any physical changes, such as color changes or salt
precipitation, that would indicate deterioration of the solution. This result was conirmed by the quality of the spectra acquired, which did not change over time (Figure 2). The VOI positioning variability was 0.97, 0.28, and 0.68 cm in the anteroposterior, right-left,
and head-feet directions, respectively.
The mean SNR and FWHM for the spectra acquired in one of the centers were 16.3±2.1 and 0.025±0.011 ppm, respectively. No relationship between the SNR and FWHM was observed, suggesting that water suppression was possibly the main source of SNR variability (Figure 3). These indings were very similar between centers. The maximum deviation in the
Table 1. Metabolic concentrations present in the phantoms.
Chemical component Concentrations (mM)
Metabolites N-Acetylaspartate (NAA) 10
Creatine (Cr) 8
Choline (Cho) 2.5
Inositol (Ins) 8
Glutamate (Glu) 10
Glutamine (Gln) 5
Base solution components
Na2HPO 72
NaH2PO4 28
NaN3 15
Figure 1. Image of the multimetabolic phantom.
Table 2. Coeficient of variation (Inter Coef.) and maximum variation with respect to the mean value (Max. Deviation) from all measurements, the mean coeficient of variation from each acquisition date (Intra Coef.), the mean estimated concentrations and the phantom concentrations.
NAA Cho Cr Glu+Gln Glu Ins
Phantom conc. (mM) 10 2.5 6 15 10 8
Center A
Intra Coef. (%) 2.2 2.4 3.3 3.7 4.2 3.9
Inter Coef. (%) 6.5 9.8 10.9 8.1 7.8 12.4
Max. Deviation (%) 15.6 20.4 20.6 23.2 22.9 31.5
Estimated conc. (mM) 10.6 2.1 6.3 13.7 10.4 8.7
Center B
Intra Coef. (%) 2.4 2.7 4.3 7.1 4.6 3.7
Inter Coef. (%) 4.9 6 7.8 8.1 14 8.3
Max. Deviation (%) 11.8 12.7 19.1 40.1 29 21
Estimated conc. (mM) 10.3 2.6 6.9 10.5 8.8 7
Briely, the SNR from each spectrum was calculated by the software as the ratio of the difference between the maximum from the analysis window and the adjusted baseline and two times the square root of
the residue from the analysis (for more information
on the SNR and FWHM calculations, see Provencher,
2014). The standard parameters from LCModel
were used for data processing in one of the centers, while the other center optimized data processing
for in vitro spectra. Spectra quantiication and the
metabolites occurred on three different dates, which shows that statistical luctuations were responsible for the variability, not deterministic luctuations related
to the scanner functioning.
Spectra acquired on the same date resulted in
quantiications that showed Intra coeficients below 4.6%, except for the sum (Glu+Gln), which was 7.1% in one of the centers. Over 15 months, the quantiication of all spectra returned estimated concentrations with a maximum Inter coeficient of 14% for all metabolites.
A detailed description is presented in Table 2. The time series for the most relevant metabolites
for the clinical routine (NAA, Cho and Cr) were stable and showed no changes over time. Small luctuations in all three metabolites were visible
on different dates (Figure 4), possibly caused by factors affecting the entire spectrum. Thus, the use of internal references, i.e., normalization to Cr
or the water signal, allowed comparison between
different subjects and also removed the effect of
small longitudinal luctuations.
Discussion
The intra coeficient was smaller than the Inter coeficient for all metabolites because acquisitions from the same date were not affected by the variability due to different positionings and were less sensitive to
instabilities related to scanner functioning. Therefore,
a comparative study between patients and healthy subjects would beneit from smaller variability if the acquisitions from both groups were performed on the same date (due to the low Intra Coef.) and
over the shortest period possible (in order to avoid
a high Inter Coef.).
NAA was the most stable metabolite (Inter coeficients of 4.9% and 6.5%), and its estimated concentration was the closest to the real value (3 and 6% higher than the phantom’s concentration). The least accurate estimated concentration was Glu+Gln, with a mean value approximately 30% lower than the phantom’s concentration. Ins and Glu were the most variable, as shown by the Inter Coef. from centers
Figure 2. Spectra obtained during the irst (black line) and last (red line) acquisition from center A.
A and B, possibly due to intense J coupling, which makes quantiication less accurate.
Considerable differences for all metabolites
(ranging from 2 to 25%) were observed between the
absolute concentrations estimated in both centers.
These differences in calculated concentrations were higher than the Inter coeficient for certain metabolites (Glu, Glu+Gln, Ins and Cho) and were most likely
caused by different post-processing approaches in LCModel (example: to include or not the metabolites absent from the phantom solution in the LCModel spectral dataset). Thus, additional precautions should
be taken not only during acquisition but also during data processing in multicenter studies.
The maximum deviations of the metabolites were due to sporadic events on speciic dates; these high deviations were up to three times larger than the Inter coeficients. Larger maximum deviations were observed in Ins (31.5%) from center A and in the sum Glu+Gln (40.1%) from center B. The deviations from center A were larger than the deviations from center B, except for Glu and the sum Glu+Gln.
Two types of MRS artifacts were observed in a small number of spectra, as shown in Figure 5.
Figure 4. Time series from NAA, Cho and Cr over 15 months from center A.
The artifact from Figure 5a was caused by local inhomogeneities in the static magnetic ield and insuficient amplitude of the crusher gradients, which
combined can lead to the refocusing of spurious
echoes (Kreis, 2004). This artifact can be easily
removed during post-processing by using apodization
with an exponential function. Figure 5b shows an artifact caused by an insuficient amplitude of crusher gradients, which shifts the position of the maximum
amplitude and creates observable negative areas in
the bases of large resonances. Despite the presence of
these artifacts in the in vitro environment, these most
likely would not be visible in in vivo spectra due to
smaller signal amplitudes and shorter T2.
NAA is an abundant amino acid in the nervous
system, and it can be used as a neuronal density
indicator in the brain. During reversible incomplete ischemia (Brulatout et al., 1996), brain damage (De Stefano et al., 1995) and multiple sclerosis (Tsai and Coyle, 1995), it is frequently observed that the degree of neuronal loss correlates with the NAA decrease. Cho is an essential nutrient for the
synthesis of acetylcholine and the formation of cellular membranes. Cho concentration changes in the human brain can reveal abnormalities in membrane metabolism during ischemia, Alzheimer’s disease and
multiple sclerosis. In addition, increased Cho levels
are an excellent indicator of demyelination. Tumors
also show elevated Cho caused by the high rates of cell division, which increase the fractional volume
of membranes and phospholipids in a tissue. Cr is an essential component for energy metabolism in muscle tissue, but it is also present in smaller concentrations
in the brain. It is produced from phosphocreatine
after the transfer of an inorganic phosphate ion for
ATP synthesis, which plays an important role as a fast metabolic pathway for ATP synthesis during the irst seconds of increased energetic demand. The Cr
concentration in the brain remains highly stable at different ages and in many diseases (Saunders et al.,
1999), which makes it an excellent internal reference
for longitudinal studies (Govindaraju et al., 2000).
It is worth mentioning that the metabolic changes
caused by disease can be highly variable and depend
on the nature of the disease. In epilepsy, Colon et al. (2010) observed a 15% decrease in the NAA/Cr ratio
in the affected region in comparison to the contralateral
hemisphere. In tumors, Dowling et al.(2001) reported
that Cho can increase by up to 60%, and NAA can be reduced by 80%. Despite these high metabolic changes
in epilepsy and tumors, other diseases cause much milder changes that are on the edge of the detection threshold using MRS. Chang et al.(2003) reported a
5% decrease in the NAA/Cr ratio in the dorsolateral prefrontal cortexes of children with a family history of
bipolar disorder. Such metabolic changes are close to the intrinsic in vitro variability measured in this study.
A large sample size is required in order to accurately measure equivalent or inferior metabolic changes in comparison to the intrinsic variability reported here.
Artifacts were identiied on a few acquisition dates; however, their low occurrence and low amplitudes did not affect spectral quantiication. The in vitro
temporal stability of the metabolites decreased in
the order: NAA, Glu, Glu+Gln, Cho, Cr, Ins and NAA, Cho, Cr, Glu+Gln, Ins, Glu in centers A and B, respectively. The estimated NAA concentration was the most accurate, reliable and reproducible over
the experiments. Temporal analysis demonstrated the feasibility of comparing results from short- or
long-term multicenter studies, which beneit from the low
deviations of MRS.
Acknowledgements
The authors are indebted to Alberto Brunello for his assistance during phantom preparation and to the Brazilian funding agency FAPESP (projects:
2005/56464-9 and 2009/00270-2).
References
Barreto F, Salmon C. Quantiicação metabólica absoluta in vitro por espectroscopia de ressonância magnética. Revista Brasileira de Física Médica. 2010; 4(1):83-8.
Bovée W, Canese R, Decorps, M, Forssell-Aronsson E, Le Fur Y, Howe F, Karlsen O, Knun A, Kontaxis G, Kügel H, McLean M, Podo, F, Slotboom J, Vikhoff B, Ziegler A. Absolute metabolite quantiication by in vivo NMR spectroscopy: IV. Multicentre trial on MRSI localization tests. Magnetic Resonance Imaging. 1998; 16(9):1113-25. http://dx.doi.org/10.1016/S0730-725X(98)00120-9 Brulatout S, Méric P, Loubinoux I, Borredon J, Corrèze J, Roucher P, Gillet B, Bérenger G, Beloeil J, Tiffon B, Mispelter J, Seylaz J. A one-dimensional (proton and phosphorus) and two-dimensional (proton) in vivo NMR spectroscopic study of reversible global cerebral ischemia. Journal of Neurochemistry. 1996; 66(6):2491-9. PMid:8632174. http:// dx.doi.org/10.1046/j.1471-4159.1996.66062491.x Burtscher I, Johasson E, Holtas S, Stahlberg F. Quality assessment of localization technique performance in small volume in vivo 1H MR spectroscopy. Magnetic Resonance Imaging. 1999; 17(10):1511-9. http://dx.doi.org/10.1016/ S0730-725X(99)00076-4
or a MEG-focus using bilateral single voxels. Epilepsy Research. 2010; 89(1):148-53. PMid:20022471. http:// dx.doi.org/10.1016/j.eplepsyres.2009.11.007
De Beer R, Van den Boogaart A, Cady E, Graveron-Demilly D, Knin A, Langenberger K, Lindon J, Ohlhoff A, Serrai H, Wylezinska-Arridge M. Absolute metabolite quantiication by in vivo NMR spectroscopy: V. Multicentre quantitative data analysis trial on the overlapping background problem. Magnetic Resonance Imaging. 1998; 16(9):1127-37. http:// dx.doi.org/10.1016/S0730-725X(98)00121-0
De Stefano, N, Matthews P, Arnold D. Reversible decreases in N-acetylaspartate after acute brain injury. Magnetic Resonance in Medicine. 1995; 34(5):721-7. PMid:8544693. http://dx.doi.org/10.1002/mrm.1910340511
Dowling C, Bollen A, Noworolski S, McDermott M, Barbaro N, Day M, Henry R, Chang S, Dillon W, Nelson S, Vigneron D. Preoperative Proton MR Spectroscopy Imaging of brain tumors: correlation with histopathologic analysis of resection specimens. American Journal of Neuroradiology. 2001; 22:604-12. PMid:11290466. Graaf, R. In: Vivo NMR. Spectroscopy: principles and techniques. 2nd ed. Chichester: John Wiley & Sons; 2007.
Govindaraju V, Young K, Maudsley A. Proton NMR chemical shifts and coupling constants for brain metabolites. NMR in Biomedicine. 2000; 13(3):129-53. http:// dx.doi.org/10.1002/1099-1492(200005)13:3<129::AID-NBM619>3.0.CO;2-V
Kreis R. Issues of spectral quality in clinical 1H-magnetic resonance spectroscopy and a gallery of artifacts. NMR in Biomedicine. 2004; 17(6):361-81. PMid:15468083. http:// dx.doi.org/10.1002/nbm.891
Provencher S. LCModel & LCMgui user’s manual. 2014. [acesso em 2014 jun 06]. Disponível em: http://s-provencher. com/pub/LCModel/manual/manual.pdf.
Saunders D, Howe F, Van den Boogaart A, Grifiths J, Brown M. Aging of the adult human brain: in vivo quantiication of metabolite content with proton magnetic resonance spectroscopy. Journal of Magnetic Resonance Imaging. 1999; 9(5):711-6. http://dx.doi.org/10.1002/ (SICI)1522-2586(199905)9:5<711::AID-JMRI14>3.0.CO;2-3 Tsai G, Coyle JT. N-Acetylaspartate in neuropsychiatric disorders. Progress in Neurobiology. 1995; 46(5):531-40. http://dx.doi.org/10.1016/0301-0082(95)00014-M
Authors
Felipe Rodrigues Barreto, Carlos Ernesto Garrido Salmon*
Faculdade de Filosoia Ciências e Letras de Ribeirão Preto – FFCLRP, Universidade de São Paulo – USP, Av. Bandeirantes, 3900, Monte Alegre, CEP 14040-901, Ribeirão Preto, SP, Brasil.
Maria Concepción García Otaduy