Alleles with Multiple Sclerosis in Central East Sardinia
Roberta Pastorino1*, Cristina Menni1,2, Monserrata Barca3, Luisa Foco1, Valeria Saddi4, Giovanna Gazzaniga3, Raffaela Ferrai4, Luca Mascaretti5, Frank Dudbridge6, Carlo Berzuini6,7, Salvatore Bruno Murgia4, Maria Luisa Piras4, Anna Ticca4, Pier Paolo Bitti3, Luisa Bernardinelli1,6,7
1Dipartimento di Scienze Sanitarie Applicate e Psicocomportamentali, Universita` di Pavia, Pavia, Italy,2Dipartimento di Statistica, Universita` di Milano Bicocca, Milano, Italy,3Centro di Tipizzazione Tissutale, S.I.T., Presidio Ospedaliero S. Francesco, ASL Nu3, Nuoro, Italy,4Divisione di Neurologia, Presidio Ospedaliero S. Francesco, ASL Nu3, Nuoro, Italy,5Blood Transfusion Centre, San Gerardo Hospital, Monza, Italy,6MRC Biostatistics Unit, Institute of Public Health, University Forvie Site, Cambridge, United Kingdom,7Department of Pure Mathematics and Mathematical Statistics, University of Cambridge, Cambridge, United Kingdom
Abstract
The human leukocyte antigen (HLA) complex on chromosome 6p21 has been unambiguously associated with multiple sclerosis (MS). The complex features of the HLA region, especially its high genic content, extreme polymorphism, and extensive linkage disequilibrium, has prevented to resolve the nature of HLA association in MS. We performed a family based association study on the isolated population of the Nuoro province (Sardinia) to clarify the role of HLA genes in MS. The main stage of our study involved an analysis of the ancestral haplotypes A2Cw7B58DR2DQ1 and A30Cw5B18DR3DQ2. On the basis of a multiplicative model, the effect of the first haplotype is protective with an odds ratio (OR) = 0.27 (95% confidence interval CI 0.13–0.57), while that of the second is deleterious, OR 1.78 (95% CI 1.26–2.50). We found both class I (A, Cw, B) and class II (DR, DQ) loci to have an effect on MS susceptibility, but we saw that they act independently from each other. We also performed an exploratory analysis on a set of 796 SNPs in the same HLA region. Our study supports the claim that Class I and Class II loci act independently on MS susceptibility and this has a biological explanation. Also, the analysis of SNPs suggests that there are other HLA genes involved in MS, but replication is needed. This opens up new perspective on the study of MS.
Citation:Pastorino R, Menni C, Barca M, Foco L, Saddi V, et al. (2009) Association between Protective and DeleteriousHLAAlleles with Multiple Sclerosis in Central East Sardinia. PLoS ONE 4(8): e6526. doi:10.1371/journal.pone.0006526
Editor:Hitoshi Okazawa, Tokyo Medical and Dental University, Japan
ReceivedNovember 20, 2008;AcceptedJuly 5, 2009;PublishedAugust 5, 2009
Copyright:ß2009 Pastorino et al. This is an open-access article distributed under the terms of the Creative Commons Attribution License, which permits unrestricted use, distribution, and reproduction in any medium, provided the original author and source are credited.
Funding:This work was supported by a grant from the ‘‘Fondazione Cariplo’’, Project number 1428/2004, Milano, Italy, and by the Azienda Sanitaria Localeu3, Nuoro, Sardinia. The funders had no role in study design, data collection and analysis, decision to publish, or preparation of the manuscript.
Competing Interests:The authors have declared that no competing interests exist. * E-mail: [email protected]
Introduction
Multiple sclerosis (MS) is an autoimmune disease which mostly affects young people and which causes myelin destruction and neuronal cells degeneration leading the patient to a progressive disability. The disease has a preference for females and may manifest relapsing or progressive forms. Although the picture of genes involved in the susceptibility to MS is far to be completed, the Human Leukocyte Antigen (HLA) complex on chromosome 6p21 has been unambiguously associated with MS [1–8].
HLAClass I and Class II genes code proteins which are central in activating antigen-specific immune responses.HLAClass I and Class II proteins bind antigenic peptides and display them on the cell surface for recognition by CD8+or CD4+T-lymphocytes, respectively, thus activating the cellular immune response [9]. Many of the HLA associated disease are believed to be autoimmune [10]. Indeed among mature lymphocytes, there are many potential autoreactive T and B cells [11]. In MS, improper activation of the immune system in response to myelin antigens is thought to be a major cause of inflammatory deyemelination. Initially the association betweenHLAand MS was studied inHLA
Class I loci [12]. However, the attention turned toHLAClass II loci as Class I loci were presumed to be secondary to Linkage
Disequilibrium (LD) with disease predisposing Class II alleles [13– 15]. Consistent results were found particularly forHLA-DRB1and
HLA-DQB1. Indeed, theHLA-DR2 haplotype is one of the most reproduced findings in the genetics of the Major Histocompati-bility Complex (MHC) [3,5,6,13,16–18]. The HLA-DRB1*1501
allele, encompassed within theDR2 specificity, was found to be strongly associated with MS in North American, in North European Caucasian patients and in White Brazilians from Rio de Janeiro and from Sao Paolo [13,19–23], while theDRB1*1503
allele has been associated with MS in Mulattos from Sao Paolo and in Afro-American patients [21,24], but not in Afro-Brazilians from Rio de Janeiro [19,25]. TheDRB1*0301, and DRB1*0401
these haplotypes on disease is more modest than that of theHLA
-DR2haplotypes.
Recently, the possible importance ofHLAClass I genes in MS susceptibility has been reinvestigated and genetic association has been found. In Swedish patients,HLA-A3was positively associated to MS, independently on DRB1-15, while a negative association was found forHLA-A2[31,32]. The same association was reported in Tasmanians [33]. In Norwegian sporadic MS patients association was seen withHLA-A,HLA-B[34]. Indeed, the HLA
-A3 gene was found to increase the risk conferred by the HLA
-DRB1*1501haplotype. Mapping studies from the UK and the US identified a significant protective effect ofHLA-CW5[17].
Clearly, these results indicated that one allele for any givenHLA
locus, tends to exhibit different behaviours and confer resistance or susceptibility in response to different environmental or genetic backgrounds; within theDRB1gene there appears to be evidence for allelic heterogeneity particularly in non European populations [35]. This may help to refine the conceptual model of MS pathogenesis and suggests the possibility that a complextrans DRB1
allelic interactions may determine the balance between suscepti-bility and resistance [20].
Despite the numerous studies carries out so far, the complex features ofHLAregion, especially its high genic content, extreme polymorphism and extensive LD, has so far prevented the resolution of the nature ofHLAassociation in MS.
Here we present the results of a study on the association ofHLA
and MS carried out in the Nuoro province of Sardinia.
The Mediterranean island of Sardinia, and in particular the Nuoro province, is well suited to identifyHLAloci associated with MS. Indeed, it has an MS prevalence four/five times higher than the Italian mainland, registering 1 case per 500 inhabitants [36]. Isolation, genetic drift and perhaps selection have contributed to a genetic differentiation, and the HLA loci distribution is charac-terised by a very high number of rare haplotypes and by a small number of very frequent haplotypes [37]. Seven of them have a frequency higher than 0.85% [38] and thus are ancestral haplotypes. The two most frequent ancestral haplotypes are
A30Cw5B18DR3DQ2 (14.6%), which has the strongest LD observed in the world [39], andA2Cw7B58DR2DQ1(6.0%). Since ancestral haplotypes are highly conserved at least betweenHLA-B
andDR, they can be used as markers for all polymorphisms within the entire MHC region and allow mapping studies of known and unknown genes without requiring assumptions as to the mecha-nisms involved [40]. More information on ancestral haplotypes is given in the supporting material S1.
The main aim of our work is to identify which of the above mentioned alleles of HLA ancestral haplotypes confer genetic susceptibility/protection to MS in the population of the Nuoro province, Central East Sardinia. A second aim is to detect variants associated to MS independently onHLAlociA,B,Cw,DRandDQ
via an exploratory analysis on a set of 796 Single Nucleotide Polymorphisms (SNPs) located in theHLAregion.
Materials and Methods
Study Design
We carried out a family based association study. The study sample consisted of 628 individuals belonging to 213 small groups, which we called ‘‘nuclei’’. Each nucleus was ascertained around an MS case, or proband, extracted from the MS register running in the province of Nuoro since 1995. Diagnoses of MS were in accord with Poser’s criteria for clinical definite MS [41]. All individuals gave informed consent to their inclusion in this study, which was approved by the local Ethics Committee. The nuclei
were classified into 3 types: type-1 nuclei consisting of a proband and of his/her parents, plus occasionally the proband’s siblings (n = 69); type-2 nuclei consisting of the proband, of his/her spouse and of their children (n = 28), and type-3 nuclei consisting of a proband and of a corresponding unrelated control, matched by village of origin (n = 116). SNPs genotyping was performed at the Centre National de Genotypage, Evry, France, while HLA typing was done at ‘‘Centro di Tipizzazione Tissutale’’, Nuoro, Italy. Typing and quality control procedures are described in the supporting material S2.
Statistical Analysis
Pseudocases and pseudocontrols. To deal with different types of trios, we adopted the same approach described in Bernardinelliet al.[42] which we outline below.
In a classical trio study, an ascertained proband is genotyped along with his/her parents to form a proband-parent trio (Type 1). Our approach extends this design by including two further ascertainment schemes before called ‘‘nuclei’’. In the first, a proband is genotyped along his/her spouse and possibly their offspring (Type 2). In the second, an isolated proband is recruited into the study to act as an isolated case with a corresponding controls, matched by village of origin (Type 3).
We regard a family-based association study as a special case of matched case/control analysis, where each nucleus contributes pseudocases and pseudocontrols. In type 1 nuclei, we define the two pseudocases to be the two parental HLA haplotypes transmitted to the proband and the two pseudocontrols to be the remaining two parentalHLAhaplotypes. In type 2 nuclei, we define the pseudocases to be the twoHLAhaplotypes found in the proband and the pseudocontrols to be those found in the spouse. We can also define pseudocases and pseudocontrols at a genotype level, where the two transmitted haplotype form the pseudocase genotype and the two untransmitted haplotypes the pseudocontrol genotype. Likewise in type 2 and type 3 nuclei the genotype of the proband acts as pseudocase genotype and that of the spouse/ population control as pseudocontrol genotype. We pool the three types of nuclei into a joint analysis which looks for a phased genotype of variants that are more (or less) frequent in the pseudocase than in pseudocontrols. So, we perform the analysis at a genotype (phased) level where the genotype is formed by two haplotypes.
implemented in our Genetic Association Downstream Analysis (GADA) software that allows outputting all the configurations of the pseudocase and pseudocontrol genotype for each nucleus along with its posterior weight. We call the output the reconstruction table. Refer to our paper [42] for a formal description of the approach and an example of reconstruction table. The reconstruction table can be analyzed via unconditional weighted logistic regression as suggested by Cordell [44]. Our analysis does not maintain the matched design, and would be conservative under population stratification.
We extended this approach to allow for missing genotype data. When genotypes are missing, we exploit linkage disequilibrium in the local region to impute missing genotype calls using information from the neighbouring loci. Specifically, we include additional loci in the haplotype, whose contribution to disease risk is not of interest, but which provide information on missing genotypes of interest. The set of haplotypes consistent with a given unphased genotype is then expanded to include those with all possible completions of a missing genotype, while maintaining Mendelian consistency. This will attenuate the impact of biased missingness, for example when a SNP is preferentially missing heterozygotes among either cases or controls.
Analyses
Regression based association test. In the regression each pseudocase genotype can be considered as an independently observed response/covariate pair, where the response is 0 for pseudocase and 1 for a pseudocontrol and the covariate represents the wild type homozygote or the heterozygote or the mutant homozygote genotype. The use of the weighting option in packages such as STATA and R allows each configuration of the pseudocase/pseudocontrol genotype for each nucleus to enter in the logistic regression with a relative importance fixed by the corresponding posterior weight. This allows us to take into account the uncertainty in phase reconstruction and the imputation of missing data.
We analysed the data by fitting regression models both to investigate departure from the multiplicative model and to identify the effect model best fitting the data, and to perform hypothesis driven tests to study the association between HLA alleles and SNPs variants with MS.
We started by modelling the relationship between MS and the HLA genetics markers to try to underpin the transmission inheritance model. We fitted the weighted regression model at a genotype level by assuming the following genetic models: (a) not assuming any model, (b) a dominant, (c) a recessive and (d) multiplicative.
For fitting the model (a), we fitted a regression model to the genotype considered as a categorical (3 levels) variable, for model (b) we created a binary variable by aggregating the heterozygote with the mutant homozygote, for model (c) we created a binary variable by aggregating the wild type homozygote with the heterozygote genotype, and for model (d) we included the covariate representing the genotype (three categories) as a continuous variable.
We used a Likelihood Ratio Test (LRT) to check the departure from a multiplicative model (we compared model (d) with model (a)). If the p-value for the LRT is statistically significant, then we conclude that there is a departure from the multiplicative model. In this case we fitted the regression model by assuming the dominant and the recessive model and selecting the best model on the basis of the Wald test measuring the goodness of fit.
For whichever purpose the model was fitted, we estimated a parameter (log Odds Ratio - OR) measuring the effect of a given
genotype versus all the others on the risk of disease. We embedded in the regression model a permutation scheme (permuting the case/control label) that protects from the possibility that the weighting scheme used in the regression does not rigorously correspond to a likelihood of a specific model of the data. To compute p-values (which we call empirical p-values), we applied a permutation scheme to the Wald’s statistics of the genotype specific odds ratio parameter, to the Wald test measuring the goodness of fit of the model and to the likelihood ratio tests used to check (a) the departure from a multiplicative model and (b) to perform a conditional independent test (see below).
Independent Effect and Sole Variant Tests. Finally, we performed two hypothesis driven related conditional tests (independent effect and sole variant tests) to try to identify which variant, or variants, is solely and independently associated with the disease [45].
When we perform a sole variant test we compare a model including both ‘everything else’ and the ‘particular variant’ with a model including the ‘particular variant’. If the p-value for the LRT is not statistically significant we conclude that the particular variant is the ‘sole variant’, i.e. it is the only variant that matters. When we perform anindependent testwe compare via LRT a model in which ‘everything else’ and the ‘particular variant’ are included with a model including ‘everything else’. If a p-value for the LRT is statistically significant, then we conclude that this particular variant is associated independently on everything else. In both cases, ‘everything else’ refers to the local haplotypic background as determined by the markers under study.
We also performed a conditional independence test between the significant associated variants by comparing the model including both variants and a model including just one of the variant. A statistically significant p-value indicates that a variant is not conditionally independent on the disease given the other variant. The test compares via a LRT a model in which a variant that is statistically significant and a model in which further variant(s) are added. If the LRT is not statistically significant, this means that the second variable is conditionally independent on the disease, given the first one.
Studying the association between SNPs in theHLAregion and MS. The lack of SNP genotypes on all the individuals who are genotyped forHLAloci (see supplementary methods) led us to adopt a method that usesHLA loci as proxies in the association analysis in order to impute the missing SNPs. We performed the analysis using UNPHASED software [46].
This method estimates haplotype frequencies across all specified markers, including the SNPs of interest and the tagHLAalleles. However the model for disease risk includes an effect only for the SNPs of interest. When the data include some individuals with genotypes for allHLAand SNP markers, and others with genotypes for theHLAalleles only, the method uses a missing data likelihood to estimate the association for the SNPs of interest, using information from theHLAalleles when the SNP genotype is missing.
In order to distinguish the association of SNPs from their linkage disequilibrium with associationHLAalleles, we performed a conditional analysis allowing for theHLAassociation. Here the disease model includes effects for both the SNPs of interest and the
HLA alleles, but only the SNP effects are tested [47]. Again, a missing data likelihood is used to allow for both haplotype phase uncertainty and missing SNP data.
Results
structure of the nuclei are fully described in the supplementary material.
Analysis of the ancestral haplotypes
The ancestral haplotypes reconstruction in the Nuoro popula-tion shows that theA2Cw7B58DR2DQ1haplotype has a frequency of 4.3% while theA30Cw5B18DR3DQ2haplotype has a frequency of 15.2%. The frequencies of the alleles at each locus for every ancestral haplotype are reported in the supporting material S3. On the basis of a multiplicative model, the effect of the first haplotype versus all the others is protective, OR 0.27(95% Confidence Interval CI 0.13–0.57), while that of the second is deleterious, OR 1.78 (95% CI 1.26–2.50).
As to the effect model, the alleleB18is the only one showing a statistically significant departure from a multiplicative model (p = 0.006). The recessive model is the best fitting model (p = 0.0001) on the basis of the Wald test. The empirical p-values of the single locus marginal test show that for Class I loci, in the protective haplotype, onlyCwandBare significantly associated to MS, while in the deleterious haplotypeA, Cw,Bare all associated to the disease. For Class II loci, DR and DQ are significantly associated with the disease both for the protective and the deleterious haplotypes (Table 1).
We performed an analysis which aims at identifying which loci composing the deleterious and protective haplotype, can solely explain the association with the disease. We carried out on the
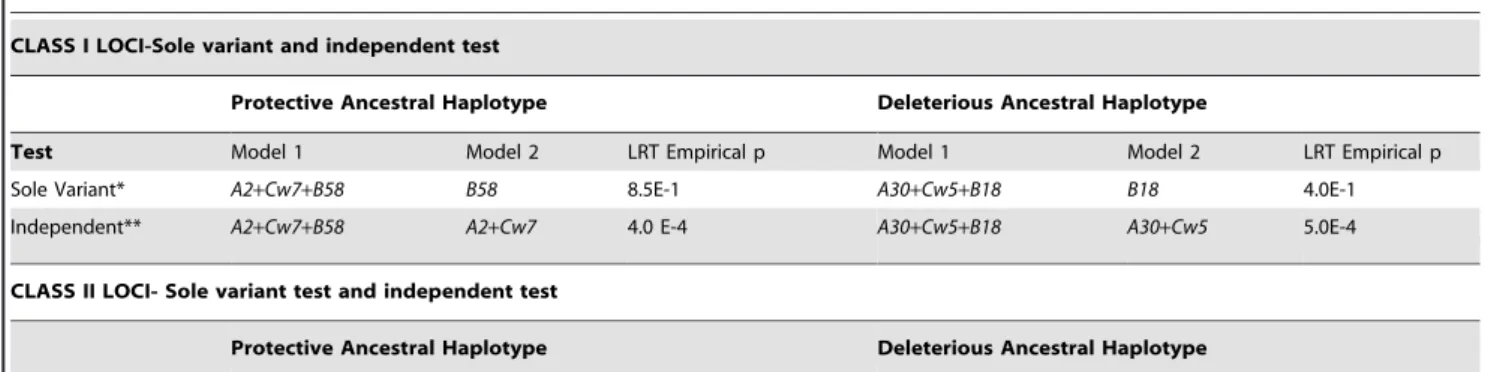
protective and thedeleterious haplotype separately considered a sole variant and independent test and a conditional independence test to investigate which loci within Class I and Class II could be considered as a single variant associated with the disease (Table 2). For the protective haplotype in Class I, B58 is a sole variant associated with MS; on the contrary, from the independence test B58 turns out to be independently associated with MS givenA2 Cw7(p-value of 0.0004 of the LRT).
In Class II, the sole variant isDQ1(empirical p-value of 0.74) and alsoDQ1is independently associated with MS givenDR2 (p-value = 0.001).
As for the deleterious haplotype, on the basis of the LRT we identify B18 as being the sole variant in Class I loci.B18is also independently associated with MS given A30 Cw5. As for the
deleterioushaplotype,DR2turns out to be a sole variant, but it is not independently associated to MS. The strong linkage disequilibri-um between theDR3andDQ2alleles (D’ = 0.98, R2= 0.75) does not allow us to identify which of the two loci is responsible of the association (Table 2).
To further pinpoint the specific allele contributing to MS susceptibility, a conditional independent test was carried out between the sole variants identified within Class I loci and the sole variant within Class II loci.
For theprotective haplotype,DQ1is not conditionally indepen-dent on MS given B58 and B58 viceversa. For the deleterious
haplotype, theDR3locus appears to be conditionally independent on the disease given theB18locus, whileDR3is not conditionally independent on MS givenB58(Table 3).
Within each haplotype, we also estimated the effect in terms of odds ratio of each sole variant in Class I adjusted for the effect of the sole variant in Class II loci versus all the other variants in Class I also adjusted for the effect of the sole variant in Class II loci, by fitting a model including both the sole variant in Class I and the sole variant in Class II.
In agreement with the conditional independent tests, within the protective haplotype, both the lociB58 and DQ1show a strong protective statistically significant effect while within the deleterious haplotype only the B18 locus show a statistically significant
deleterious effect. This further confirms that the DR3 locus is conditionally independent on the disease given theB18locus (for details see supporting material S4).
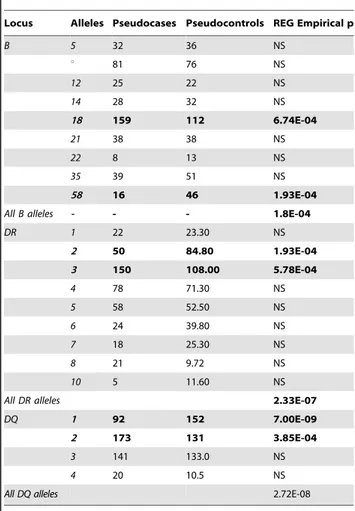
Investigating the effect of all alleles at theB,DRand DQ loci
We investigated the effect of the complete available set of alleles for B, DR, DQ loci and only alleles belonging to the ancestral haplotypes turned out to be significant (Table 4).
Since a strong association with an allele (for example protective) can mask the association with another allele whose effect is protective as well, we investigated the effect of the alleles other than those composing the ancestral haplotypes by performing an analysis that conditioned on a specific allele belonging to the ancestral haplotype. Details on the conditioning method are given in the supporting material S5. For theBlocus, the effect ofB58
emerges only after we condition on B18 and no other allele is significant; for theDRlocus,DR6is significant, with a protective effect, when conditioning onDR2only and when conditioning on both DR2 and DR3. Finally, conditioning on DQ2 (deleterious allele) makes the deleterious association effect with bothDQ3and
DQ4 to be detected. DQ1 remains significant also when conditioning onDQ2(supporting material S5).
SNP analysis
We now report the results of our exploratory analysis using a nominal significance level p,0.005 for unconditional tests. We studied the association between MS and 796 SNPs by using the program UNPHASED with the tag and missing options. We used the tag option to overcome the discrepancy between the individuals typed forHLAloci and the individuals typed for SNPs, the latter being much less numerous than those typed forHLA. We specified as tag markers the HLA loci composing the ancestral haplotypes which did not show a significant association with MS after conditioning on the most strongly associated loci. More specifically, we performed two analyses: (1) where tag markers are
HLA loci composing the protective ancestral haplotype (A2,Cw7,DR2) and (2) where tag markers areHLAloci composing the deleterious ancestral haplotype (A30,Cw5,DQ2). This choice was motivated by two considerations (1) we did not want to influence the association test for SNPs by choosing as tags the SNPs which turned out significantly associated with MS (2) we could not exclude that some SNPs associated with disease might be in LD with the protective alleles and some in LD with the deleterious allele. In each case we recoded each of theHLAloci into a binary variable, indicating the presence of the allele present on the extended protective (or deleterious) haplotype.
The analysis using the protective haplotype to predict missing SNPs leads to signals of association with SNPs located in the following genes: PSORS1C1 (Psoriasis susceptibility 1 candidate 1 - ENSG00000204540), TCF19 (Transcription factor 19 -ENSG00000137310), BAT2 (HLA-B associated transcript 2 -ENSG00000204469), BAT3 (HLA-B associated transcript 3 -ENSG00000204463),NOTCH4(Neurogenic locus notch homolog protein 4 - ENSG00000204301), ITPR3 (Inositol 1,4,5-triphos-phate receptor, type 3 - ENSG00000096433) and PACSIN1
(Protein kinase C and casein kinase substrate in neurons 1 -ENSG00000124507).
(Trans-porter 2,ATP-binding cassette, sub-family B - ENSG00000204267). The p-values of the null hypothesis of association are reported in the supporting material S6.
We finally tested whether the effect seen in these SNPs was due to the LD with the associatedHLAalleles. For this purpose we performed an analysis of the associated SNPs, conditioning on the
Table 1.A2Cw7B58DR2DQ1protective haplotype andA30Cw5B18DR3DQ2deleterious haplotype: genotype frequency of the allele composing the haplotypes in pseudocases, pseudocontrols, Odds ratio (OR) and its 95% Confidence Interval (CI), p-value of the Wald’s Test of association and empirical p-value computed under the multiplicative model.
Locus Genotypes Pseudocases N Pseudocontrols N OR 95% CI LRT p REG p LRT Empirical p
PROTECTIVE HAPLOTYPE:A2Cw7B58DR2DQ1
A 1.00E-01 9.90E-02 1.00E-01
X/X 117 98
X/2 72 91 0.80 0.63–1.04
2/2 19 19 0.65 0.39–1.08
Cw 7.10E-01 1.80E-02 3.80E-02
X/X 120.63 103.6
X/7 64 68.57 0.76 0.61–0.95
7/7 23.36 35.86 0.58 0.37–0.91
B 4.90E-01 1.30E-05 1.30E-05
X/X 193 168
X/58 15 35.66 0.33 0.20–0.55
58/58 0 4.34 0.11 0.04–0.30
DR 3.90E-01 9.25E-05 9.00E-05
X/X 162 135.5
X/2 44 63.34 0.54 0.39–0.73
2/2 2 9.19 0.28 0.15–0.54
DQ 2.00E-01 1.02E-07 1.00E-07
X/X 128 91.14
X/1 72 87.81 0.5 0.39–0.65
1/1 8 29.05 0.26 0.15–0.42
DELETERIOUS HAPLOTYPE:A30Cw5B18DR3DQ2
A 2.20E-01 2.00E-03 1.20E-03
X/X 102 131
X/30 86 62 1.54 1.17–2.03
30/30 17 12 2.37 1.36–4.10
Cw 2.50E-01 2.00E-03 1.26E-03
X/X 97.02 125.86
X/5 81.02 60.65 1.49 1.16–1.91
5/5 26.96 18.49 2.20 1.33–3.65
B 6.00E-03 1.80E-05 1.78E-05
X/X & X/18 170 195
18/18 35 10 4.01 2.13–7.58
DR 9.50E-01 1.00E-03 1.30E-03
X/X 94 119.7
X/3 80 67.5 1.50 1.17–1.91
3/3 31 17.8 2.34 1.37–3.64
DQ 2.40E-01 1.00E-03 9.20E-04
X/X 74 104.14
X/2 98 77.90 1.51 1.18–1.93
2/2 33 22.96 2.28 1.40–3.72
LRT p= p-value of the Likelihood Ratio Test for testing departure from a multiplicative model; REG p= unadjusted p-value of an unconditional logistic regression;
EMPIRICAL p= empirical p-value of the logistic regression obtained after permutation; Xrefers to all alleles other than the one taken into consideration.
alleles of the protective and deleterious haplotypes which are primarily associated (see the paragraph ‘‘Analysis of the ancestral haplotypes’’). For this analysis we used UNPHASED with the condition option together with the tag options just described. Conditioning on theB58 locus does not significantly change the SNP specific p-value, whereas conditioning onDQdoes and some SNPs become not significantly associated with MS. After conditioning, the genes, in which the statistically significant SNPs are located, are NOTCH4, BTNL2, ITPR3 and PACSIN1 HLA
-DOBandTAP2(supporting material S7).
Discussion
We carried out a family based association study to further investigate the role ofHLAregion (on Chromosome 6p21) in MS susceptibility. The contribution ofHLAgenes in MS pathogenesis is well established. Nowadays the association of MS with theHLA
-DR2 haplotype, comprising the HLA-DRB1*1501 and HLA -DRB5*0101 alleles, is the most replicated result among very different populations and a biological explanation was recently found for the strict co-occurrence of these alleles.DR2b protein (encoded byHLA-DRB1*1501) in fact promotes a strong immune
response, whileDR2aprotein (encoded byHLA-DRB5*0101) has an opposite and regulatory effect, inducing apoptosis of T cells. Both proteins participate in the immune response modulation and their interaction is a typical example of epistasis [48]. We choose to analyse the isolated population of Nuoro, Sardinia, which is characterised by a very high prevalence of MS (4–5 times higher than the Italian mainland) and by a small number of very frequent
HLA haplotypes. The two most frequent HLA haplotypes are
A30Cw5B18DR3DQ2(14.6%) andA2Cw7B58DR2DQ1(6%) which for their frequency are considered ancestral. To date, research on MS in Sardinia has been mainly focusing on the most frequent
HLAancestral haplotype and only on lociA, B, DR[36–38]. We have gone a step forward and collected information also on theCw
and DQ loci and hence we were able to consider the ‘‘entire’’ haplotype from A to DQ. We studied bothA30Cw5B18DR3DQ2
andA2Cw7B58DR2DQ1.
We were able to refine Bitti’s results [37] as we found that
A30Cw5B18DR3DQ2increases the risk of MS.B18is confirmed to be the most predictive single locus haplotype among Class I loci, while for Class II bothDR3 and DQ2 are positively associated: however we can’t differentiate between them as they are in a strong LD with each other.
Moreover, we found the second most frequent haplotype
A2Cw7B58DR2DQ1 to be protective. This result represents an interesting novelty regarding the association between the HLA
alleles and MS. LocusB(B58) is again the most significant single allele among Class I loci, whileDQ1among Class II loci.
As both Class I and Class II loci turned out to be associated with MS, we based our subsequent analysis on investigating whether they are associated independently. We confirmed previous results [31,49] of Class I loci having an independent effect on the risk of developing MS. Indeed our findings seem to support the claim that both Class I and Class II loci have an effect on MS susceptibility, but that they act independently from each other. The signal we found for Class I loci still exist even when conditioning on Class II loci and when taking LD into account. From a biological perspective this makes sense, as HLA Class II molecules are involved in the triggering of adaptive immune response and are expressed by Antigen Presenting Cells (APC), whileHLAClass I
Table 2.Sole variant and independent test carried out within the Class I and Class II loci of both protective and deleterious haplotype.
CLASS I LOCI-Sole variant and independent test
Protective Ancestral Haplotype Deleterious Ancestral Haplotype
Test Model 1 Model 2 LRT Empirical p Model 1 Model 2 LRT Empirical p
Sole Variant* A2+Cw7+B58 B58 8.5E-1 A30+Cw5+B18 B18 4.0E-1
Independent** A2+Cw7+B58 A2+Cw7 4.0 E-4 A30+Cw5+B18 A30+Cw5 5.0E-4
CLASS II LOCI- Sole variant test and independent test
Protective Ancestral Haplotype Deleterious Ancestral Haplotype
Test Model 1 Model 2 LRT Empirical p Model 1 Model 2 LRT Empirical p
Sole Variant* DR2+DQ1 DQ1 7.4E-1 DR3+DQ2 DQ2 4.9E-1
Independent** DR2+DQ1 DR2 1.0E-3 DR3+DQ2 DR3 2.9E-1
LRT EMPIRICAL p= empirical p-value of the likelihood ratio test obtained after permutation;*comparison of a model including both ‘everything else’ and the
‘particular variant’ with a model including the ‘particular variant’. If the p-value for the LRT is not statistically significant the particular variant is the ‘sole variant’.
**Comparison of a model in which ‘everything else’ and the ‘particular variant’ are included with a model including ‘everything else’. If a p-value for the LRT is statistically
significant, then this particular variant is associated independently on everything else. doi:10.1371/journal.pone.0006526.t002
Table 3.Conditional Independence Test: comparison of the model including both variants and the model including just one of the sole variants within the deleterious and the protective haplotype.
Conditional independence test
Protective Ancestral Haplotype Deleterious Ancestral Haplotype
Model 1 Model 2 LRT Empirical p Model 1 Model 2 LRT Empirical p B58+DQ1 B58 9.7 E-5 B18+DR3 B18 1.9E-1 B58+DQ1 DQ1 7.7 E-4 B18+DR3 DR3 1.0E-4 LRT EMPIRICAL p= empirical p-value of the likelihood ratio test obtained after permutation.
typically interact with cytotoxic CD8+T cells and are expressed by all nucleated cells. CD8+T cells are of central importance in lesion pathogenesis as they outnumber CD4+T cells in MS lesions [46]. Moreover,HLAClass I molecules are ligand for the KIR (Killer cell immunoglobulin-like receptors) protein family, expressed by Natural Killer (NK) cells in different combinations and amounts[50]. The role of NK cells in MS pathogenesis is controversial as they promote both deleterious and protective effects on neuronal cells[51]. Not much is known on the biological function of KIR receptors and for now no direct connection has been seen betweenKIRgenes and MS. However, they cluster on Chromosome 19q13.4, a region previously found in linkage studies to be associated with MS[52].
To further enrich our study, we finally performed an exploratory analysis on a set of 796 SNPs in the same HLA
region. Genomic regions containing SNPs associated with MS were investigated using Ensembl genome browser Release 50 at www.ensembl.org and HapMap - Phase 3 release data at www. hapmap.org. The bioinformatic screen showed that the majority of SNPs lie in genes with biological functions related to immune response or to neuronal signal transmission. This analysis does not
add conclusive evidence in favour of any of these genes, given its exploratory nature, howeverNOTCH4,BTNL2andBAK1deserve some remarks. TheNOTCHgene family participates in the control of myelination and T cells commitment. Previous studies indicate that developmental signal transduction pathways, involving
NOTCH1(Neurogenic locus notch homolog protein 1)activation, are re-expressed in damaged neurons in MS. The effect of this signalling is the inhibition of remyelination, which is restored after
NOTCH1inhibition [53]. Besides,NOTCH1controls the differen-tiation of naı¨ve T CD4+cells into T helper type 1 (Th1) cells. Th1 lymphocytes have a central role in immune response towards intracellular pathogens and their aberrant activity has been associated to the induction of certain autoimmune diseases, MS included [54].
NOTCH1directly inhibits the expression of T-box transcription factor TBX21, that encodes a transcription factor necessary to Th1 maturation [55]: as a consequence, Th1 maturation is inhibited [56].NOTCHproteins are thus interesting because their inhibition should provide a double beneficial effect against MS, promoting remyelination and decreasing the number of Th1 cells.
BTNL2 is a negative regulator of T cell proliferation. Some variants ofBTNL2andNOTCH4, different from those here tested, have been found associated with MS in two studies, but in both cases the association observed was considered secondary toHLA DR15influence [57,58].BAK1 accelerates apoptosis, contrasting the antiapoptotic molecule B-cell CLL/lymphoma 2 (BCL2). Apoptosis is an important feature in MS pathogenesis. Deregu-lation of this process can in fact promote both the survival of an excessive number of auto-reactive immune cells and the death of oligodendrocytes [59]. Nevertheless, apoptosis is necessary to physiological oligodendrocytes maturation [60].
However, as this was just an exploratory analysis, with many untyped data which were imputed conditioning onHLAloci, these last results need to be confirmed both on our population and replicated in others. Still, it appears that studyingHLAmain loci only could not be enough as otherHLAgenes may be involved and this could open new perspectives on the study of MS. In this perspective, Sardinia and especially the Nuoro population provide an important contribution. Indeed, the general population of Sardinia has been shown to have similar levels of LD to outbred populations, while isolated villages within Sardinia have substan-tially increased levels of LD compared to cosmopolitan popula-tions. The province of Nuoro is one of the oldest isolates founded over 3000 years ago. The subsequent isolation of this area has likely contributed to its divergence from the other European populations in terms of allele frequencies, yet its age has afforded many opportunities for recombination to occur between markers. Service et al. [61] suggest that, considering the length of the LD maps only, the association analyses in samples from Sardinia would require at least 30% fewer markers than studies in outbred population. For this reason, in this first part of the study LD helps us to identify, more easily, the region which contains the genes associated with MS but fine mapping is harder as a result and the power of our conditional tests is affected by the strong LD in this population.
Supporting Information
Supporting Material S1 Ancestral haplotypes.
Found at: doi:10.1371/journal.pone.0006526.s001 (0.03 MB DOC)
Supporting Material S2 HLA typing, SNP typing and quality control; % Call rate; SNP genotyping.
Table 4.Association betweenB,DRandDQloci with MS.
Locus Alleles Pseudocases Pseudocontrols REG Empirical p
B 5 32 36 NS
u 81 76 NS
12 25 22 NS
14 28 32 NS
18 159 112 6.74E-04
21 38 38 NS
22 8 13 NS
35 39 51 NS
58 16 46 1.93E-04
All B alleles - - - 1.8E-04
DR 1 22 23.30 NS
2 50 84.80 1.93E-04
3 150 108.00 5.78E-04
4 78 71.30 NS
5 58 52.50 NS
6 24 39.80 NS
7 18 25.30 NS
8 21 9.72 NS
10 5 11.60 NS
All DR alleles 2.33E-07
DQ 1 92 152 7.00E-09
2 173 131 3.85E-04
3 141 133.0 NS
4 20 10.5 NS
All DQ alleles 2.72E-08
The table reports the number of pseudocases and pseudocontrols and empirical p-value of the alleles. Alleles are tested against all other alleles in the same class Bucontains the alleles (7,8,13,15,16,27,37,40) that have a frequency,4%.
REG Empirical p= empirical p-value of the logistic regression obtained after permutation.
NS= Not Significant.
Found at: doi:10.1371/journal.pone.0006526.s002 (0.04 MB DOC)
Supporting Material S3 Frequency of A2Cw7B58DR2DQ1 and of A30Cw5B18DR3DQ2 haplotypes and their composing Class I and Class II alleles in pseudocases, pseudocontrols and in the whole population.
Found at: doi:10.1371/journal.pone.0006526.s003 (0.04 MB DOC)
Supporting Material S4 Effect of Class I locus adjusted for the effect of the Class II locus, OR and its 95% CI.
Found at: doi:10.1371/journal.pone.0006526.s004 (0.03 MB DOC)
Supporting Material S5 Empirical p-value for the null hypothesis of association for the alleles at the B,DR and DQ loci after conditioning for ancestral haplotypes alleles.
Found at: doi:10.1371/journal.pone.0006526.s005 (0.04 MB DOC)
Supporting Material S6 MS and SNPs with tag markers alleles composing the protective ancestral haplotypes: significant findings reported.
Found at: doi:10.1371/journal.pone.0006526.s006 (0.04 MB DOC)
Supporting Material S7 MS and SNPs with tag markers alleles composing the deleterious ancestral haplotypes: significant findings reported.
Found at: doi:10.1371/journal.pone.0006526.s007 (0.05 MB DOC)
Acknowledgments
We thank all patients and their relatives and all the other volunteers who donated their samples. We also thank Stefania Sanna, Orsola Porcu, for their help in the data collection, Cristina Montomoli, Giancarla Motta and Valentina Cipriani for their contribution to the early stages of the project, the ‘‘Associazione Donata Marchi’’ and AISM for their help in data collection.
Author Contributions
Conceived and designed the experiments: RP LF LM PPB LB. Performed the experiments: MB GG PPB. Analyzed the data: RP CM LF LB. Contributed reagents/materials/analysis tools: FD CB. Wrote the paper: RP CM LB. Responsible for sample recruitment and assignment of clinical diagnosis: VS RF SBM MLP AT. Revised the manuscript: LM CB. Responsible for the biological bank: PB.
References
1. Barcellos LF, Oksenberg JR, Begovich AB, Martin ER, Schmidt S, et al. (2003) HLA-DR2 dose effect on susceptibility to multiple sclerosis and influence on disease course. Am J Hum Genet 72: 710–716.
2. Dyment DA, Herrera BM, Cader MZ, Willer CJ, Lincoln MR, et al. (2005) Complex interactions among MHC haplotypes in multiple sclerosis: suscepti-bility and resistance. Hum Mol Genet 14: 2019–2026.
3. Jersild C, Fog T (1972) Histocompatibility (HL-A) antigens associated with multiple sclerosis. Acta Neurol Scand Suppl 51: 377.
4. Marrosu MG, Murru MR, Costa G, Murru R, Muntoni F, et al. (1998) DRB1-DQA1-DQB1 loci and multiple sclerosis predisposition in the Sardinian population. Hum Mol Genet 7: 1235–1237.
5. Olerup O, Hillert J (1991) HLA class II-associated genetic susceptibility in multiple sclerosis: a critical evaluation. Tissue Antigens 38: 1–15.
6. Stewart GJ, Teutsch SM, Castle M, Heard RN, Bennetts BH (1997) HLADR, -DQA1 and -DQB1 associations in Australian multiple sclerosis patients. Eur J Immunogenet 24: 81–92.
7. Ramagopalan SV, Ebers GC (2008) Genes for multiple sclerosis. Lancet 371: 283–285.
8. McElroy JP, Oksenberg JR (2008) Multiple sclerosis genetics. Curr Top Microbiol Immunol 318: 45–72.
9. Klein J, Sato A (2000) The HLA system. First of two parts. N Engl J Med 343: 702–709.
10. Sercarz EE, Datta SK (1994) Mechanisms of autoimmunization: perspective from the mid-90s. Curr Opin Immunol 6: 875–881.
11. Thorsby E (1997) Invited anniversary review: HLA associated diseases. Hum Immunol 53: 1–11.
12. Jersild C, Svejgaard A, Fog T (1972) HL-A antigens and multiple sclerosis. Lancet 1: 1240–1241.
13. Lincoln MR, Montpetit A, Cader MZ, Saarela J, Dyment DA, et al. (2005) A predominant role for the HLA class II region in the association of the MHC region with multiple sclerosis. Nat Genet 37: 1108–1112.
14. Olerup O, Carlsson B, Wallin J, Olsson T, Fredrikson S, et al. (1987) Genomic HLA-typing by RFLP-analysis using DR beta and DQ beta cDNA probes reveals normal DR-DQ linkages in patients with multiple sclerosis. Tissue Antigens 30: 135–138.
15. Vartdal F, Sollid LM, Vandvik B, Markussen G, Thorsby E (1989) Patients with multiple sclerosis carry DQB1 genes which encode shared polymorphic amino acid sequences. Hum Immunol 25: 103–110.
16. (2003) A meta-analysis of whole genome linkage screens in multiple sclerosis. J Neuroimmunol 143: 39–46.
17. Yeo TW, De Jager PL, Gregory SG, Barcellos LF, Walton A, et al. (2007) A second major histocompatibility complex susceptibility locus for multiple sclerosis. Ann Neurol 61: 228–236.
18. Hafler DA, Compston A, Sawcer S, Lander ES, Daly MJ, et al. (2007) Risk alleles for multiple sclerosis identified by a genomewide study. N Engl J Med 357: 851–862.
19. Alves-Leon SV, Papais-Alvarenga R, Magalhaes M, Alvarenga M, Thuler LC, et al. (2007) Ethnicity-dependent association of HLA DRB1-DQA1-DQB1 alleles in Brazilian multiple sclerosis patients. Acta Neurol Scand 115: 306–311.
20. Barcellos LF, Sawcer S, Ramsay PP, Baranzini SE, Thomson G, et al. (2006) Heterogeneity at the HLA-DRB1 locus and risk for multiple sclerosis. Hum Mol Genet 15: 2813–2824.
21. Brum DG, Barreira AA, Louzada-Junior P, Mendes-Junior CT, Donadi EA (2007) Association of the HLA-DRB1*15 allele group and the DRB1*1501 and DRB1*1503 alleles with multiple sclerosis in White and Mulatto samples from Brazil. J Neuroimmunol 189: 118–124.
22. Sawcer S, Ban M, Maranian M, Yeo TW, Compston A, et al. (2005) A high-density screen for linkage in multiple sclerosis. Am J Hum Genet 77: 454–467. 23. Willer CJ, Dyment DA, Cherny S, Ramagopalan SV, Herrera BM, et al. (2007) A genome-wide scan in forty large pedigrees with multiple sclerosis. J Hum Genet 52: 955–962.
24. Oksenberg JR, Barcellos LF, Cree BA, Baranzini SE, Bugawan TL, et al. (2004) Mapping multiple sclerosis susceptibility to the HLA-DR locus in African Americans. Am J Hum Genet 74: 160–167.
25. Caballero A, Alves-Leon S, Papais-Alvarenga R, Fernandez O, Navarro G, et al. (1999) DQB1*0602 confers genetic susceptibility to multiple sclerosis in Afro-Brazilians. Tissue Antigens 54: 524–526.
26. Marrosu MG, Murru MR, Costa G, Cucca F, Sotgiu S, et al. (1997) Multiple sclerosis in Sardinia is associated and in linkage disequilibrium with HLA-DR3 and -DR4 alleles. Am J Hum Genet 61: 454–457.
27. Dyment DA, Ebers GC, Sadovnick AD (2004) Genetics of multiple sclerosis. Lancet Neurol 3: 104–110.
28. Modin H, Olsson W, Hillert J, Masterman T (2004) Modes of action of HLA-DR susceptibility specificities in multiple sclerosis. Am J Hum Genet 74: 1321–1322.
29. Ramagopalan SV, Morris AP, Dyment DA, Herrera BM, DeLuca GC, et al. (2007) The inheritance of resistance alleles in multiple sclerosis. PLoS Genet 3: 1607–1613. 30. Fernando MM, Stevens CR, Walsh EC, De Jager PL, Goyette P, et al. (2008) Defining the role of the MHC in autoimmunity: a review and pooled analysis. PLoS Genet 4: e1000024.
31. Brynedal B, Duvefelt K, Jonasdottir G, Roos IM, Akesson E, et al. (2007) HLA-A confers an HLHLA-A-DRB1 independent influence on the risk of multiple sclerosis. PLoS ONE 2: e664.
32. Fogdell-Hahn A, Ligers A, Gronning M, Hillert J, Olerup O (2000) Multiple sclerosis: a modifying influence of HLA class I genes in an HLA class II associated autoimmune disease. Tissue Antigens 55: 140–148.
33. Burfoot RK, Jensen CJ, Field J, Stankovich J, Varney MD, et al. (2008) SNP mapping and candidate gene sequencing in the class I region of the HLA complex: searching for multiple sclerosis susceptibility genes in Tasmanians. Tissue Antigens 71: 42–50.
34. Harbo HF, Lie BA, Sawcer S, Celius EG, Dai KZ, et al. (2004) Genes in the HLA class I region may contribute to the HLA class II-associated genetic susceptibility to multiple sclerosis. Tissue Antigens 63: 237–247.
35. Sawcer S, Compston A (2006) Multiple sclerosis: light at the end of the tunnel. Eur J Hum Genet 14: 257–258.
37. Bitti PP, Murgia BS, Ticca A, Ferrai R, Musu L, et al. (2001) Association between the ancestral haplotype HLA A30B18DR3 and multiple sclerosis in central Sardinia. Genet Epidemiol 20: 271–283.
38. Contu L, Arras M, Carcassi C, La Nasa G, Mulargia M (1992) HLA structure of the Sardinian population: a haplotype study of 551 families. Tissue Antigens 40: 165–174.
39. Contu L, Arras M, Mulargia M, La Nasa G, Carcassi C, et al. (1992) Study of HLA segregation in 479 thalassemic families. Tissue Antigens 39: 58–67. 40. Degli-Esposti MA, Abraham LJ, McCann V, Spies T, Christiansen FT, et al.
(1992) Ancestral haplotypes reveal the role of the central MHC in the immunogenetics of IDDM. Immunogenetics 36: 345–356.
41. Poser CM, Brinar VV (2001) Diagnostic criteria for multiple sclerosis. Clin Neurol Neurosurg 103: 1–11.
42. Bernardinelli L, Murgia SB, Bitti PP, Foco L, Ferrai R, et al. (2007) Association between the ACCN1 gene and multiple sclerosis in Central East Sardinia. PLoS ONE 2: e480.
43. Stephens M, Smith NJ, Donnelly P (2001) A new statistical method for haplotype reconstruction from population data. Am J Hum Genet 68: 978–989. 44. Cordell HJ (2006) Estimation and testing of genotype and haplotype effects in
case-control studies: comparison of weighted regression and multiple imputation procedures. Genet Epidemiol 30: 259–275.
45. Purcell S, Daly MJ, Sham PC (2007) WHAP: haplotype-based association analysis. Bioinformatics 23: 255–256.
46. Dudbridge F (2008) Likelihood-based association analysis for nuclear families and unrelated subjects with missing genotype data. Hum Hered 66: 87–98. 47. Cordell HJ, Clayton DG (2002) A unified stepwise regression procedure for
evaluating the relative effects of polymorphisms within a gene using case/control or family data: application to HLA in type 1 diabetes. Am J Hum Genet 70: 124–141.
48. Gregersen JW, Kranc KR, Ke X, Svendsen P, Madsen LS, et al. (2006) Functional epistasis on a common MHC haplotype associated with multiple sclerosis. Nature 443: 574–577.
49. Sawcer S, Compston A (2006) Multiple sclerosis: light at the end of the tunnel. Eur J Hum Genet 14: 257–258.
50. Gardiner CM (2008) Killer cell immunoglobulin-like receptors on NK cells: the how, where and why. Int J Immunogenet 35: 1–8.
51. Morandi B, Bramanti P, Bonaccorsi I, Montalto E, Oliveri D, et al. (2008) Role of natural killer cells in the pathogenesis and progression of multiple sclerosis. Pharmacol Res 57: 1–5.
52. Oksenberg JR, Baranzini SE, Barcellos LF, Hauser SL (2001) Multiple sclerosis: genomic rewards. J Neuroimmunol 113: 171–184.
53. John GR, Shankar SL, Shafit-Zagardo B, Massimi A, Lee SC, et al. (2002) Multiple sclerosis: re-expression of a developmental pathway that restricts oligodendrocyte maturation. Nat Med 8: 1115–1121.
54. Zhu J, Paul WE (2008) CD4 T cells: fates, functions, and faults. Blood 112: 1557–1569.
55. Szabo SJ, Kim ST, Costa GL, Zhang X, Fathman CG, et al. (2000) A novel transcription factor, T-bet, directs Th1 lineage commitment. Cell 100: 655–669. 56. Minter LM, Turley DM, Das P, Shin HM, Joshi I, et al. (2005) Inhibitors of gamma-secretase block in vivo and in vitro T helper type 1 polarization by preventing Notch upregulation of Tbx21. Nat Immunol 6: 680–688. 57. Traherne JA, Barcellos LF, Sawcer SJ, Compston A, Ramsay PP, et al. (2006)
Association of the truncating splice site mutation in BTNL2 with multiple sclerosis is secondary to HLA-DRB1*15. Hum Mol Genet 15: 155–161. 58. Duvefelt K, Anderson M, Fogdell-Hahn A, Hillert J (2004) A NOTCH4
association with multiple sclerosis is secondary to HLA-DR*1501. Tissue Antigens 63: 13–20.
59. Zipp F (2000) Apoptosis in multiple sclerosis. Cell Tissue Res 301: 163–171. 60. Osterhout DJ, Marin-Husstege M, Abano P, Casaccia-Bonnefil P (2002)
Molecular mechanisms of enhanced susceptibility to apoptosis in differentiating oligodendrocytes. J Neurosci Res 69: 24–29.