Revista Brasileira de Hematologia e Hemoterapia
Brazilian Journal of Hematology and Hemotherapy
www.rbhh.org
*Corresponding author at: Rd. Cmte. J. R. Barros, Km 225, Instituto Lauro de Souza Lima, 17034-971, Bauru, SP, Brazil. E-mail address: [email protected] (F.C.S. Santana).
1516-8484/$ - see front matter © 2014 Associação Brasileira de Hematologia, Hemoterapia e Terapia Celular. Published by Elsevier Edi-tora Ltda. All rights reserved.
DOI: 10.5581/1516-8484.20140026
Original article
Frequency of alleles and haplotypes of the human leukocyte
antigen system in Bauru, São Paulo, Brazil
Luana de Cassia Salvadori, Fabiana Covolo de Souza Santana*,
Elaine Valim Camarinha Marcos
Instituto Lauro de Souza Lima (ILSL), Bauru, SP, Brazil
A R T I C L E I N F O
Article history:
Received 9 April 2013 Accepted 18 December 2013
Keywords:
HLA antigens Gene frequency Polymorphism, genetic Transplantation
A B S T R A C T
Background: HLA allele identification is used in bone marrow transplant programs as HLA compatibility between the donor and recipient may prevent graft rejection.
Objective: This study aimed to estimate the frequency of alleles and haplotypes of the HLA system in the region of Bauru and compare these with the frequencies found in other regions of the country.
Methods: HLA-A*, HLA-B*, and HLA-DRB1* allele frequencies and haplotypes were analyzed in a sample of 3542 volunteer donors at the National Registry of Voluntary Bone Marrow Donors (REDOME) in Bauru. HLA low resolution typing was performed using reverse line blot with the Dynal Reli™ SSO-HLA Typing Kit and automated Dynal AutoReli™48 device (Invitrogen, USA).
Results: Twenty, 36, and 13 HLA-A*, HLA-B*, and HLA-DRB1* allele groups, respectively, were identified. The most common alleles for each locus were HLA-A*02, HLA-B*35, and HLA-DRB1*07. The most frequent haplotype was A*01-B*08-DRB1*03. Allele and haplotype frequencies were compared to other regions in Brazil and the similarities and differences among populations are shown.
Conclusion: The knowledge of the immunogenic profile of a population contributes to the comprehension of the historical and anthropological aspects of different regions. Moreover, this helps to find suitable donors quickly, thereby shortening waiting lists for transplants and thus increasing survival rates among recipients.
Introduction
The major histocompatibility complex (MHC) is a system composed by genes that encode the human leukocyte antigen (HLA) molecules.1,2 HLA genes are part of a polygenic complex located on the short arm of chromosome 6 in the 6p21.3 region.1,3 HLA genes are expressed by all nucleated cells of the human body. The main function of this system is the presentation of antigenic peptides to T lymphocytes in order to trigger the proliferation and differentiation of cells capable of activating a speciic immunological response.2,3
The HLA class I molecules (HLA-A, HLA-B, and HLA-C) display endogenous antigens to CD8+ cytotoxic T lymphocytes, while the HLA class II molecules (DR, HLA-DQ and HLA-DP) present exogenous antigens to CD4+ T-helper lymphocytes.2,3
HLA molecules differ among individuals, and these differences are associated with solid organ rejection after organ transplantation as well as with graft-versus-host disease (GVHD) after bone marrow transplantation. The identiication of HLA alleles is the main tool used in bone marrow transplant programs as HLA compatibility between the donor and recipient is necessary to prevent graft rejection.4
In Brazil, the National Voluntary Bone Marrow Donor Registry (REDOME) was founded in 1993 with the aim of gathering data of volunteer donors who want to donate bone marrow to patients requiring a transplant.5,6 REDOME, with about 3 million people registered, is currently considered the third largest bone marrow donor program; the United States has the world’s largest bank followed by Germany.7,8
Similar to REDOME, the National Registry of Bone Marrow Recipients (REREME) stores information about patients waiting for bone marrow transplants. These patients are added to the registry when a matching donor is unavailable.5,6
REDOME is important because it increases the chance of inding a matching for a particular recipient. In Brazil, the probability of genetic compatibility among unrelated donors is small due to miscegenation.8 The probability of inding a recipient compatible with an unrelated donor is about 1:100,000,9 and the probability of a sibling being compatible is 25%.10
The genetic characterization of individuals leads to a rapid selection of unrelated donors for recipients; thus, waiting lists for transplantation and possibly graft rejection decreases, thereby improving patient survival.11
In addition to the role in transplantation and susceptibility or resistance to diseases, HLA is also important for anthropological studies as the frequency of alleles varies between ethnic groups. For example, HLA-B*35 is most often found in Caucasians, whereas HLA-B*15 is common in Africans.
The population of Brazil is a good example of miscegenation. Colonization and immigration have made the population diverse; the genetic information of native Amerindians has mixed with that of Europeans and Africans brought to Brazil as slaves.11,12 Immigrants from other parts of the world, such as Germans, Arabs, Italians, Spanish and Japanese have
since come to Brazil to ind better living conditions; these immigrants have helped constitute the new genetic proile of Brazilians.13
According to the demographic census carried out by the Brazilian Institute for Geography and Statistics (IBGE), the population of the city of Bauru in 2010 was estimated to be 343,937;14 the majority of city residents were White (70.66%), followed by Mulatto (22.69%), Black (4.95%), Asian (1.57%), and Amerindian (0.13%).15 Until 1850, the region was inhabited solely by Amerindians, but pioneers from Minas Gerais and São Paulo explored this land but did not adopt the slavery system which was prevalent in other regions of the state until 1868.16
The distribution of HLA variants has been analyzed in different Brazilian regions and throughout the world. Monte et al.12 established the frequencies of HLA alleles in Teresina, Piauí and concluded that multiracial people, the dominant ethnic group in this region, have predominately Caucasian and African genes with a small proportion of Amerindian genes.
Bortolotto et al.11 compared the HLA alleles of ethnic groups from different regions of Brazil and noticed some similarities and differences among them. The HLA-A*02 allele was common in populations from Rio Grande do Sul and Paraná, regions mostly populated by Caucasians. The frequency of this allele was also high in mulattos from Piauí;11,12 however, the HLA-B*15 allele, common in Black people, was found in Caucasians, Blacks, and Mulattos.11
Middleton et al.17 and Williams et al.18 analyzed the distribution of the HLA-A and HLA-B alleles, respectively, in diverse populations including Brazilians. Both studies showed common alleles among the studied populations, thus indicating the extent of miscegenation possibly due to migration.17,18
The characterization and determination of population allele frequencies is important because this can identify whether these predominant alleles exist in a speciic region, if they are shared with other populations and if they are related to disease susceptibility or protection.17,19
Through HLA class I A* and -B*) and class II (HLA-DRB1*) allele typing from the registry of volunteers (REDOME) of Bauru, São Paulo, we aimed to estimate the frequencies of HLA alleles and haplotypes prevalent in the region, and to compare the frequencies of these alleles to those of other regions of Brazil.
Methods
Population
Among donors listed in the REDOME from 2008 to 2012, 3542 volunteer bone marrow donors were selected and evaluated at the Immunogenetics Laboratory of the Instituto Lauro de Souza Lima in Bauru. Volunteers were evaluated according to gender, age, marital status, ethnic group and HLA type.
Variable n %
Gender
Female 1941 54.80
Male 1600 45.17
unavailable 1 0.03
Age (years old) 18 to 55 Median 30
Marital status
Single 1743 49.21
Married 1498 42.29
Divorced 217 6.13
Widower 27 0.76
Stable union 13 0.37
Others 44 1.24
Ethnicity
White 3056 86.28
Black 165 4.66
Mulatto 158 4.46
Asian 50 1.14
Others 113 3.19
Table 1 - Gender, age, marital status and ethnicity of donors from Bauru registered in REDOME (n = 3542). (n = 2775),20 Rio Grande do Sul (n = 5000),11 Minas Gerais (n = 1000),20 Pernambuco (n = 101),20 and Piauí (n = 97)12 were used to compare HLA frequencies.
The study was approved by the Ethics Committee of the Instituto Lauro de Souza Lima, Bauru.
Extraction of DNA and HLA typing
DNA was isolated by the salting-out method using venous blood kept in ethylenediaminetetraacetic acid (EDTA) anticoagulant.21
The typing of HLA class I alleles (loci A* and B*) and class II alleles (locus DRB1*) was performed by the reverse line blot technique at a low resolution (Dynal Reli™ SSO-HLA Typing Kit and Dynal AutoReli™48, Invitrogen, USA).
The DNA samples were ampliied using speciic biotinylated primers to each HLA region (0.5 µM) using 20 mM of Tris-HCl solution (with 30% glycerol and 100 mM KCl), DNTPs (400 µM of dATP, dCTP, and dGTP; 800 µM of dUTP), Taq polymerase (100 μ/ mL), and sodium azide (0.05%). Samples underwent 35 cycles at 95°C, 60ºC, and 72°C denaturation, annealing and extension temperatures, respectively. After ampliication by polymerase chain reaction (PCR), the amplicons were chemically denatured and added to a nylon membrane containing sequence-speciic oligonucleotide probes. The amplicons marked with biotin hybridized with the corresponding probes with the complementary target sequence and were observed using a colorimetric reaction; conjugated streptavidin, hydrogen peroxide and tetramethylbenzidine (TMB) substrate were added. Perfect matching program (PMP) software was used for interpretation.
Statistical analysis
Allele frequencies were obtained by direct count and the haplotype construction was performed using a probabilistic computational model. The distribution of gene frequencies in the population was checked using the Hardy-Weinberg equilibrium, and the analysis of haplotypes was performed using the Arlequin software version 3.1.22
Statistical differences between populations were determined by the chi-square test with the SISA online software.23 Signiicance was set at a p-value of ≤ 0.05.
HLA-A AF HLA-B AF HLA-DRB1 AF
A*01 0.088 B*07 0.061 DRB1*01 0.100
A*02 0.263 B*08 0.050 DRB1*03 0.092
A*03 0.094 B*13 0.020 DRB1*04 0.092
A*11 0.055 B*14 0.051 DRB1*07 0.149
A*23 0.045 B*15 0.078 DRB1*08 0.047
A*24 0.098 B*18 0.051 DRB1*09 0.015
A*25 0.012 B*27 0.024 DRB1*10 0.018
A*26 0.034 B*35 0.120 DRB1*11 0.129
A*29 0.042 B*37 0.011 DRB1*12 0.017
A*30 0.058 B*38 0.021 DRB1*13 0.129
A*31 0.042 B*39 0.032 DRB1*14 0.043
A*32 0.034 B*40 0.047 DRB1*15 0.111
A*33 0.029 B*41 0.013 DRB1*16 0.041
A*34 0.006 B*42 0.012
A*36 0.004 B*44 0.106
A*66 0.007 B*45 0.014
A*68 0.055 B*46 0.0004
A*69 0.001 B*47 0.002
A*74 0.008 B*48 0.005
A*80 0.001 B*49 0.028
B*50 0.027
B*51 0.083
B*52 0.019
B*53 0.021
B*54 0.001
B*55 0.009
B*56 0.003
B*57 0.029
B*58 0.024
B*59 0.001
B*67 0.001
B*71 0.001
B*73 0.001
B*78 0.001
B*81 0.002
B*82 0.001
AF: allele frequency.
Discussion
The present study evaluated the frequency expression of HLA, class I (HLA-A* and B*) and class II (HLA-DRB1*) alleles and haplotypes of bone marrow donors registered in the REDOME in Bauru.
We found that the donors were predominantly White, female and tended to be young adults. Our results agree with the demographics reported for this city as presented by the IBGE census15 and by a study of the northern region of Paraná State by Bardi et al.24
The most frequent alleles observed in Bauru were HLA-A*02, HLA-B*35, and HLA-DRB1*07. Similar to this study, the most common allele found in all Brazilian populations (Ribeirão Preto,20 São Paulo,20 Paraná,20 Rio Grande do Sul,11 Minas Gerais,20 Pernambuco20 and Piauí12) was HLA-A*02.
The frequency of the HLA-B and HLA-DRB1 alleles differed between certain regions. For HLA-B, the most frequent allele was HLA-B*44 in Ribeirão Preto20 and São Paulo,20 and this was the second most common allele in the current study. In Pernambuco,20 the HLA-B*42 allele was the most common, however this allele was rare in our population. Moreover, the HLA-B*07 allele was the most common in Piauí12 and the ifth most common in our study.
The frequency of the HLA-DRB1*07 allele was the same for our region as well as for Ribeirão Preto;20 however, the HLA-DRB1*13 allele was the most common in São Paulo,20 Rio Locus
HLA Bauru (n = 3542) (AF)
Ribeirão Preto (n = 184) (AF) p-value
São Paulo (n = 239) (AF) p-value
Paraná (n = 2775) (AF) p-value
Rio Grande do Sul (n = 5000) (AF) p-value
Minas Gerais (n = 1000) (AF) p-value
Pernambuco (n = 101)
(AF) p-value Piauí (n = 97) (AF) p-value
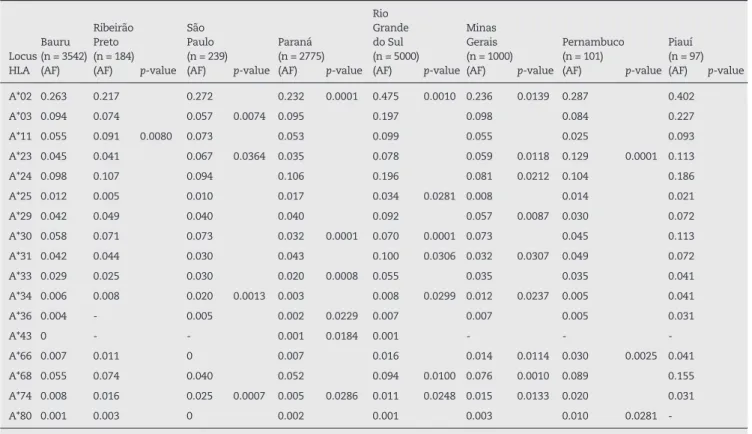
A*02 0.263 0.217 0.272 0.232 0.0001 0.475 0.0010 0.236 0.0139 0.287 0.402
A*03 0.094 0.074 0.057 0.0074 0.095 0.197 0.098 0.084 0.227
A*11 0.055 0.091 0.0080 0.073 0.053 0.099 0.055 0.025 0.093
A*23 0.045 0.041 0.067 0.0364 0.035 0.078 0.059 0.0118 0.129 0.0001 0.113
A*24 0.098 0.107 0.094 0.106 0.196 0.081 0.0212 0.104 0.186
A*25 0.012 0.005 0.010 0.017 0.034 0.0281 0.008 0.014 0.021
A*29 0.042 0.049 0.040 0.040 0.092 0.057 0.0087 0.030 0.072
A*30 0.058 0.071 0.073 0.032 0.0001 0.070 0.0001 0.073 0.045 0.113
A*31 0.042 0.044 0.030 0.043 0.100 0.0306 0.032 0.0307 0.049 0.072
A*33 0.029 0.025 0.030 0.020 0.0008 0.055 0.035 0.035 0.041
A*34 0.006 0.008 0.020 0.0013 0.003 0.008 0.0299 0.012 0.0237 0.005 0.041
A*36 0.004 - 0.005 0.002 0.0229 0.007 0.007 0.005 0.031
A*43 0 - - 0.001 0.0184 0.001 - -
-A*66 0.007 0.011 0 0.007 0.016 0.014 0.0114 0.030 0.0025 0.041
A*68 0.055 0.074 0.040 0.052 0.094 0.0100 0.076 0.0010 0.089 0.155
A*74 0.008 0.016 0.025 0.0007 0.005 0.0286 0.011 0.0248 0.015 0.0133 0.020 0.031
A*80 0.001 0.003 0 0.002 0.001 0.003 0.010 0.0281
-HLA: human leukocyte antigen; AF: allele frequency; -: untyped alleles. Statistical differences set for p-values ≤ 0.05.
Table 3 - Statistically significant differences between HLA-A alleles in the Bauru population compared to the populations of Ribeirão Preto, São Paulo, Paraná, Rio Grande do Sul, Minas Gerais and Piauí.
Results
This study included 3542 volunteers registered in REDOME [1941 females (54.80%) and 1600 males (45.17%)]. The age of the donors ranged from 18 to 55 years (median, 30 years) and most of the volunteers were single (n = 1743 - 49.21%). According to the responses of the participants about their ethnic background, 3056 (86.28%) individuals classiied themselves as Whites, 165 (4.66%) as Blacks, 79 (2.23%) as Mulattos, 50 (1.14%) as Asians and 113 (3.19%) as others (Table 1). All participants were from cities covered by the Bauru Regional Health Department (DRS-VI).
Twenty, 36, and 13 alleles were identiied in the HLA-A, HLA-B, and HLA-DRB1 groups, respectively. The most common characteristics found at each locus are listed in Table 2. In this population, the most frequently identiied alleles at locus A, B and DRB1* were A*02 (26.3%), B*35 (12.0%), and DRB1*07 (14.9%) respectively.
Tables 3, 4, and 5 show the differences between the frequencies of HLA alleles found in the population of Bauru compared to those of studies from Ribeirão Preto, São Paulo, Paraná, Rio Grande do Sul, Minas Gerais, Pernambuco, and Piauí.
Locus HLA
Bauru (n = 3542) (AF)
Ribeirão Preto (n = 184) (AF) p-value
São Paulo (n = 239) (AF) p-value
Paraná (n = 2775) (AF) p-value
Rio Grande do Sul (n = 5000) (AF) p-value
Minas Gerais (n = 1000) (AF) p-value
Pernambuco (n = 101)
(AF) p-value Piauí (n = 97) (AF) p-value
B*07 0.061 0.058 0.073 0.069 0.133 0.066 0.099 0.0423 0.206 0.0267
B*08 0.050 0.049 0.036 0.055 0.118 0.0135 0.047 0.015 0.0339 0.144
B*13 0.020 0.016 0.010 0.022 0.031 0.0293 0.016 0.020
-B*14 0.051 0.077 0.0479 0.067 0.036 0.0001 0.103 0.060 0.049 0.052
B*15 0.078 0.060 0.102 0.080 0.163 0.077 0.124 0.0283 0.186
B*35 0.120 0.126 0.089 0.0372 0.113 0.236 0.115 0.074 0.176
B*38 0.021 0.016 0.030 0.028 0.0142 0.048 0.015 0.005 0.052
B*40 0.047 0.047 0.040 0.048 0.098 0.037 0.0458 0.044 0.134
B*41 0.013 0.016 0.020 0.008 0.0036 0.021 0.018 0.015 0.001
B*42 0.012 0.025 0.005 0.004 0.0001 0.011 0.0001 0.025 0.0001 0.198 0.0001 0.052
B*45 0.014 0.011 0.020 0.010 0.0150 0.023 0.034 0.0001 0.030 0.031
B*47 0.002 - 0 0.002 0.001 0.0001 0.002 0.015
-B*48 0.005 0.005 0.005 0.005 0.013 0.003 0.030 0.0001
-B*49 0.028 0.027 0.020 0.021 0.0069 0.054 0.031 0.040 0.052
B*53 0.021 0.027 0.040 0.0124 0.012 0.0001 0.030 0.0030 0.039 0.0001 0.035 0.083
B*54 0.001 - 0.005 0 0.0317 -
-B*55 0.009 0.008 0.010 0.021 0.013 0.005 0.031
B*57 0.029 0.025 0.062 0.0001 0.031 0.058 0.037 0.040 0.001
B*58 0.024 0.036 0.005 0.0069 0.015 0.0002 0.040 0.030 0.025 0.083
B*73 0.001 - 0 0 0.001 0.003 0.0463 -
-B*81 0.002 0.011 0.0362 0 0.001 0.0192 0.001 0.0001 0.005 - 0.021
B*82 0.001 - 0 0 0.001 0.001 -
-HLA: human leukocyte antigen; AF: allele frequency; -: untyped alleles. Statistical differences set for p-values ≤ 0.05.
Table 4 - Statically significant differences of the HLA-B alleles in the Bauru population compared with the populations of Ribeirão Preto, São Paulo, Paraná, Rio Grande do Sul, Minas Gerais and Piauí.
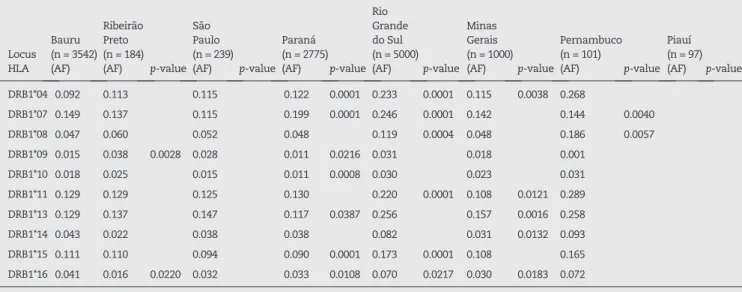
Locus HLA
Bauru (n = 3542) (AF)
Ribeirão Preto (n = 184) (AF) p-value
São Paulo (n = 239) (AF) p-value
Paraná (n = 2775) (AF) p-value
Rio Grande do Sul (n = 5000) (AF) p-value
Minas Gerais (n = 1000) (AF) p-value
Pernambuco (n = 101)
(AF) p-value Piauí (n = 97) (AF) p-value
DRB1*04 0.092 0.113 0.115 0.122 0.0001 0.233 0.0001 0.115 0.0038 0.268
DRB1*07 0.149 0.137 0.115 0.199 0.0001 0.246 0.0001 0.142 0.144 0.0040
DRB1*08 0.047 0.060 0.052 0.048 0.119 0.0004 0.048 0.186 0.0057
DRB1*09 0.015 0.038 0.0028 0.028 0.011 0.0216 0.031 0.018 0.001
DRB1*10 0.018 0.025 0.015 0.011 0.0008 0.030 0.023 0.031
DRB1*11 0.129 0.129 0.125 0.130 0.220 0.0001 0.108 0.0121 0.289
DRB1*13 0.129 0.137 0.147 0.117 0.0387 0.256 0.157 0.0016 0.258
DRB1*14 0.043 0.022 0.038 0.038 0.082 0.031 0.0132 0.093
DRB1*15 0.111 0.110 0.094 0.090 0.0001 0.173 0.0001 0.108 0.165
DRB1*16 0.041 0.016 0.0220 0.032 0.033 0.0108 0.070 0.0217 0.030 0.0183 0.072
HLA: human leukocyte antigen; AF: allele frequency. Statistical differences set for p-values ≤ 0.05.
Grande do Sul11 and Minas Gerais.20 The HLA-DRB1*11 allele was the third most common in Piauí,12but the second most common in our population.
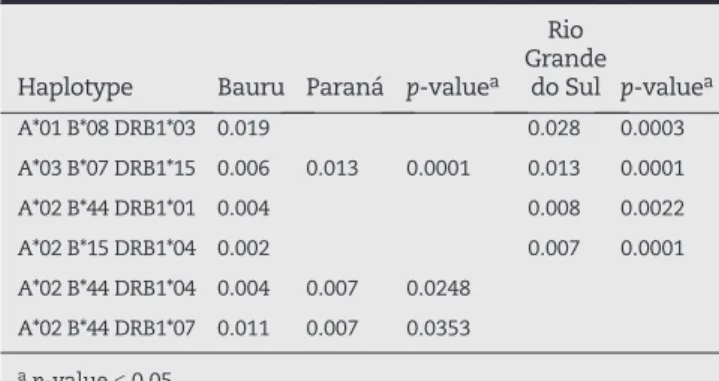
The A*01-B*08-DRB1*03 haplotype was most frequently observed in Bauru, Paraná20 and Rio Grande do Sul.11 However, in the study conducted by Bortolotto et al.,11 the frequency of the A*01-B*08-DRB1*03 haplotype was signiicantly higher in Rio Grande do Sul than in the region of Bauru. The A*03-B*07-DRB1*15, A*02-B*44-DRB1*01, and A*02-B*15-DRB1*04 haplotypes were uncommon in the population from Bauru, which differed signiicantly from the frequencies present in the population from Rio Grande do Sul. When the frequencies of the haplotypes in Bauru were compared to those of Paraná,20 there were signiicant differences for the A*03-B*07-DRB1*15 and A*02-B*44-DRB1*04 haplotypes. These haplotypes were uncommon in our region. The A*01-B*44-DRB1*07 haplotype was the third most common in our region and the tenth most common in Paraná.
The Brazilian population is genetically diverse due to miscegenation that occurred during its history.8,12 The frequencies of some alleles identiied in the population of Bauru were similar to those of populations of other regions of Brazil and some differed. As expected, the population of Bauru resembles the populations of Ribeirão Preto and São Paulo, which are in the same state. Interestingly, the population of Bauru has similarities with the populations of Pernambuco and Piauí in northeast Brazil, distant from our region. Of these two areas, the population of Piauí had the greatest resemblance to that of Bauru. One possible explanation for this could be that both regions had similar colonization with Portuguese and Indians, and little inluence of Africans.25 Moreover, some people may have migrated to the northeastern region of São Paulo State looking for better living conditions.26,27 Regarding the other populations, Bauru, in terms of alleles and haplotypes, is more different from Paraná, Rio Grande do Sul, and Minas Gerais, even though they are geographically closer. The colonization of the southern region of Brazil was marked by the immigration of Germans,28 Spanish, Italians, and Africans29 and in Minas Gerais, most immigrants were Portuguese, Africans and Italians.30 Differences in the populations that immigrated to the various regions may explain the differences in the HLA system.
Conclusion
The HLA compatibility between donors and recipients is essential for a successful bone marrow transplantation. Therefore, the estimation of the immunogenic proile in our region and other regions in Brazil can assist in targeting, developing, and maintaining the REDOME database. The identiication of the frequencies of HLA alleles within a nation is important because it eases the burden of searching compatible donors, decreases the wait for transplants and therefore increases the chances of survival of the recipients. In addition, knowledge of HLA frequencies can improve our understanding of the historical and anthropological composition of populations, that may also allow for areas of interest in each region to be identiied.
Conflicts of interest
The authors declare no conflicts of interest.
R E F E R E N C E S
1. Porto LC, Pontes LF. Estudos de associações HLA x doenças: extratos do I Simpósio Brasileiro. 1st ed. Rio de Janeiro: Ed UERJ; 2007.
2. Abbas AK, Lichtman AH, Pillai S. Cellular and molecular immunology. 6th ed. Philadephia: Sauders Elsevier; 2010. 3. Kindt TJ, Goldsby RA, Osbourne BA, Kuby J. Kuby
immunology. 6th ed. New York: W. H. Freeman; 2007. 4. Erlich HA, Opelz G, Hansen J. HLA DNA typing and
transplantation. Immunity. 2001;14:347-56.
5. Brasil, Ministério da saúde. Instituto Nacional de Câncer: Registro Nacional de Doadores de Medula Óssea (REDOME) [cited 2012 Jan 23]. Available from: http://www1.inca.gov.br/ conteudo_view.asp?ID = 677.
6. Bouzas LF. Análise da capacidade do REDOME/RENACORD em suprir as necessidades dos pacientes registrados no REREME [thesis]. Rio de Janeiro: Instituto Nacional de Câncer; 2011. 7. Brasil, Blog da saúde. Entenda como funciona o REDOME
[cited 2013 Mar 16]. Available from: http://www.blog.saude. gov.br/entenda-como-funciona-o-redome/.
8. Parra FC, Amado RC, Lambertucci JR, Rocha J, Antunes CM, Pena SD. Color and genomic ancestry in Brazilians. Proc Natl Acad Sci USA. 2003;100:177-82.
9. Brasil, Ministério da saúde. Instituto Nacional de Câncer: Informações sobre a doação de medula óssea [cited 2012 Mar 5]. Available from: http://www1.inca.gov.br/conteudo_view. asp?ID = 64
10. Associação Brasileira de Linfoma e Leucemia. Doenças e tratamentos. Transplante de medula óssea [cited 2012 Jan 27]. Available from: http://www.abrale.org.br/doencas/ transplante/index.php?area = transplante
11. Bortolotto AS, Petry MG, da Silveira JG, Raya AR, Fernandes SR, Neumann J, et al. HLA-A, -B, and -DRB1 allelic and haplotypic diversity in a sample of bone marrow volunteer donors from Rio Grande do Sul State, Brazil. Hum Immunol. 2012;73:180-5.
Haplotype Bauru Paraná p-valuea
Rio Grande
do Sul p-valuea
A*01 B*08 DRB1*03 0.019 0.028 0.0003
A*03 B*07 DRB1*15 0.006 0.013 0.0001 0.013 0.0001
A*02 B*44 DRB1*01 0.004 0.008 0.0022
A*02 B*15 DRB1*04 0.002 0.007 0.0001
A*02 B*44 DRB1*04 0.004 0.007 0.0248 A*02 B*44 DRB1*07 0.011 0.007 0.0353
ap-value ≤ 0.05.
12. Monte SJ, Moita Neto JM, Rampim GF, Shulzhenko N, Morgun A, Gerbase-DeLima M. Polimorfismo do sistema HLA em uma amostra de mestiços da população de Teresina, Piauí. Rev Assoc Med Bras. 2004;50:422-6.
13. Instituto Brasileiro de Geografia e Estatística. Brasil 500 anos [cited 2013 Mar 16]. Available from: http://brasil500anos.ibge. gov.br/en/
14. Instituto Brasileiro de Geografia e Estatística. IBGE Cidades [cited 2013 Jan 4]. Available from: http://www.ibge.gov.br/ cidadesat/topwindow.htm?1
15. Sistema IBGE de Recuperação Automática. Tabela 3175 - População residente, por cor ou raça, segundo a situação do domicílio, o sexo e a idade [cited 2013 Jan 4]. Available from: http://www.sidra.ibge.gov.br/bda/tabela/listabl.asp?z = t&c = 3175
16. Instituto Brasileiro de Geografia e Estatística. IBGE Cidades Bauru – SP Histórico [cited 2013 Jan 4]. Available from: http:// www.ibge.gov.br/cidadesat/painel/painel.php? codmun = 350600#
17. Middleton D, Williams F, Meenagh A, Daar AS, Gorodezky C, Hammond M, et al. Analysis of the distribution of HLA-A alleles in populations from five continents. Hum Immunol. 2000;61:1048-52.
18. Williams F, Meenagh A, Darke C, Acosta A, Daar AS, Gorodezky C, et al. Analysis of the distribution of HLA-B alleles in populations from five continents. Hum Immunol. 2001;62:645-50.
19. Louzada-Junior P, Smith AG, Hansen JA, Donadi EA. HLA-DRB1 and -DQB1 alleles in the Brazilian population of the northeastern region of the state of São Paulo. Tissue Antigens. 2001;57:158-62.
20. Gonzalez-Galarza FF, Christmas S, Middleton D, Jones AR. Allele frequency net: a database and online repository for immune gene frequencies in worldwide populations. Nucleic Acids Res. 2011;39:D913-9.
21. Miller SA, Dykes DD, Polesky HF. A simple salting out procedure for extracting DNA from human nucleated cells. Nucleic Acids Res. 1988;16:1215.
22. Excoffier L, Laval G, Schneider S. Arlequin (version 3.0): an integrated software package for population genetics data analysis. Evol Bioinform Online. 2007;1:47-50.
23. Simple Interactive Statistical Analysis. Statistics: Two by two tables [cited 2012 Dec 17]. Available from: http://www. quantitativeskills.com/sisa/
24. Bardi MS, Jarduli LR, Jorge AJ, Camargo RB, Carneiro FP, Gelinski JR, et al. HLA-A, B and DRB1 allele and haplotype frequencies in volunteer bone marrow donors from the north of Parana State. Rev Bras Hematol Hemoter. 2012;34:25-30. 25. Marcondes RL, Falci MBK. Escravidão e Reprodução no
Piauí: Oeiras e Teresina (1875) [cited 2013 Feb 25]. Available from: http://www.fearp.usp.br/pesquisa/images/Anexos/ Publicacoes/Textos_discussao/REC/2001/wpe26.pdf 26. Baeninger R. Novos espaços da Migração no Brasil: anos
80 e 90 [cited 2013 Fev 24]. Available from: http://www. abep.nepo.unicamp.br/docs/anais/pdf/2000/Todos/
NovosEspa%C3%A7osdaImigra%C3%A7aonoBrasilAnos80e90. pdf
27. Instituto Brasileiro de Geografia e Estatística. IBGE Estados São Paulo. Censo demográfico 2010: migração – amostra [cited 2013 Feb 24]. Available from: http://www.ibge.gov.br/ estadosat/temas.php?sigla = sp&tema = censodemog2010_ migra
28. Instituto Brasileiro de Geografia e Estatística. Brasil 500 anos. Território brasileiro e povoamento.Os imigrantes alemães no Brasil [cited 2013 Feb 24]. Available from: http://brasil500anos.ibge.gov.br/en/territorio-brasileiro-e-povoamento/alemaes/os-imigrantes-alemaes-no-brasil 29. Brasil, Governo Estado Paraná. Etnias [cited 2013 Feb 24].
Available from: http://www.cidadao.pr.gov.br/modules/ conteudo/conteudo.php?conteudo = 77.