HESSD
12, 3029–3058, 2015Qualitative soil moisture assessment
in semi-arid Africa
M. Rinderer et al.
Title Page
Abstract Introduction
Conclusions References
Tables Figures
◭ ◮
◭ ◮
Back Close
Full Screen / Esc
Printer-friendly Version Interactive Discussion
Discussion
P
a
per
|
Discussion
P
a
per
|
Discussion
P
a
per
|
Discussion
P
a
per
|
Hydrol. Earth Syst. Sci. Discuss., 12, 3029–3058, 2015 www.hydrol-earth-syst-sci-discuss.net/12/3029/2015/ doi:10.5194/hessd-12-3029-2015
© Author(s) 2015. CC Attribution 3.0 License.
This discussion paper is/has been under review for the journal Hydrology and Earth System Sciences (HESS). Please refer to the corresponding final paper in HESS if available.
Qualitative soil moisture assessment in
semi-arid Africa: the role of experience
and training on inter-rater reliability
M. Rinderer1, H. Komakech2, D. Müller1, and J. Seibert1,3
1
Department of Geography, University of Zurich, Winterthurerstrasse 190, 8057 Zurich, Switzerland
2
Nelson Mandela African Institution of Science and Technology, P.O. Box 447 Arusha, Tanzania
3
Department of Earth Sciences, Uppsala University, 752 36 Uppsala, Sweden
Received: 19 January 2015 – Accepted: 19 February 2015 – Published: 17 March 2015
Correspondence to: M. Rinderer ([email protected])
HESSD
12, 3029–3058, 2015Qualitative soil moisture assessment
in semi-arid Africa
M. Rinderer et al.
Title Page
Abstract Introduction
Conclusions References
Tables Figures
◭ ◮
◭ ◮
Back Close
Full Screen / Esc
Printer-friendly Version Interactive Discussion
Discussion
P
a
per
|
Discussion
P
a
per
|
Discussion
P
a
per
|
Discussion
P
a
per
|
Abstract
Soil and water management is particularly relevant in semi-arid regions to enhance agricultural productivity. During periods of water scarcity soil moisture differences are important indicators of the soil water deficit and are traditionally used for allocating water resources among farmers of a village community. Here we present a simple,
in-5
expensive soil wetness classification scheme based on qualitative indicators which one can see or touch on the soil surface. It incorporates the local farmers’ knowledge on the best soil moisture conditions for seeding and brick making in the semi-arid environ-ment of the study site near Arusha, Tanzania. The scheme was tested twice in 2014 with farmers, students and experts (April: 40 persons, June: 25 persons) for inter-rater
10
reliability, bias of individuals and functional relation between qualitative and quantita-tive soil moisture values. During the test in April farmers assigned the same wetness class in 46 % of all cases while students and experts agreed in about 60 % of all cases. Students who had been trained in how to apply the method gained higher inter-rater reliability than their colleagues with only a basic introduction. When repeating the test
15
in June, participants were given improved instructions, organized in small sub-groups, which resulted in a higher inter-rater reliability among farmers. In 66 % of all classifica-tions farmers assigned the same wetness class and the spread of class assignments was smaller. This study demonstrates that a wetness classification scheme based on qualitative indicators is a robust tool and can be applied successfully regardless of
ex-20
HESSD
12, 3029–3058, 2015Qualitative soil moisture assessment
in semi-arid Africa
M. Rinderer et al.
Title Page
Abstract Introduction
Conclusions References
Tables Figures
◭ ◮
◭ ◮
Back Close
Full Screen / Esc
Printer-friendly Version Interactive Discussion
Discussion
P
a
per
|
Discussion
P
a
per
|
Discussion
P
a
per
|
Discussion
P
a
per
|
1 Introduction
For rainfed agriculture in semi-arid regions the soil water storage is of key-importance for crop survival as it serves as the only water source during dry spells. The soil water storage is also important if water is available for irrigation. Based on differences in soil water deficits, scarce irrigation water resources can be allocated among farmers of
5
a community in a fair manner. For farming activities like choosing the right moment to seed and for the development of crops, the moisture content in the unsaturated, shallow soil layers is of most importance.
Common techniques for measuring soil moisture are often time consuming and/or rely on expensive equipment (e.g., Time Domain Reflectometry, TDR) that needs
elec-10
tricity, maintenance and repair. Such instruments are also usually not available to farm-ing communities in developfarm-ing countries. Therefore local irrigators in semi-arid Africa often visually assess the shallow soil wetness condition to decide on which plots should be allocated irrigation turns. Despite their long experience in farming, for which these leaders are respected by the community members, their assessment might be
dis-15
puted. A more systematic way of soil wetness assessment based on defined crite-ria would relieve pressure on community leaders and assure transparency in decision making and therefore avoid conflicts among farmers.
Qualitative methods have been shown to be useful complements to quantitative mea-surement techniques in a number of field applications in soil science (Thien, 1979), risk
20
assessment (De Quervain, 1950; cited in Pielmeier and Schneebeli, 2003) and ecology (Metcalfe-Smith, 1994). They are based on qualitative indicators that one can identify through sight, sound or touch and that are related to quantitative properties of interest like the grain size distribution of a soil sample or the strength of a snow pack.
In hydrology qualitative indicators have been used for mapping saturated areas in
25
HESSD
12, 3029–3058, 2015Qualitative soil moisture assessment
in semi-arid Africa
M. Rinderer et al.
Title Page
Abstract Introduction
Conclusions References
Tables Figures
◭ ◮
◭ ◮
Back Close
Full Screen / Esc
Printer-friendly Version Interactive Discussion
Discussion
P
a
per
|
Discussion
P
a
per
|
Discussion
P
a
per
|
Discussion
P
a
per
|
this method to visually identify saturated areas (McDonnell and Taylor, 1987; Ambroise et al., 1996; Inamdar and Mitchell, 2007; Latron and Gallart, 2007; SNIFFER, 2009). Soil hydromorphic features that are visual when digging a soil profile can be useful indicators of intermittent soil saturation (Rinderer and Seibert, 2012). Also vegetation in general and individual plant species in specific can be indicators of prevailing soil
5
moisture conditions (Ellenberg et al., 1991; Quinn et al., 1998; Kulasova et al., 2014).
The methods mentioned above do not allow different grades of soil wetness or
changes in soil wetness to be captured over time. The “spade diagnosis” method, which was originally developed in the 1930s for an applied soil texture examination in the field, is one of the earliest schemes with five qualitative wetness classes (Görbing and
Sek-10
era, 1947). The Natural Resources Conservation Service of the United States Depart-ment of Agriculture (1998) published guidelines for estimating soil moisture by feel and appearance for four different soil types and different soil moisture content. Blazkova et al. (2002) defined a qualitative classification scheme based on five wetness classes
and used it for mapping moisture differences along transects and in a drainage ditch
15
(for an application see also Kulasova et al., 2014). In their study, they did not utilize the full range of the five wetness classes, but aggregated the three wettest ones as they were interested in saturated areas. All these methods were not systematically tested in terms of correspondence between the qualitative indicators and the quantitative diff er-ences in soil water content and in terms of the reliability of the methods when applied
20
by different people.
Rinderer et al. (2012) presented a soil wetness classification scheme based on char-acteristic, qualitative indicators for each wetness class to make class assignments more distinct. The indicators are based on the judgment of raters and include informa-tion such as whether their trousers would stay dry or get moist or wet when sitting on
25
HESSD
12, 3029–3058, 2015Qualitative soil moisture assessment
in semi-arid Africa
M. Rinderer et al.
Title Page
Abstract Introduction
Conclusions References
Tables Figures
◭ ◮
◭ ◮
Back Close
Full Screen / Esc
Printer-friendly Version Interactive Discussion
Discussion
P
a
per
|
Discussion
P
a
per
|
Discussion
P
a
per
|
Discussion
P
a
per
|
between qualitative wetness classes and volumetric water content measured by the gravimetric and the TDR method. The definitions of the three wettest classes was sub-sequently applied by Ali et al. (2014) to map superficial water saturation in two nested catchments in Scotland.
Despite testing the robustness of the “Boots & Trousers” method it is still not clear if
5
this qualitative wetness classification scheme is also applicable in drier environmental conditions with different soil types. It is also unclear whether the agreement of classifi-cations is dependent on the prior experience, the depth of the introduction or the train-ing of the raters. We hereby defineintroductionas explanation of the method (typically 5 min) andtraining as practical guidance in applying the method in the field (typically
10
10 min).
In this study we present a qualitative soil wetness classification scheme that is slightly modified from the “Boots & Trousers” method (Rinderer et al., 2012), and that is ca-pable of capturing shallow soil moisture differences in a semi-arid environment. It is adapted to the local peoples’ experience in terms of soil wetness that is optimal for
15
seeding crops and brick making in Tanzania. The scheme is tested for its robustness and agreement between qualitative wetness classes and quantitative differences in soil water content. In particular the following questions are addressed:
1. Do the different qualitative wetness classes reflect actual differences in volumetric water content of the regional soil (Haplic Andosol, loamic, fluvic) of the study site?
20
2. Does the agreement of qualitative wetness classifications depend on the partici-pants’ experience in crop-growing or the level of education?
HESSD
12, 3029–3058, 2015Qualitative soil moisture assessment
in semi-arid Africa
M. Rinderer et al.
Title Page
Abstract Introduction
Conclusions References
Tables Figures
◭ ◮
◭ ◮
Back Close
Full Screen / Esc
Printer-friendly Version Interactive Discussion
Discussion
P
a
per
|
Discussion
P
a
per
|
Discussion
P
a
per
|
Discussion
P
a
per
|
2 Methods
2.1 Wetness classification scheme
The soil wetness classification scheme presented in this paper is based on qualitative indicators that are intuitive to local people in Tanzania from their every-day experience. In doing so, it incorporates the tacit knowledge of local peoples’ perception on soil
5
wetness related to farming and brick making. It ranges from the driest class (#1) called “very dry – dust dry” for which one cannot see or feel any moisture in the soil at the soil surface to the intermediate class (#4), which would be the optimal wetness for seeding plants, to the wettest class (#7) for which one could see water ponding on the soil surface (Table 1). The other classes represent different grades of wetness with wetness
10
class 2 characterizing a soil sample which is dry but has some moist “look”, wetness class 3 being slightly drier than the optimal seeding conditions, wetness class 5 being optimal for making bricks and class 6 being too wet to form a brick. The indicators of the wetness scheme, namely the conditions of optimal seeding and brick making, as well as the English and Swahili class definitions were developed in the course of a field
15
workshop and interviews with a group of local farmers.
It is not intended to tie optimal seeding conditions to a specific crop but rather to reflect farmers’ experience on good seeding conditions in general. The class “very dry – dusty dry” is also not necessarily related to the formation of a dust cloud, when stepping on the ground, as this is strongly dependent on the soil grain size distribution.
20
It is also not intended that raters form a brick to test its stability but it is assumed that local people have good experience in imagining these conditions from their every-day life.
A vegetation cover or a litter layer as well as recent rainfall, dew or strong evaporation might affect the soil wetness conditions on the soil surface without being representative
25
HESSD
12, 3029–3058, 2015Qualitative soil moisture assessment
in semi-arid Africa
M. Rinderer et al.
Title Page
Abstract Introduction
Conclusions References
Tables Figures
◭ ◮
◭ ◮
Back Close
Full Screen / Esc
Printer-friendly Version Interactive Discussion
Discussion
P
a
per
|
Discussion
P
a
per
|
Discussion
P
a
per
|
Discussion
P
a
per
|
some crops can be at depth of 30 to 90 cm (Weaver and Bruner, 1927). However soil moisture at the surface can usually be expected to be related to soil moisture at depth for most soil types if the vertical soil moisture profile is close to equilibrium.
2.2 Field sites, datasets and test layout
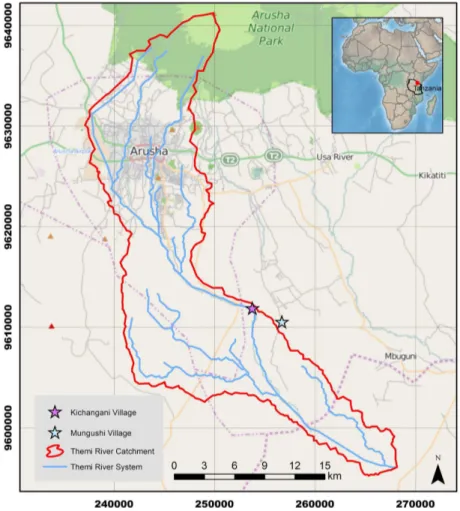
The wetness classification scheme was tested in the two farming villages Mungushi
5
and Kichangani, in the upper Pangani basin, ca. 25 km southeast of Arusha/Tanzania (3◦31′36′′S/ 36◦51′02′′W) (Fig. 1). Haplic Andosols (loamic, fluvic) dominate the area
where the classification scheme was tested (Fig. 2a). Soils are fertile and heavily used for growing crops, mainly beans and corn. Due to a limited amount of rainfall (below
600 mm year−1) (Komakech and Van der Zaag, 2011) falling mainly during the rainy
10
seasons (long rainmasika: March–June and short rainvuli: October–December),
agri-culture in this region depends on flood irrigation during the rest of the year.
To test the wetness classification scheme we performed two experiments, one in April 2014 and another in June 2014. The first test in April was organized in the
Mun-gushi village where 40 sampling points of different wetness were marked with flags
15
along a 1.4 km parcours. The wetness of sequential sampling points was chosen to be random. The test involved 40 people, namely 14 farmers, 14 master students (called “students” in the following), 9 PhD students and 3 Professors. PhD students and pro-fessors were later combined into one group called “experts”. All participants were given a brief introduction of about 5 min to the wetness classification scheme either in Swahili
20
(farmers) or English (students, experts) and then were asked to individually classify the marked sites of different wetness along the parcours. Half of the farmers and students
were given an additional training (∼10 min) in which they were shown representative
sites of wetness classes 1, 4, and 7 before the test. These two groups of participants are referred to asFtrained and Strained in the following. Farmers and students with a ba-25
sic introduction are called Fbasic and Sbasic, respectively. When referring to all of the
farmers, students and experts we use the expressionsFall,Sall andEall. The
HESSD
12, 3029–3058, 2015Qualitative soil moisture assessment
in semi-arid Africa
M. Rinderer et al.
Title Page
Abstract Introduction
Conclusions References
Tables Figures
◭ ◮
◭ ◮
Back Close
Full Screen / Esc
Printer-friendly Version Interactive Discussion
Discussion
P
a
per
|
Discussion
P
a
per
|
Discussion
P
a
per
|
Discussion
P
a
per
|
with the number of the sampling sites appearing as rows and the wetness classes as columns (see Supplement 1 and 2). Participants were asked to tick the appropriate cell corresponding to their judgment of soil moisture conditions of a particular site.
In June 2014 a similar test with 18 farmers and 7 experts was organized in the neighboring village of Kichangani (42 sampling points). The second test was intended
5
to analyze, whether a better and longer introduction (∼20 min) and training (∼30 min)
organized in small subgroups of 5 people and an improved layout of the assessment form, would allow farmers to gain higher inter-rater reliability than during the first test in April. The new assessment form consisted of an A4 portrait page with the class descriptions in the upper part and three columns for the soil wetness assessment (see
10
Supplement 3 and 4). The first column was pre-labeled with “Site 1” to “Site 42” or “kituo 1” to “kituo 42” in Swahili, respectively. The second column was for the wetness class number and the third column was for optional comments. The flags, which indicated the sampling locations, were also labeled “kituo 1” to “kituo 42” to prevent potential conflicts between the number of the site and the number of wetness classes to assign.
15
The wetness scheme remained the same except for some minor changes of class descriptions in the Swahili version.
During both tests in April and in June, volumetric water content was measured by the
gravimetric method taking 100 cm3soil samples with a steel cylinder (diameter: 5 cm),
at 10 cm depth below the soil surface and determining the difference in weight between
20
the original and oven-dried sample (105◦C for 24 h).
No rainfall occurred during the day of the test in April and June and the influence of a drying up due to evaporation was considered to be small as all participants fin-ished the test within 1 h. In April, rainfall on the day prior to the test (no measurements available) wetted the soil while in June the fields were irrigated on the preceding days.
25
HESSD
12, 3029–3058, 2015Qualitative soil moisture assessment
in semi-arid Africa
M. Rinderer et al.
Title Page
Abstract Introduction
Conclusions References
Tables Figures
◭ ◮
◭ ◮
Back Close
Full Screen / Esc
Printer-friendly Version Interactive Discussion
Discussion
P
a
per
|
Discussion
P
a
per
|
Discussion
P
a
per
|
Discussion
P
a
per
|
2.3 Statistical analysis
To evaluate the agreement between the qualitative soil wetness classes and the quanti-tative measurements, the distribution of gravimetrically measured volumetric soil water content was compiled for each qualitative wetness class. To assess the agreement of qualitative wetness classifications among farmers, students and experts, the
fre-5
quency distribution of classification differences relative to the median of classifications of all group members, determined at each sampling point, was analyzed. First the over-all agreement among group members was investigated incorporating the classification
differences of all sampling points. Furthermore the frequency distribution of wetness
class assignments for each sampling point was analyzed individually in order to
iden-10
tify which wetness classes were distinct and which ones were more difficult to identify. The median was chosen as reference as it is a robust measure of class assignments and not affected by individual outliers.
To see if individual raters had a systematic tendency to classify some wetness
classes as too wet or too dry, the mean difference of classifications to the median
15
for all sampling points of each of the seven wetness class was calculated for each person. Positive differences indicate a mean rater classification that was too wet and negative differences indicate a mean rater classification that was too dry compared to the reference.
Krippendorff’s Alpha (Krippendorff, 2004) and Cohen’s Kappa (Cohen, 1960) are two
20
statistical measures to assess the degree of agreement or inter-rater reliability among
raters assigning categorical values. Krippendorff’s Alpha is a measure to assess the
degree of agreement within a group of raters (Krippendorff, 2004). If all raters agree perfectly, the observed agreement is one and so is Krippendorf’s Alpha. If wetness classes would be assigned randomly, Krippendorf’s Alpha would be equal to zero as
25
observed and expected disagreement among all raters would be equal (Krippendorff,
HESSD
12, 3029–3058, 2015Qualitative soil moisture assessment
in semi-arid Africa
M. Rinderer et al.
Title Page
Abstract Introduction
Conclusions References
Tables Figures
◭ ◮
◭ ◮
Back Close
Full Screen / Esc
Printer-friendly Version Interactive Discussion
Discussion
P
a
per
|
Discussion
P
a
per
|
Discussion
P
a
per
|
Discussion
P
a
per
|
Cohen’s Kappa (CK) was used as a measure to assess concordance between two raters, or, in our case, each individual rater and a reference (Cohen, 1960). If there is no agreement between the two rates other than what would be expected by chance, CK equals zero and if they both agree perfectly, CK would theoretically equal one. However, as the frequency of class assignments between two raters is normally not
5
equal, the maximum attainable CK value (CKmax) is normally smaller than one. As
common measures of statistical significance can be misleading due to differences in
marginal probabilities for the two raters, kappa values should be interpreted as the
ratio between CK/CKmax(Sim and Wright, 2005). In this paper, KA and CK/CKmaxare
given as percentage.
10
3 Results
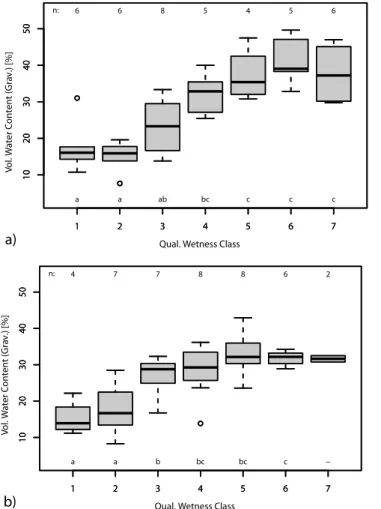
3.1 Qualitative and quantitative soil wetness
The classes of the presented, qualitative soil wetness classification scheme reflected
differences in quantitative volumetric water content of the soil samples taken during
the test in April and June (Fig. 3). The median volumetric water content ranged from
15
16 to 39 % for soil samples taken in April and from 14 to 32 % for samples taken in June. The median volumetric water content and its 25- and 75-% quantiles increased for soil samples of wetness classes 2 to 6 during the test in April and for samples of classes 1 to 5 during the test in June. However soil samples of the following wetness classes had a similar median volumetric water content: classes 1 and 2; classes 6 and
20
7 (taken during the test in April); classes 5, 6, 7; and to a lesser extent, classes 3 and 4 (taken during the test in June). A pairwise Mann–Whitney Test using an adjusted level of significance of 0.002 by Bonferroni indicated that the volumetric water content of the different qualitative wetness classes was not statistically significant. But it should be noted that the number of samples in each wetness class was low. A more relaxed
sig-25
HESSD
12, 3029–3058, 2015Qualitative soil moisture assessment
in semi-arid Africa
M. Rinderer et al.
Title Page
Abstract Introduction
Conclusions References
Tables Figures
◭ ◮
◭ ◮
Back Close
Full Screen / Esc
Printer-friendly Version Interactive Discussion
Discussion
P
a
per
|
Discussion
P
a
per
|
Discussion
P
a
per
|
Discussion
P
a
per
|
of 0.05 indicated, for the test in April, that the following classes were not significantly different from each other: classes 1, 2, 3; classes 3 and 4; and classes 4, 5, 6, 7. For the dataset of the second test in June the following classes were not significantly dif-ferent from each other: classes 1 and 2; classes 3, 4, 5; and classes 4, 5 and 6. Class 7 was only represented by two samples, so couldn’t be assessed.
5
3.2 Inter-rater reliability
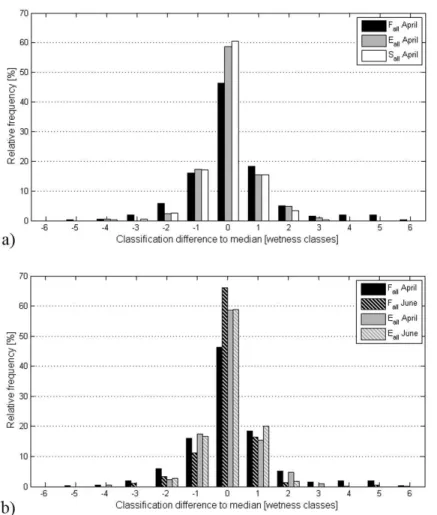
In terms of the role of experience in crop growing and level of education on the agree-ment of wetness classifications we found that during the first test in April theFallshowed
a lower degree of agreement thanSallandEall(Fig. 4): in about 46 % of all cases
clas-sified byFall they agreed and independently assigned the same wetness class, 34 %
10
of all classifications were off the group median by one class, 11 % by two classes,
4 % by three classes and 5 % (=22 assignments) were off by four or more classes.
In 11 times (2.5 %) members ofFall assigned a wetness class which was offby more
than four classes. The agreement of wetness classifications amongSallduring the test
in April was higher than that among Fall (Fig. 4): 60 % of all cases classified by Sall 15
were assigned to the same wetness class, 33 % of all classification were offthe group
median by one class, 6 % by two classes, 1 % by three classes and 0.2 % (=1
assign-ment) were offby four classes. None of Sall assigned a wetness class that was offby
more than four classes. The agreement of wetness classifications amongEall during
the test in April was similar to that ofSall(Fig. 4): about 59 % of all cases classified by 20
Eall were assigned the same wetness, 33 % of all classifications were offby one class,
7 % by two classes, 1 % by three classes and 0.5 % (=2 assignments) were offby four
classes. No wetness classification of theEall was offthe group median by more than
four classes.
The difference in the degree of agreement betweenFall,Salland Eall during the test 25
in April was also evident from the inter-rater reliability statistics. The KrippendorffAlpha (KA) value forFall(KA: 42 %) was half of KA ofSall(KA: 83 %) andEall(KA: 82 %) during
HESSD
12, 3029–3058, 2015Qualitative soil moisture assessment
in semi-arid Africa
M. Rinderer et al.
Title Page
Abstract Introduction
Conclusions References
Tables Figures
◭ ◮
◭ ◮
Back Close
Full Screen / Esc
Printer-friendly Version Interactive Discussion
Discussion
P
a
per
|
Discussion
P
a
per
|
Discussion
P
a
per
|
Discussion
P
a
per
|
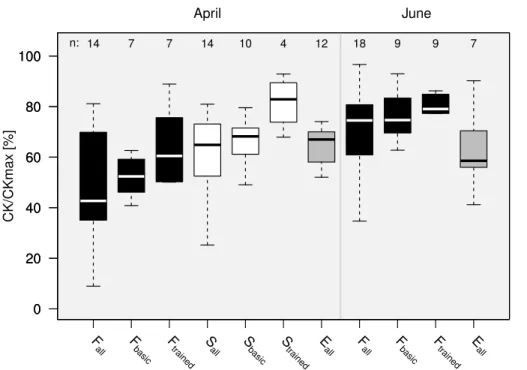
SallandEall(43, 65 and 67 %, respectively; Fig. 5 and Table 2). The Interquartile Range
(IQR) of CK/CKmaxwas 1.8 to 3 times larger forFall than forSall andEall, respectively
(Fig. 5 and Table 2).
During the second test in June the agreement of class assignments amongFallwas
higher and exceeded even the agreement amongEall(Fig. 4): in about 66 % of all cases
5
Fall independently assigned the same wetness class, 28 % were offthe group median
by one class, 4 % by two classes, 1 % by three classes and 1 % were off by four or
more classes. Only once (0.14 %) a farmer assigned a wetness class that was offby
6 classes. The agreement of wetness classifications among Eall was similar during
the test in April and in June except that no expert was offthe group median by more
10
than two wetness classes during the second test (Fig. 4): 59 % of all cases classified
by Eall during the test in June were assigned the same wetness class, 37 % of all
classifications were offby one class, 4 % by two classes.
During the second test in JuneFallachieved a similar inter-rater reliability asEall (no
student raters during the test in June). KA ofFall (KA: 76 %) was more similar to KA of 15
Eall (KA: 84 %) and the median of CK/CKmax ofFall (75 %) even exceeded that of Eall
(59 %) during the second test in June (Fig. 5 and Table 2). The IQR of CK/CKmax for
Fallduring the second test was almost half the IQR of the first test (Fig. 5 and Table 2).
In terms of the role of training on how to apply the wetness classification scheme, we found thatStrained during the test in April andFtrainedduring the test in June had a higher 20
inter-rater reliability (KA and CK/CKmax) compared to their colleagues with only a basic
introduction (Table 2). The distribution of differences in classifications relative to the median of the groups was also narrower forStrainedduring the test in April and forFtrained
during the test in June compared to their colleagues with only a basic introduction (Fig. 4). No individual of these two groups with additional training assigned a wetness
25
class that was offthe group median by more than two classes. During the test in April
the importance of additional training was not so evident among farmers. While the median CK/CKmaxwas higher forFtrained compared to Fbasic, this was not the case for
HESSD
12, 3029–3058, 2015Qualitative soil moisture assessment
in semi-arid Africa
M. Rinderer et al.
Title Page
Abstract Introduction
Conclusions References
Tables Figures
◭ ◮
◭ ◮
Back Close
Full Screen / Esc
Printer-friendly Version Interactive Discussion
Discussion
P
a
per
|
Discussion
P
a
per
|
Discussion
P
a
per
|
Discussion
P
a
per
|
large. In hindsight, we partly attribute this to the use of a confusing assessment form for the test in April.
In terms of a convergence of wetness class assignments with increasing number of rated sampling points we found that during the first test in April the median CK/CKmax and KA forSall andEall was higher but not statistically significant for the second half of 5
sampling points compared to the first half. This was also true for the median CK/CKmax
for Eall during the second test in June (no student raters in June). Fall did not have
a higher median CK/CKmax and KA for the second half of the sampling points
com-pared to the first half during both tests. The median CK/CKmaxand KA ofStrained
dur-ing the first test in April andFtrained during the second test in June was higher for the
10
second half of the sampling points compared to the first half but the median CK/CKmax of their respective colleagues with only a basic introduction was not.
3.3 Identifiability of individual wetness classes
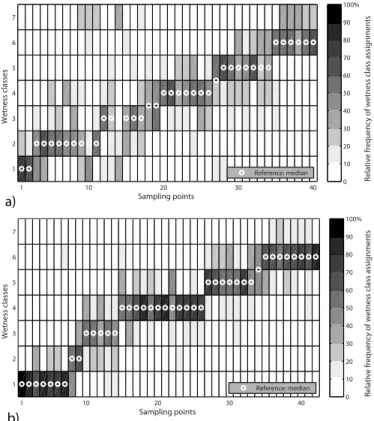
During the first test in April the spread of classification assignments by Fall, Sall and
Eall was large for all wetness classes. Fall had a flat frequency distribution of class 15
assignments for all wetness classes especially for class 2 to 5 and to a lesser extent also for class 6 (Fig. 6a). Note that during both tests, half ofFall did not classify any of the sampling points as class 7.SallandEall(graphs not shown) had narrower frequency
distributions of class assignments than Fall. The two wettest classes, class 7 and to
a lesser extend class 6, showed the smallest, the dry to intermediate class 2, 3 and 4
20
the largest spread.
During the second test in June the spread in class assignments byFall was smaller
(Fig. 6b). The spread of class assignments byFallimproved especially for sample points
of the dry to intermediate class 2 to 5 and also the second wettest class 6 between the
first and the second test. The spread of class assignments byEall was similar or only
25
HESSD
12, 3029–3058, 2015Qualitative soil moisture assessment
in semi-arid Africa
M. Rinderer et al.
Title Page
Abstract Introduction
Conclusions References
Tables Figures
◭ ◮
◭ ◮
Back Close
Full Screen / Esc
Printer-friendly Version Interactive Discussion
Discussion
P
a
per
|
Discussion
P
a
per
|
Discussion
P
a
per
|
Discussion
P
a
per
|
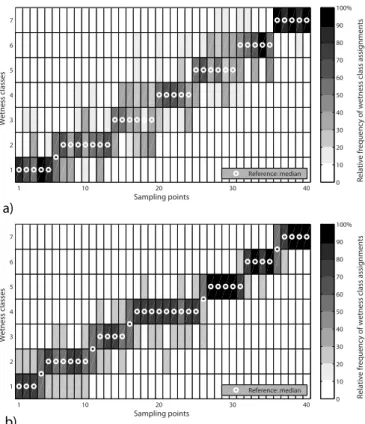
for the first test in April. Both groups showed large spread of class assignments for all wetness classes. In contrast,Strained had narrower frequency distributions of class
assignments for almost all wetness classes compared toSbasic; especially for the dry to
intermediate classes 2 to 5 but also for the second wettest class 6 (Fig. 7). During the
second test in June also the group ofFtrained showed less spread in class assignments
5
compared toFbasic(graph not shown). The improvement was noticeable for all wetness
classes.
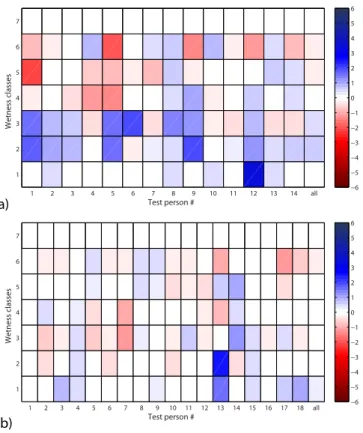
Individual people showed a systematic tendency to rate selected wetness classes either too dry or too wet. During the first test in April individual famers as well as a few students and experts, on average showed a tendency to classify dry sampling sites
10
too wet and to a lesser extent wet sites too dry (forFall see Fig. 8a). The class 2 and
3 showed the largest mean classification differences. During the second test in June
fewer individuals of farmers and experts showed a systematic bias to classify dry sites
as too wet and wet sites as too dry. The mean classification difference was smaller
(see the whiter and pastel colors in Fig. 8b). Note that none of the sampling points had
15
been classified as class 7 by half ofFall during the test in April and in June that is why
the mean classification difference for this class is not given.
4 Discussion
The agreement in wetness class assignments amongSallandEallduring the test in April and alsoFallduring the test in June was high which shows the robustness of the method 20
despite being based on qualitative indicators. In 93 and 91 % of all classifications the members of groupSallandEallagreed or were offby only one wetness class during the
first test in April. Despite a lower inter-rater reliability forFallduring the test in April, they
still agreed in 81 % of all cases or were offby one wetness class. These high numbers
of agreement suggest that the qualitative soil wetness classification scheme in general
25
HESSD
12, 3029–3058, 2015Qualitative soil moisture assessment
in semi-arid Africa
M. Rinderer et al.
Title Page
Abstract Introduction
Conclusions References
Tables Figures
◭ ◮
◭ ◮
Back Close
Full Screen / Esc
Printer-friendly Version Interactive Discussion
Discussion
P
a
per
|
Discussion
P
a
per
|
Discussion
P
a
per
|
Discussion
P
a
per
|
The within-group variability of class assignments by Fall could be considerably
re-duced by a profound basic introduction organized in small subgroups, by a redesign of the assessment form layout and by a clearer labeling of the sampling sites. In 94 % of all classifications the members of groupFallagreed or were offby only one wetness
class. In June not only the site number but also the word “kituo” (English: “station”)
5
was written on the flag. We assume that gross misclassifications of up to 6 wetness classes during the first test in April might partly be due to ticking the wrong cell of the matrix-type of assessment form. The dry to intermediate wetness classes seemed to be difficult to assign while the wettest classes were the easiest (Fig. 6). A profound basic introduction to the wetness classification scheme during the second test in June
10
could particularly improve dry to intermediate class assignments by Fall. The benefit
of a more detailed training was evident regardless of farming experience or educa-tion level for both, Ftrained and Strained. Not only could the within group agreement be
improved but also the number of gross misclassifications of more than three wetness classes could be avoided (see Table 2, Figs. 4, 6 and 7).
15
Compared to a test with master students in Switzerland (Rinderer et al., 2012), the
agreement in this study was similar or lower. Classifications with an offset from the
group median of more than two wetness classes were similarly frequent among Tan-zanian studentsSall (1 %) and expertsEall (2 %) compared to Swiss students (∼1 %),
but considerably higher among Tanzanian farmersFall(8 %) during the first test in April. 20
The inter-rater reliability ofFall(no student rates tested) during the second test in June
was however similar to that of Swiss students.
A better basic introduction, organized in small sub-groups, minimized the spread of class assignments and the bias of individuals to classify wet sites as too dry and dry sites as too wet (Fig. 8). While the mean classification difference of individuals during
25
HESSD
12, 3029–3058, 2015Qualitative soil moisture assessment
in semi-arid Africa
M. Rinderer et al.
Title Page
Abstract Introduction
Conclusions References
Tables Figures
◭ ◮
◭ ◮
Back Close
Full Screen / Esc
Printer-friendly Version Interactive Discussion
Discussion
P
a
per
|
Discussion
P
a
per
|
Discussion
P
a
per
|
Discussion
P
a
per
|
The qualitative wetness classes reflected actual differences in volumetric water con-tent of the gravimetric soil samples. However the median values of the two driest classes and the three wettest classes were very similar suggesting that a classifica-tion scheme with fewer wetness classes would be sufficient to differentiate the actual range of volumetric water content. Rinderer et al. (2012) also discuss merging the two
5
wettest classes and the three intermediate classes in their study. However a reduction of classes would be involved with a coarser resolution of the resulting patterns which might not resolve small changes in soil wetness in space and time any more. Despite being potentially less frequent, misclassification would have a larger effect on the final result when using a scheme with fewer classes.
10
It needs to be noted that the classification scheme by Rinderer et al. (2012) was developed and tested in humid environmental conditions with moor landscapes and therefore had a different range of volumetric water content assigned to the individual wetness classes. The median volumetric water content of class 1 in the Swiss study (∼38 %) is similar to the median volumetric water content of class 7 (37 %) in this study 15
(Fig. 3a). This exemplifies that similar qualitative indicators on the soil surface can be associated with different volumetric water content and therefore the qualitative wetness classes need to be calibrated to the local soil types if the absolute water content is of interest.
Other limitations of this wetness classification scheme exist since only the soil
sur-20
face properties are assessed, but for many crops, the soil moisture at depth is of main interest. In principle we could imagine that the classifications scheme could also be ap-plied to a soil sample which is taken from a small pit, dug down to the depth of roots with a spade (Görbing and Sekera, 1947). However digging a pit slows down the process of soil wetness assessment and soil moisture at the surface usually can be expected to
25
HESSD
12, 3029–3058, 2015Qualitative soil moisture assessment
in semi-arid Africa
M. Rinderer et al.
Title Page
Abstract Introduction
Conclusions References
Tables Figures
◭ ◮
◭ ◮
Back Close
Full Screen / Esc
Printer-friendly Version Interactive Discussion
Discussion
P
a
per
|
Discussion
P
a
per
|
Discussion
P
a
per
|
Discussion
P
a
per
|
5 Conclusions
This study demonstrates the potential of a soil wetness classification scheme based on qualitative indicators that is capable of capturing shallow soil moisture differences in a semi-arid environment. It highlights the value of a detailed introduction and training to the method in gaining high agreement among individual raters but that neither
expe-5
rience in crop production nor a certain education level are a prerequisite for robust and comparable wetness classifications. The study also shows that the qualitative wetness classes are reflecting quantitative differences in volumetric water content.
A soil wetness classification scheme like that presented here is quick to apply, needs no expert knowledge and no measuring device, but can still provide robust and
reli-10
able results on soil moisture differences. It could be exemplified that such a qualitative method can be applied successfully in a wider range of soil- and environmental con-ditions (Ali et al., 2014). All these advantages make the classification scheme partic-ularly useful and appropriate for developing countries and remote areas with limited energy supply. This method could also be used to conduct rapid spatial soil moisture
15
assessments comprising of thousands of sampling points within a catchment. Trained farmers could send wetness classifications of their fields via SMS to a common deci-sion support system. The spatial soil moisture patterns could then be used for model calibration and data assimilation to predict soil water stress and provide suggestions to local farmers on how to best use the available water resources. This vision of
crowd-20
based collection of environmental data is currently under development in the project: “iMoMo – Innovative Monitoring and Modeling of Water”, funded by the Swiss Agency for Development and Cooperation (SDC) in the study area near Arusha, Tanzania.
The Supplement related to this article is available online at doi:10.5194/hessd-12-3029-2015-supplement.
HESSD
12, 3029–3058, 2015Qualitative soil moisture assessment
in semi-arid Africa
M. Rinderer et al.
Title Page
Abstract Introduction
Conclusions References
Tables Figures
◭ ◮
◭ ◮
Back Close
Full Screen / Esc
Printer-friendly Version Interactive Discussion
Discussion
P
a
per
|
Discussion
P
a
per
|
Discussion
P
a
per
|
Discussion
P
a
per
|
Acknowledgements. We thank the staffand students of Nelson Mandela African Institution of Science and Technology and farmers of the Mungushi, Kichangani and Kigongoni furrow who participated in the soil moisture assessment in April and June 2014, respectively. We highly acknowledge the support of our local partners of the Pangani Basin Water Board, the Upper Kikuletwa Water Users Association (Tito Kitomari) and local village and furrow leaders. We 5
thank Tobias Siegfried (iMoMo project coordinator), Hosea Sanga (local iMoMo-project man-ager), Pascal Oechslin, Beat Lüthi and Sebastian Stoll (field assistance), Guido Wiesenberg and Anett Hofmann (soil characterization), Philip Jörg (geo- and satellite data), Matthieu Bo-lay (anthropo-technologic issues), Alfayo Miseyeki (translation) and Tracy Ewen (proofreading the manuscript). We thank the Swiss Agency for Development and Cooperation (SDC) for fi-10
nancial support of the project: “Qualitative Soil Moisture Assessment in Semi-arid Conditions (Tanzania/Africa)” as part of the Global iMoMo Initiative (www.imomohub.org).
References
Ali, G., Birkel, C., Tetzlaff, D., Soulsby, C., McDonnell, J. J., and Tarolli, P.: A comparison of wetness indices for the prediction of observed connected saturated areas under contrasting 15
conditions, Earth Surf. Proc. Land., 39, 399–413, 2014.
Ambroise, B., Freer, J., and Beven, K.: Application of a generalized TOPMODEL to the small Ringelbach catchment, Vosges, France, Water Resour. Res., 32, 2147–2159, 1996.
Blazkova, S., Beven, K. J., and Kulasova, A.: On constraining TOPMODEL hydrograph simula-tions using partial saturated area information, Hydrol. Process., 16, 441–458, 2002.
20
Cohen, J.: A Coefficient of Agreement for Nominal Scales, Educ. Psychol. Meas., 20, 37–46, 1960.
De Quervain, M.: Die Festigkeitseigenschaften der Schneedecke und ihre Messung, Geofisica Pura e Applicata, 18, 179–191, 1950.
Dunne, T. and Black, R. D.: Partial area contributions to storm runoffin a small New England 25
watershed, Water Resour. Res., 6, 1296–1311, 1970.
HESSD
12, 3029–3058, 2015Qualitative soil moisture assessment
in semi-arid Africa
M. Rinderer et al.
Title Page
Abstract Introduction
Conclusions References
Tables Figures
◭ ◮
◭ ◮
Back Close
Full Screen / Esc
Printer-friendly Version Interactive Discussion
Discussion
P
a
per
|
Discussion
P
a
per
|
Discussion
P
a
per
|
Discussion
P
a
per
|
Ellenberg, H., Weber, H. E., Düll, R., Wirth, V., Werner, W., and Paulissen, D.: Zeigerwerte von Pflanzen in Mitteleuropa, Scripta Geobotanica Vol. 18, Verlag Erich Goltze AG, Göttingen, 248 pp., 1991.
Görbing, J. and Sekera, F.: Die Spatendiagnose – Ziel und Grundlage der zweckmässigen Bodenbearbeitung, Verlag Sachse, Hannover, Germany, 1947.
5
Inamdar, S. P. and Mitchell, M. J.: Contributions of riparian and hillslope waters to storm runoff across multiple catchments and storm events in a glaciated forested watershed, J. Hydrol., 341, 116–130, 2007.
Komakech, H. C. and Van der Zaag, P.: Understanding the emergence and functioning of river committees in a catchment of the Pangani Basin, Tanzania, Water Alternatives, 4, 197–222, 10
2011.
Krippendorff, K.: Content Analysis, an Introduction to its Methodology, 2nd edn., Sage Publica-tions, Thousand Oaks, 2004.
Krippendorff, K.: Computing Krippendorff’s Alpha-Reliability, University of Pennsylvania, Penn-sylvania, USA, 2011.
15
Kulasova, A., Beven, K. J., Blazkova, S. D., Rezacova, D., and Cajthaml, J.: Comparison of saturated areas mapping methods in the Jizera Mountains, Czech Republic, J. Hydrol. Hy-dromech., 62, 160–168, 2014.
Latron, J. and Gallart, F.: Seasonal dynamics of runoff-contributing areas in a small mediter-ranean research catchment (Vallcebre, Eastern Pyrenees), J. Hydrol., 335, 194–206, 2007. 20
McDonnell, J. J. and Taylor, C. H.: Surface and subsurface water contributions during snowmelt in a small Precambrian Shield watershed, Muskoka, Ontario, Atmos. Ocean, 25, 251–266, 1987.
Metcalfe-Smith, J. L.: Biological water-quality assessment of rivers: use of macroinvertebrate communities, in: The River Handbook, edited by: Calow, P. and Petts, G. E., Blackwell Sci-25
ence Ltd., Oxford, 144–171, 1994.
Natural Resources Conservation Service: Estimating soil moisture by feel and appearance, Program Aid, 1619, 1–7, 1998.
Pielmeier, C. and Schneebeli, M.: Developments in the stratigraphy of snow, Surv. Geophys., 24, 389–416, 2003.
30
HESSD
12, 3029–3058, 2015Qualitative soil moisture assessment
in semi-arid Africa
M. Rinderer et al.
Title Page
Abstract Introduction
Conclusions References
Tables Figures
◭ ◮
◭ ◮
Back Close
Full Screen / Esc
Printer-friendly Version Interactive Discussion
Discussion
P
a
per
|
Discussion
P
a
per
|
Discussion
P
a
per
|
Discussion
P
a
per
|
for an Alaskan catchment, Hydrol. Earth Syst. Sci., 2, 51–64, doi:10.5194/hess-2-51-1998, 1998.
Rinderer, M. and Seibert, J.: Soil information in hydrologic models: hard data, soft data, and the dialog between experimentalists and modelers, in: Hydropedology – Synergetic Interaction of Soil and Hydrology, edited by: Lin, H., Elsevier B. V., Waltham, 515–536, 2012.
5
Rinderer, M., Kollegger, A., Fischer, B. M. C., Stähli, M., and Seibert, J.: Sensing with boots and trousers – qualitative field observations of shallow soil moisture patterns, Hydrol. Process., 26, 4112–4120, 2012.
Sim, J. and Wright, C.: The kappa statistic in reliability studies: use, interpretation, and sample size requirements, Phys. Ther., 85, 257–268, 2005.
10
SNIFFER: A Functional Wetland Typology for Scotland – Field Survey Manual, 1st edn., Scot-land and Northern IreScot-land Forum for Environ. Res. (SNIFFER), Edinburgh, 2009.
Thien, S. J.: A flow diagram for teaching texture by feel analysis, Jo. Agronom. Educ., 8, 54–55, 1979.
Weaver, J. E. and Bruner, W. E.: Root Development of Vegetable Crops, 1st edn., McGraw-Hill 15
HESSD
12, 3029–3058, 2015Qualitative soil moisture assessment
in semi-arid Africa
M. Rinderer et al.
Title Page
Abstract Introduction
Conclusions References
Tables Figures
◭ ◮
◭ ◮
Back Close
Full Screen / Esc
Printer-friendly Version Interactive Discussion
Discussion
P
a
per
|
Discussion
P
a
per
|
Discussion
P
a
per
|
Discussion
P
a
per
|
Table 1.Soil wetness classification scheme (Swahili version in the Supplement) with the seven wetness classes based on qualitative indicators related to best conditions for seeding and brick making.
Icon Class Classname Description
1 very dry “dust dry”
2 dry dry, but with some moist look
3 below optimal drier than optimal for seeding
4 optimal optimal for seeding crops
5 above optimal wetter than optimal – one can form a solid brick
6 wet when you step on the soil, water liquifies
HESSD
12, 3029–3058, 2015Qualitative soil moisture assessment
in semi-arid Africa
M. Rinderer et al.
Title Page
Abstract Introduction
Conclusions References
Tables Figures
◭ ◮
◭ ◮
Back Close
Full Screen / Esc
Printer-friendly Version Interactive Discussion
Discussion
P
a
per
|
Discussion
P
a
per
|
Discussion
P
a
per
|
Discussion
P
a
per
|
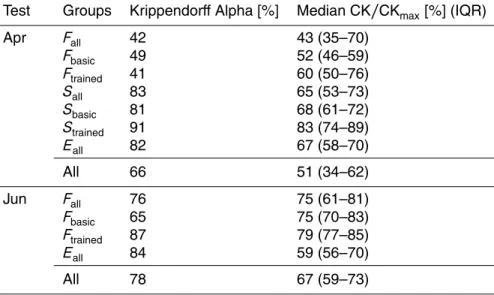
Table 2.Inter-rater reliability statistics for the different groups (F: farmers, S: students, E: ex-perts) during test in April and in June (“basic” indicates only basic introduction, “trained” indicates more detailed training, “all” indicated that both subgroups have been considered). Krippendorff’s
Alpha and the Cohen’s Kappa ratio CK/CKmax can vary between 100 % (perfect agreement)
and 0 % (no agreement other than that what would be expected by chance).
Test Groups KrippendorffAlpha [%] Median CK/CKmax[%] (IQR)
Apr Fall 42 43 (35–70)
Fbasic 49 52 (46–59)
Ftrained 41 60 (50–76)
Sall 83 65 (53–73)
Sbasic 81 68 (61–72)
Strained 91 83 (74–89)
Eall 82 67 (58–70)
All 66 51 (34–62)
Jun Fall 76 75 (61–81)
Fbasic 65 75 (70–83)
Ftrained 87 79 (77–85)
Eall 84 59 (56–70)
HESSD
12, 3029–3058, 2015Qualitative soil moisture assessment
in semi-arid Africa
M. Rinderer et al.
Title Page
Abstract Introduction
Conclusions References
Tables Figures
◭ ◮
◭ ◮
Back Close
Full Screen / Esc
Printer-friendly Version Interactive Discussion
Discussion
P
a
per
|
Discussion
P
a
per
|
Discussion
P
a
per
|
Discussion
P
a
per
|
1 2 3 4 5 6 7
10
20
30
40
50
1 2 3 4 5 6 7
10
20
30
40
50
Qual. Wetness Class
V
ol. W
ater Content (Gra
v.) [%]
a a ab bc c c c
6 6 8 5 4 5 6
n:
1 2 3 4 5 6 7
10
20
30
40
50
1 2 3 4 5 6 7
10
20
30
40
50
Qual. Wetness Class
V
ol. W
ater Content (Gra
v.) [%]
a a b bc bc c −
4 7 7 8 8 6 2
n: a)
b)
HESSD
12, 3029–3058, 2015Qualitative soil moisture assessment
in semi-arid Africa
M. Rinderer et al.
Title Page
Abstract Introduction
Conclusions References
Tables Figures
◭ ◮
◭ ◮
Back Close
Full Screen / Esc
Printer-friendly Version Interactive Discussion
Discussion
P
a
per
|
Discussion
P
a
per
|
Discussion
P
a
per
|
Discussion
P
a
per
|
Figure 4.Deviation of wetness class assignments(a)relative to the median of all farmers (Fall),
all students (Sall) and all experts (Eall) during the test in April and(b)relative to the median of
HESSD
12, 3029–3058, 2015Qualitative soil moisture assessment
in semi-arid Africa
M. Rinderer et al.
Title Page
Abstract Introduction
Conclusions References
Tables Figures
◭ ◮
◭ ◮
Back Close
Full Screen / Esc
Printer-friendly Version Interactive Discussion
Discussion
P
a
per
|
Discussion
P
a
per
|
Discussion
P
a
per
|
Discussion
P
a
per
|
0 20 40 60 80 100
0 20 40 60 80 100
F
all Fbasi c
F
tra ined
S
all Sba sic
S
tra ined
E
all Fall Fbasi c
F
tra ined
E
all
CK/CKmax [%]
14 7 7 14 10 4 12 18 9 9 7
n:
April June
HESSD
12, 3029–3058, 2015Qualitative soil moisture assessment
in semi-arid Africa
M. Rinderer et al.
Title Page
Abstract Introduction
Conclusions References
Tables Figures
◭ ◮
◭ ◮
Back Close
Full Screen / Esc
Printer-friendly Version Interactive Discussion
Discussion
P
a
per
|
Discussion
P
a
per
|
Discussion
P
a
per
|
Discussion
P
a
per
|
1 10 20 30 40
1 2 3 4 5 6 7
Sampling points
Wetness classes
Relative frequency of wetness class assignments
Reference: median 0 10 20 30 40 50 60 70 80 90 100%
1 10 20 30 40
1 2 3 4 5 6 7
Sampling points
Wetness classes
Relative frequency of wetness class assignments
Reference: median 0 10 20 30 40 50 60 70 80 90 100%
a)
b)
Figure 6. Spread of classification assignments for sampling points of individual wetness
classes by(a)all farmers (Fall) in April and(b)all farmers (Fall) in June. The difference between
HESSD
12, 3029–3058, 2015Qualitative soil moisture assessment
in semi-arid Africa
M. Rinderer et al.
Title Page
Abstract Introduction
Conclusions References
Tables Figures
◭ ◮
◭ ◮
Back Close
Full Screen / Esc
Printer-friendly Version Interactive Discussion
Discussion
P
a
per
|
Discussion
P
a
per
|
Discussion
P
a
per
|
Discussion
P
a
per
|
1 10 20 30 40
1 2 3 4 5 6 7
Sampling points
Wetness classes
Relative frequency of wetness class assignments
Reference: median 0 10 20 30 40 50 60 70 80 90 100%
1 10 20 30 40
1 2 3 4 5 6 7
Sampling points
Wetness classes
Relative frequency of wetness class assignments
Reference: median 0 10 20 30 40 50 60 70 80 90 100%
b) a)
Figure 7. Spread of classification assignments for sampling points of individual wetness
HESSD
12, 3029–3058, 2015Qualitative soil moisture assessment
in semi-arid Africa
M. Rinderer et al.
Title Page
Abstract Introduction
Conclusions References
Tables Figures
◭ ◮
◭ ◮
Back Close
Full Screen / Esc
Printer-friendly Version Interactive Discussion
Discussion
P
a
per
|
Discussion
P
a
per
|
Discussion
P
a
per
|
Discussion
P
a
per
|
a)
b)
1 2 3 4 5 6 7 8 9 10 11 12 13 14 all 1
2 3 4 5 6 7
Test person #
Wetness classes
−6 −5 −4 −3 −2 −1 0 1 2 3 4 5 6
1 2 3 4 5 6 7 8 9 10 11 12 13 14 15 16 17 18 all 1
2 3 4 5 6 7
Test person #
Wetness classes
−6 −5 −4 −3 −2 −1 0 1 2 3 4 5 6