AIR QUALITY MODELLING AS A SUPPLEMENTARY ASSESSMENT METHOD IN THE FRAMEWORK OF THE EUROPEAN AIR QUALITY DIRECTIVE
Isabel Ribeiro, Alexandra Monteiro, Ana Patrícia Fernandes, Ana Cristina Monteiro, Myriam Lopes, Carlos Borrego, Ana Isabel Miranda
CESAM & Department of Environment and Planning, University of Aveiro, Aveiro, Portugal
Abstract:
According to the European Air Quality (AQ) Directive, Member States must report annually their AQ to the European Commission (EC). This report can be based on modelling data if the concentration levels do not exceed the established lower assessment thresholds (LAT), or on combining data from modelling and monitoring systems (supplementary assessment methods), if concentrations levels are below the upper assessment threshold (UAT). For the remaining cases, modelling techniques could be applied to provide additional information. In Portugal, the report has been based on monitored data. However, the AQ assessment for the 5-years period 2006-2010 indicates that modelled data can be used alone or combined with monitored data for almost the entire country. This work presents a methodology that combines air pollutant concentration values from monitored data and from a numerical modelling system to deliver information to the AQ assessment report. The AQ combined data were evaluated using the DELTA tool, developed under the FAIRMODE’s activity, verifying the fulfilment of all the defined quality criteria. Additionally, crossing improved concentration fields with geo-databases of land cover, road-maps and demography, using GIS tools, it is possible to quantify exceeding areas, population exposed to exceeding levels or vegetation areas exposed to pollutant levels higher than the vegetation protection thresholds. This methodology produces improved information, especially for areas where the amount of fixed monitoring stations is sparse or non-existent, allowing to obtain a better and broader overview of the AQ in Portugal using this modelling approach to support AQ reporting to the European Commission.
Key words: Air quality reporting to European Commission, supplementary assessment method, air quality modelling, bias correction.
INTRODUCTION
The European 2008/50/CE Directive on ambient air quality and cleaner air for Europe requires that European Union (EU) Member States annually report their air quality (AQ) information. The mandatory reporting includes the list of zones and agglomerations (ZA) where levels exceed or do not exceed lower and upper assessment thresholds (LAT and UAT) and a set of information related to these ZA, namely: the area, the road length, the population and the vegetation areas exposed to concentrations above the critical level or the limit value, regarding a specific atmospheric pollutant (SO2, NO2, NOx, PM10, PM2.5, C6H6, CO and O3).
Traditionally, the AQ assessment has been based on monitoring data but, due to sparse or non-existent number of fixed monitoring stations, this assessment is limited. According to the AQ Directive, Member States can report their AQ assessment based on modelling techniques alone if the concentration levels do not exceed the LAT, or combined with fixed measurements for concentrations below the UAT. Modelling approaches can provide complete spatial coverage information, but models always are uncertain and their results can also be biased (Monteiro, A. et al., 2013). In order to improve the modelling data and the spatial representativeness of the information to report, a methodology that combines air pollutant concentration values from monitored data and from a numerical modelling system was developed and is presented in this paper. The results of this methodology application can be used for AQ reporting to the European Commission purposes, for all the ZA which concentration levels are under the LAT.
METHODOLOGY
Previous to the AQ assessment using modelling techniques, it is necessary to classify each ZA regarding their assessment thresholds (LAT and UAT), based on monitored data for a five years-period. This classification was done for the 2006-2010 period as described in Annex II of the AQ.
The AQ for 2010 was simulated by a modelling system composed by the Mesoscale Meteorological Model (MM5) (Dudhia, 1993) and the EURopean Air Pollution Dispersion – Inverse Modelling (EURAD-IM) (Elbern, H. et al., 2007). The MM5-EURAD-IM modelling system was applied using nesting capabilities until a resolution of 55km2
over mainland Portugal. As discussed in previous works (Monteiro, A. et al., 2013), AQ modelling system results have biases that could be removed through bias correction techniques. Traditionally, the bias correction aims to remove potential errors intrinsic to each model formulation or input data. In this work, a bias correction technique – multiplicative ratio correction (RAT, McKeen, S. et al., 2005) – was used to combine data from modelling and monitoring. The RAT is a simple approach mathematically expressed by (1).
) , ( ) , ( ) , ( ) , ( mod mod d h C d h C d h C d h C raw el n d raw el n d obs corrected (1)
The correction factor is calculated as the quotient between the additions of observed (Cobs) and modelled concentrations ( raw
el
Cmod ) at a particular hour (h) of the n days. According to Monteiro, A. et al. (2013), this
technique should be applied for a four-day training period (n=4, RAT04), including the three past days and the current day, as a compromise between having a period sufficiently long to gather adequate statistics but not so long as to mask seasonal variations. Moreover, synoptic conditions are characterized by a three- to four-day period (Stull, R.B., 1988; Tchepel, O. and Borrego, C., 2010). Thus, the RAT04 final results are a fusion of observed and modelled data for several legislated pollutants, namely NO2, NOx, SO2, O3, PM10, PM2.5, CO and C6H6, and it could be applied to assess AQ in ZA below the UAT, as a supplementary assessment method. Since the RAT04 is a site-specific approach that uses ground-based measurements and simulated data at each monitoring site to revise and improve the model data hourly, a mean ratio founded for each pollutant was applied to each cell of the domain grid in order to obtain correct modelling data for the entire domain.
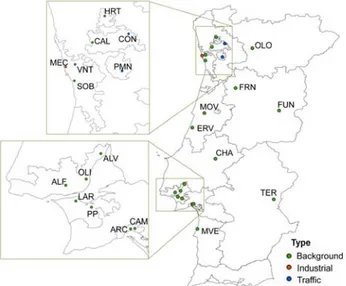
For the modelling and monitoring data treatment specific monitoring stations, are from the AQ monitoring network of mainland Portugal (http://www.qualar.org/), were selected based on the spatial coverage, the background influence, a minimum data collection efficiency of 85% and the measured pollutants. As a result, a total of 22 monitoring stations were selected for the present study: 15 for O3/NO2, 8 for SO2, 6 for PM10/PM2.5, 8 for CO and 4 for C6H6. However, in the specific case of C6H6, just one background station met the criteria. Thus, 1 industrial and 2 traffic stations were also selected. Figure 1 shows the location and the influence type of the selected stations in the study domain.
Figure 1 – Selected air quality monitoring stations, for NO2, O3, PM10, PM2.5, SO2, CO and C6H6, for AQ assessment propose over mainland Portugal (2010).
The AQ modelling results from RAT04 were evaluated using the DELTA tool (Thunis, P. et al., 2011), developed under the FAIRMODE activity (http://fairmode.ew.eea.europa.eu/). The verification of the fulfilment of all the defined quality criteria was based on the Target Plot and the Taylor Diagram, as well as on a set of statistical parameters. For the pollutants not currently included in the DELTA Tool (CO, SO2 and C6H6), the evaluation was performed based on the same statistical parameters used by the DELTA Tool.
Finally, the application of GIS tools allowed crossing concentration fields from RAT04 with geo-databases of land cover (Corine Land Cover 2006), road-maps (Tele Atlas® MultiNet®) and demography, in order to estimate the required information on exceeding areas, population exposed to concentration levels that exceed limit values for human health protection or vegetation areas exposed to pollutant levels higher than the vegetation protection thresholds.
RESULTS
Classification of the zones and agglomerations regarding their assessment thresholds
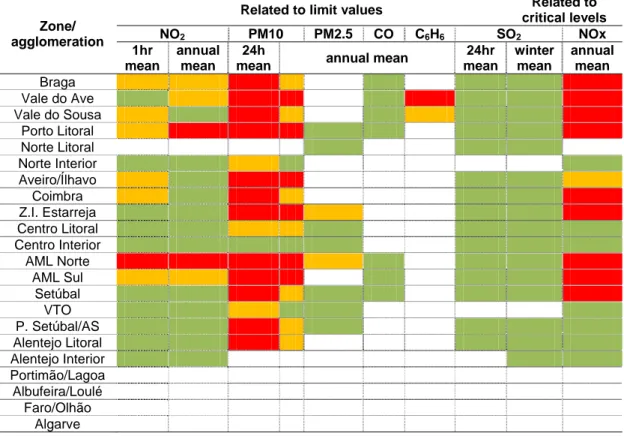
Based on the AQ monitored data from 2006 to 2010, the ZA where AQ measured levels exceeded or not UAT and LAT were listed (Table 1).
Table 1 – ZA for which concentration levels are below the LAT (green), between LAT and UAT (yellow) and above UAT (red), during the 5-years period (2006-2010). The assessment thresholds are related to limit values for the protection of the human health and to critical levels for the protection of vegetation and natural ecosystems. Blank cells: no data available.
Zone/ agglomeration
Related to limit values Related to critical levels NO2 PM10 PM2.5 CO C6H6 SO2 NOx 1hr mean annual mean 24h
mean annual mean
24hr mean winter mean annual mean Braga Vale do Ave Vale do Sousa Porto Litoral Norte Litoral Norte Interior Aveiro/Ílhavo Coimbra Z.I. Estarreja Centro Litoral Centro Interior AML Norte AML Sul Setúbal VTO P. Setúbal/AS Alentejo Litoral Alentejo Interior Portimão/Lagoa Albufeira/Loulé Faro/Olhão Algarve
According to what was previously mentioned, for the ZA below the UAT (green and yellow cells on Table 1) it is possible to combine data from monitoring and modelling as a supplementary assessment method.
AQ assessment with RAT04 technique
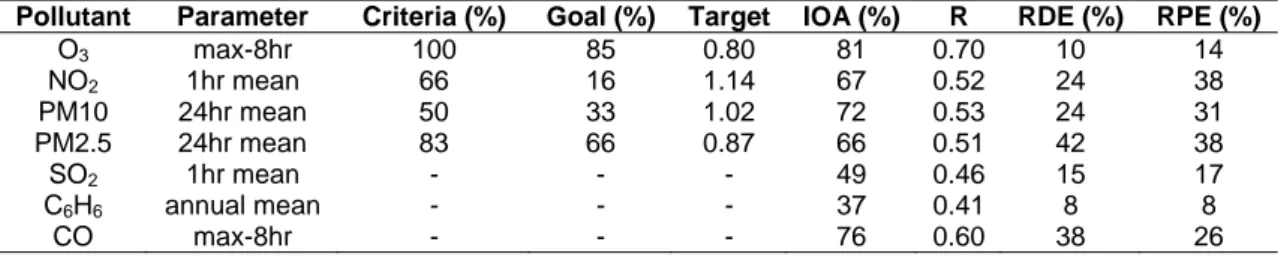
The evaluation of the RAT04 performance and uncertainty (based on the DELTA Tool), showed in Table 2, indicate that the RAT04 technique produce effective results for AQ assessment reporting purpose, for all the studied pollutants.
Table 2 – Percentage of assessed location with a better RAT04 performance than the Delta Tool criteria and goal, target, index of agreement (IOA), correlation factor (R), relative directive error (RDE) and relative percentile error (RPE).
Pollutant Parameter Criteria (%) Goal (%) Target IOA (%) R RDE (%) RPE (%)
O3 max-8hr 100 85 0.80 81 0.70 10 14 NO2 1hr mean 66 16 1.14 67 0.52 24 38 PM10 24hr mean 50 33 1.02 72 0.53 24 31 PM2.5 24hr mean 83 66 0.87 66 0.51 42 38 SO2 1hr mean - - - 49 0.46 15 17 C6H6 annual mean - - - 37 0.41 8 8 CO max-8hr - - - 76 0.60 38 26
All the statistical indicators are generally in accordance to the quality objectives proposed by FAIRMODE (Tunis, P. et al., 2011), with exception of the target values for NO2 and PM10 which are slightly higher than the recommended values. The low R and IOA founded for SO2 and C6H6, could be related to high uncertainty on emission inventory or to inaccurate representation of emissions sources (mainly to power plants and manufacturing and transformation industry).
RAT04 and GIS tool application as an AQ supplementary assessment method
As an example of the results from AQ supplementary assessment method application based on data combination from monitoring and modeling systems, Figure 2 shows the crossed information regarding the RAT04 NO2 annual mean concentration fields, population and the road network. For NO2 annual mean concentrations, AML Sul was one of the ZA with NO2 annual mean concentration values below the UAT, for the 2006-2010 period (Table 1) and also with exceedance of the limit value for human health protection (40 µg.m-3).
Figure 2 – Geographical information over Portugal: a) main road network; b) population density; c) NO2 annual mean concentration fields from RAT04, for 2010. d) Crossed information over AML Sul.
According to the crossed information, it was found that, in 2010: 50.94 km2 of the AML Sul’s territory, 121.46 km of road network length and approximately 386000 inhabitants affected by NO2 annual mean concentration values higher than the limit value.
CONCLUSIONS
Aiming to obtain a better assessment of the AQ to support annual reporting to the EC, a methodology combining data from monitoring and modeling approaches, based on the RAT04 bias-correction technique was applied to Portugal for 2010. RAT04 is simple to apply and allows obtaining AQ information for the entire study domain, even in areas where the amount of fixed monitoring stations is sparse or non-existent. The AQ data from the supplementary assessment method proposed can be crossed with geographical databases, through GIS tools, in order to quantify the parameters requested by the AQ Directive. Moreover, a regular application of this methodology can support a reduction of the number of the monitoring stations where concentration levels are lower than LAT, not compromising the reliability of the information in the AQ annual report.
AKNOWLEDGEMENTS
The authors acknowledge the Portuguese Environment Agency for financing and giving access to measured data. Thanks are extended to the Portuguese Science Foundation for the financing of BIOGAIR project (PTDC/AAC-AMB/103866/2008; FCOMP-01-0124-FEDER-008587), for the PhD grant of Isabel Ribeiro (SFRH/BD/60370/2009) and the post doc grant of Alexandra Monteiro (SFRH/BPD/63796/2009).
REFERENCES
Borrego, C., A. Monteiro, M.T. Pay, I. Ribeiro, A.I. Miranda, S. Basart, J.M. Baldasano, 2011: How bias-correction can improve air quality forecasts over Portugal, Atmos. Environ., 45, 6629-6641. Dudhia, J., 1993: A nonhydrostatic version of the Penn State/NCAR mesoscale model: validation tests
and simulation of an Atlantic cyclone and cold front. Monthly Weather Review, 121, 1493–1513. Elbern, H., A. Strunk, H. Schmidt and O. Talagrand, 2007: Emission Rate and Chemical State Estimation
by 4-Dimensional Variational Inversion, Atmos. Chem. Phys., 7, 3749-3769.
Garber, W., J. Colosio, S. Grittner, S. Larssen, D. Rasse, J. Schneider et al., 2002: Guidance on the Annexes to Decision 97/101/EC on Exchange of Information as Revised by Decision 2001/752/EC. Technical Report. European Commission, DG Environment, p. 71.
McKeen, S., Wilczak, J., Grell, G., Djalalova, I., Peckham, S., Hsie, E.-Y., Gong, W., Bouchet, V., Menard, S., Moffet, R., McHenry, J., McQueen, J., Tang, Y., Carmichael, G.R., Pagowski, M., Chan, A., Dye, T., Frost, G., Lee, P., Mathur, R., 2005. Assessment of an ensemble of seven real-time ozone forecasts over eastern North America during the summer of 2004. J. Geophys. Res. 110, D21307.
Monteiro, A., I. Ribeiro, O. Tchepel, E. Sá, J. Ferreira, A. Carvalho, V. Martins, A. Strunk, S. Galmarini, H. Elbern, M. Schaap, P. Builtjes, A.I. Miranda, C. Borrego, 2013: Bias correction techniques to improve air quality ensemble predictions: focus on O3 and PM over Portugal, Environ. Model Assess., p. 14.
Stull, R.B., 1988: An Introduction to Boundary-layer Meteorology. Kluwer, 666 pp.
Thunis, P., E. Georgieva, A. Pederzoli, D. Pernigotti, 2011: The DELTA tool and Benchmarking Report template. Concepts and User’s Guide. Join Research Centre, Ispra, p. 31.