Social Media + Society July-December 2015: 1 –14 © The Author(s) 2015 DOI: 10.1177/2056305115614851 sms.sagepub.com
Creative Commons CC-BY-NC: This article is distributed under the terms of the Creative Commons Attribution-NonCommercial 3.0 License (http://www.creativecommons.org/licenses/by-nc/3.0/) which permits non-commercial use, reproduction and distribution of the work without further permission provided the original work is attributed as specified on the SAGE and Open Access pages (https://us.sagepub.com/en-us/nam/open-access-at-sage). Article
Introduction
Social media often play an important role in much of modern life, from building social capital (Ellison, Steinfield, & Lampe, 2007) to self-presentation and impression manage-ment (Donath & boyd, 2004) to maintaining connections with friends (Joinson, 2008). However, commentators have also voiced various concerns about other, more unseemly repercussions of social media usage. Some have argued that constant connectivity can disrupt the ability to express and experience our authentic selves (e.g., Jurgenson, 2013). Psychological experiments suggest that the format of online information may restructure our brain, making us less able to attend to focused tasks for extended periods of time (Carr, 2010). Some in popular culture even claim that social media use should be treated as addicting (summarized by Portwood-Stacer, 2012). Such examples represent an emerging trend of what has been termed disconnection, technology push-back, “digital detox,” or media refusal.
These developments have also drawn interest to technol-ogy non-use as a topic of scholarly research. Some of this research examines rhetorical framing, for instance, of non-use
as a political identity statement (Portwood-Stacer, 2013), or of the non-user as the epitome of an authentic human being (Harmon & Mazmanian, 2013). Other studies have examined motivations for leaving social media (Baumer et al., 2013), comparisons between users and non-users (Acquisti & Gross, 2006; Hargittai, 2008), or particular instances of non-use, for example, forgoing social media use during Lent (Schoenebeck, 2014). Whether an act of resistance or the result of infrastruc-tural constraints, studying non-use illuminates the myriad fac-tors that influence whether or not individuals use certain technologies.
One important finding emerging from this work is that, in practice, non-use rarely emerges as a clear-cut, binary distinc-tion in opposidistinc-tion to use. Rather, “disconnectors” demonstrate
Cornell University, USA
Corresponding Author:
Eric P. S. Baumer, Information Science Department, Cornell University, 118 Gates Hall, Ithaca, NY 14850, USA.
Email: [email protected]
Missing Photos, Suffering Withdrawal,
or Finding Freedom? How Experiences
of Social Media Non-Use Influence the
Likelihood of Reversion
Eric P. S. Baumer, Shion Guha, Emily Quan, David Mimno,
and Geri K. Gay
Abstract
This article examines social media reversion, when a user intentionally ceases using a social media site but then later resumes use of the site. We analyze a convenience sample of survey data from people who volunteered to stay off Facebook for 99 days but, in some cases, returned before that time. We conduct three separate analyses to triangulate on the phenomenon of reversion: simple quantitative predictors of reversion, factor analysis of adjectives used by respondents to describe their experiences of not using Facebook, and statistical topic analysis of free-text responses. Significant factors predicting either increased or decreased likelihood of reversion include, among others, prior use of Facebook, experiences associated with perceived addiction, issues of social boundary negotiation such as privacy and surveillance, use of other social media, and friends’ reactions to non-use. These findings contribute to the growing literature on technology non-use by demonstrating how social media users negotiate, both with each other and with themselves, among types and degrees of use and non-use.
Keywords
“a desire for selective and reversible disconnection” (Mainwaring, Chang, & Anderson, 2004, p. 425). The dis-course around smartphone usage is, in many ways, character-ized by fluctuations between extreme use and extreme non-use (Harmon & Mazmanian, 2013). In one study, nearly half the respondents who left Facebook subsequently returned to the site (Baumer et al., 2013). Another study focused on Grinder suggested departure as a gradual, tenuous, and, moreover, reversible process (Brubaker, Ananny, & Crawford, 2014). Indeed, “research agendas around non-use may benefit from studying returns [and] cyclical adoption and departure” (Brubaker et al., 2014, p. 14).
This article fills that gap by examining one case of departing from, and returning to, social media. Such reversion provides a key moment for understanding, and studying the impact of, various individual and social influences on technology non-/ use. We employ a novel combination of methods to examine a group of users who voluntarily left the site Facebook, their reported motivations for and experiences of non-use, as well as whether or not they returned to the site. This particular group of users is analytically interesting largely because they left the site in response to a specific series of events.
The Backstory
In June of 2014, Kramer, Guillory, and Hancock (2014) pub-lished a study indicating experimental evidence for emo-tional contagion on social media. As part of their experimental intervention, the authors adjusted Facebook’s automatic curation of news feeds for hundreds of thousands of users, including either fewer posts with positive words or fewer posts with negative words, and then monitored the number of positive and negative words in those users’ own posts. People reacted to the study in a variety of ways. To some, it was a promising model for collaboration between a data-rich cor-poration and university researchers, but to many, it was a dis-tasteful manipulation of users’ emotions.
In one response to the study, Merijn Straathof, art director at the Dutch advertising firm, Just, wanted to see if he could stay off of Facebook for 99 days. After describing the plan to his colleagues, they, too, decided to share this commitment. His firm then launched a campaign they dubbed 99 Days of Freedom.1 Participants were encouraged to change their pro-file picture to the image shown in Figure 1, post to their friends that they would be back in 99 days, and then try to avoid using both the site itself and any other Facebook-linked product or service. Furthermore, participants were asked to supply their email address and told they would be contacted with informa-tion about filling out a survey after 33, 66, and 99 days. At the time of writing, over 40,000 people had taken this pledge.
Although 99 Days was not designed as a social scientific study, we can nevertheless examine data collected from those 33, 66, and 99 day surveys. The entire 99 Days project, including the surveys, was conceived of and executed by staff at Just. Shortly after the project began, this article’s lead
author contacted Straathof, who was willing (with each par-ticipant’s consent) to share anonymized data with the authors. He also solicited from the authors, suggested for questions that might be asked on the survey, though Straathof and his staff were the final arbiters of the survey design. The surveys ultimately included a mix of closed-ended questions, demo-graphics, and open-ended free-text responses. These data present a unique opportunity to study social media reversion, that is, those participants who made the pledge but returned to Facebook before the 99 days were up. This configuration provides a clear means of identifying reverters who did not initially intend to return as early as they did. This arrange-ment also provides a unique complearrange-ment to more common approaches such as scraping existing data (e.g., Backstrom, Boldi, Rosa, Ugander, & Vigna, 2012; Schoenebeck, 2014), purposive university-run surveys (e.g., Baumer et al., 2013; Lampe, Vitak, & Ellison, 2013), or qualitative interviews (e.g., Portwood-Stacer, 2013; Schoenebeck, 2014). Analysis of these data, though, may not provide fully generalizable conclusions. People who signed up for 99 Days likely do not resemble a representative of all Facebook users. Similarly, those who reverted may not be representative of all users who left the site and subsequently returned. However, the individuals who joined 99 Days had at least some, poten-tially significant, personal motivation to stay off of Facebook. Thus, although a convenience sample, this data set is one in which the phenomenon of social media reversion is both conceptually salient and well-defined.
Summary
factor analysis of the adjectives, drawn from prior work on surveillance in social situations (Robles, Sukumaran, Rickertsen, & Nass, 2006) and on affect (Watson, Clark, & Tellegen, 1988), respondents’ use to describe their 99 (or fewer) Days. Third, we leverage topic modeling (Blei, Ng, & Jordan, 2003) to examine free-text descriptions of respon-dents’ experiences of non-use. Synthesizing across these analyses, four themes consistently recur as significantly influencing the likelihood that a respondent returned to Facebook before 99 days had passed. First, experiences con-sistent with perceived addiction, such as withdrawal and lim-ited self-control, increased the likelihood of reversion. Second, concerns around social boundary negotiation had mixed effects; respondents who emphasized social surveil-lance were less likely to revert, while those concerned with impression management were more likely to revert. Third, respondents who reported a better subjective mood while off of Facebook were less likely to revert. Finally, use of other
social media while not using Facebook played a varied role,
dependent in part on concomitant shifts in attitudes about, and use of, social media. These findings both contribute to the growing literature on technology non-use and help under-stand in greater depth the kinds of experiences that occur not merely on but also around social media.
Related Work
Researchers in human-computer interaction (Satchell & Dourish, 2009) and the sociology of technology (Wyatt, 2003) have acknowledged the importance of, and begun to study phenomena around, technology non-use. Examples include resistance to electrification among rural Americans in the early 20th century (Kline, 2003), how an “information society” accounts for those who do not use digital technolo-gies (Uotinen, 2003), or demographic differences in usage of social networking sites (Hargittai, 2008).
Researchers describe non-users with various typologies. For example, Wyatt (2003) suggests a two-by-two typology using the dimensions of volitionality (is non-use the indi-vidual’s choice?) and temporality (was the individual previ-ously a user?). Rejecters previously used a technology but voluntarily gave it up, while resisters never used it in the first place. The excluded are, against their will, prevented from using a technology, while the expelled previously used it but then were forced to stop. Other work suggests potential extensions, such as the “lagging resister” (Baumer et al., 2013) who has strongly considered dis-using some technol-ogy but not yet actually done so. In this article, we extend these typologies with the notion of a reverter, a rejecter who later becomes a user again.
More recently, researchers have focused specifically on the non-use of social media. In a recent survey, 61% of Facebook users described having “voluntarily taken a break from using Facebook for a period of several weeks or more” (Rainie, Smith, & Duggan, 2013). The social interactions
afforded by such technologies precipitate specific concerns, such as who gets to see what about whom. Practices around privacy, surveillance, impression management, and related concerns fall under a broad umbrella of boundary negotiation
(Palen & Dourish, 2003). In particular, surveillance can be top-down, imposed by governments and corporations (Lyon, 2007), or it can be more social: “social surveillance is the ongoing eavesdropping, investigation, gossip, and inquiry that constitutes information gathering by people about their peers, made salient by the social digitization normalized by social media” (Marwick, 2012, p. 382). Some users may con-tinue, reconfigure, or even limit, their usage as a means of managing the costs and benefits of such surveillance (Guha & Birnholtz, 2013; Guha & Wicker, 2015; Humphreys, 2011).
Other factors can also play a role influencing non-use. A comparison among heavy users, light users, and non-users of Facebook found that non-users tend to be older, spend less time on the Internet, perceive Facebook as less useful, and have lower levels of bridging social capital (Lampe, Vitak, & Ellison, 2013). Due to the data collected, that analysis was “unable to distinguish [ . . . ] between those who used the site and then stopped from those who never tried the site” (Lampe et al., 2013, p. 816). An exploratory study of Facebook non-use found that those who left the site reported being happy with their decision. Of those who deleted their account, very few returned, but of those who deactivated their account, almost half returned to the site (Baumer et al., 2013). Furthermore, a social contagion effect showed “respondents who knew someone that had deactivated were almost three times as likely to deactivate their account” (Baumer et al., 2013, p. 3261). Another analysis focusing on users who gave up Twitter for the Christian period of Lent found that only 64% actually stayed off Twitter for the entire 40 days (Schoenebeck, 2014). Collectively, this prior work hints at the phenomenon of reversion, but none has yet examined it in detail.
Methods
Data Collection and Respondents
Survey Design and Deployment
The three surveys sent to respondents were developed by the staff at Just. Researchers at the Leiden University and the authors of this article were consulted for suggestions, but Just’s staff made the ultimate decisions about the sur-vey design and content. While recommendations were sought from university collaborators, Just made the ulti-mate decisions about the questions and format of the survey.2
The surveys included a mix of closed-ended, Likert-style responses (L) and open-ended, free-text responses (F). Specifically, these items covered (verbatim questions from survey in quotes):
1. Prior experiences with Facebook, including “How often did you check Facebook?” and “On average, how much time did you spend on Facebook each day?” (L), average mood using Facebook (L), the most valuable thing about Facebook (F), adjectives to describe experiences with Facebook (binary choices from a list drawn from Robles et al. (2006) and Watson et al. (1988)), “Have you ever considered taking a break from Facebook?” (L), and motivations for joining the 99 Days pledge.
2. Experiences during the most recent 33 days, includ-ing “How did you feel?” (F), “How did your friends react?” (F), best and worst things that happened (F), average mood (L), adjectives to describe experiences during the most recent 33 days (binary choice from a list), if (and if so when) respondent returned to Facebook (L) along with their own feelings (F) and friends’ reactions (F), “How hard has not using Facebook been for you so far?” (L), and changes in family and social relationships (F). The final Day 99 survey also asked how respondents felt about the 99 Days pledge ending (L), “Are you going back to Facebook now [the pledge] is over” (Y/N), and whether they considered quitting any other habits (F). We use responses to the question about whether (and when) a respondent returned to Facebook to identify reversion.
3. Some demographics, including age, gender, marital status, education, religion, country of residence, and political ideology, (Day 33 only), and other questions not related directly to Facebook, including questions about personal happiness (L). Demographics were collected only at Day 33, as the staff at Just had expected (and hoped) that the same respondents would complete all three surveys. Using unique, ano-nymized identifiers for respondents, they planned to extrapolate demographic data from the initial survey. However, the low number of repeat respondents across the three surveys resulted in demographic data only being available for Day 33.
Analysis and Results
This section provides a mixed-methods analysis, using three complementary analytic approaches as a means of triangula-tion. Specifically, we identify predictors that indicate increased or decreased likelihood of reversion to Facebook use. First, we consider demographic variables and responses to self-reported Likert-style questions. Second, we apply an exploratory factor analysis of adjectives used by survey respondents to describe their experiences with the 99 Days pledge. In both these cases, we followed a manual process of iterative stepwise model selection. Thus, predictors across the three data sets differ slightly, but the final results pre-sented below represent the best model for each data set. Third, we present a novel approach combining topic model-ing with close, qualitative readmodel-ing to understand how respon-dents describe their experiences in open-ended, qualitative questions. In each case, we construct logistic regression models to determine which factors best predict reversion in each case. The discussion section synthesizes across these three analyses.
Respondents
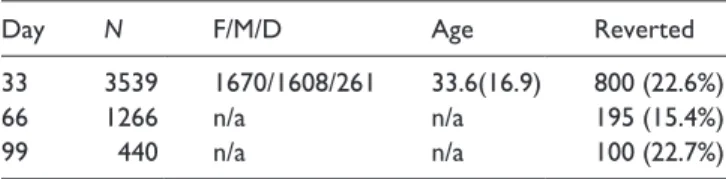
Table 1 provides sample sizes and proportions of respon-dents who reverted, as well as age and gender demographics for the Day 33 data. The sample(s), while relatively large in comparison to similar previous studies, (e.g., Baumer et al., 2013; Lampe et al., 2013), may have been biased in a number of ways. Participants were recruited via traditional news media coverage, social media, and snowball sampling. Also, since 99 Days of Freedom began in response to Facebook’s study of emotional contagion (Kramer et al., 2014), certain users may have been more motivated to join. Furthermore, those participants who returned to Facebook may have been less (or perhaps more) likely to complete the three surveys.
However, we do not know how a representative sample of Facebook users would look. Indeed, Backstrom et al. (2012), who analyzed the network structure of the entire Facebook social graph, do not provide descriptive statistics about the Facebook users whose data they analyzed. Furthermore, as argued above, this sample, even if biased, is a prime one in which to analyze the phenomenon of reversion. Although it does not give us the ability to make inferences about all Facebook users who try to leave the site, it does provide Table 1. Number of respondents and descriptive statistics for each survey. Gender includes female, male, and declined to report.
Day N F/M/D Age Reverted
33 3539 1670/1608/261 33.6(16.9) 800 (22.6%)
66 1266 n/a n/a 195 (15.4%)
99 440 n/a n/a 100 (22.7%)
needed insight into the processes of transitioning between use, non-use, and back to use (Brubaker et al., 2014).
Demographics and Likert Responses
Prior work has found that such factors as age (Acquisti & Gross, 2006; Lampe et al., 2013; Rainie et al., 2013), previ-ous usage (Lampe et al., 2013), happiness with the decision (Baumer et al., 2013), and others predict various forms of non-use. Here, we consider whether similar factors might predict reversion.
Specifically, we consider several factors measured via Likert, yes/no, or similar style questions, including: prior use of Facebook, mood using Facebook and during the 99 Days pledge, prior consideration of leaving Facebook, difficulty in not using Facebook, some demographics (age, gender, edu-cation, marital status, etc.), and others.3 Some questions were only asked on specific surveys, for example, prior consider-ation of leaving Facebook, as well as demographics, were only asked at Day 33 (as described above), while whether the respondent planned to return to Facebook was only asked at Days 66 and 99.
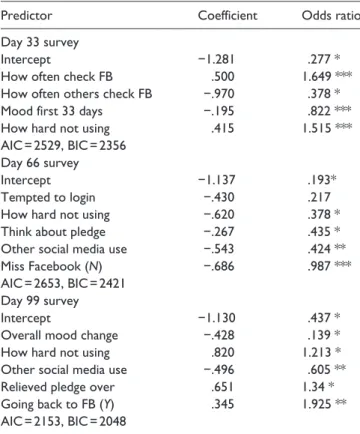
Using these data, we constructed a logistic regression model for whether or not the participant returned to Facebook, consid-ering each of the above as a potential predictor. To develop the most parsimonious models, we conducted a manual process of iterative stepwise model selection, including or excluding sin-gle variables based on Akaike Information Criterion (AIC), Bayesian Information Criterion (BIC), residual deviance, and other model fit diagnostics. To reiterate, this process means that different predictors are included or excluded for different data sets, but that the results reported below represent the best model for each data set. The exclusion of a given predictor for a given data set indicates that it did not explain enough of the variance to warrant inclusion in the model.
Table 2 shows full details of the results, along with model fit statistics.4 Across all three surveys, those who found not using Facebook harder were more likely to return. Mood also emerged as a significant predictor: those who reported better moods were less likely to revert. Self-reported frequent use of Facebook (prior to the 99 Days pledge) predicted increased likelihood of reversion, suggesting habitual use as a key influence in reversion. However, beliefs that others checked very often predicted decreased likelihood of reversion. One might expect that social contagion (Le Bon, 1895) would result in the opposite effect. Instead, we suggest this result indicates how normative beliefs may influence social media (non-)use (cf. Lenhart, 2005). If I see myself as a compara-tively highly frequent user, it may be more difficult for me not to log in, and vice versa, if I see myself as a less frequent user. Finally, those who reported using other social media
more often were less likely to revert. The themes of mood
and other social media use both recur in the following two
analyses, though the specific findings for other social media
use differ. The discussion addresses this tension.
Thus, self-reported individual characteristics significantly predicted whether an individual was more or less likely to return to Facebook before 99 days had passed. The next two subsections, “Exploratory Factor Analysis,” and “Topic Modeling,” explore how the experience of non-use itself may influence the likelihood of reversion.
Exploratory Factor Analysis
On each survey, one question asked participants to select from a list of adjectives the words that they would use to describe their experiences during the 99 Days pledge. Responses were recorded as 45 binary variables indicating whether or not the respondent selected each adjective.
Analyzing each data set separately, we used factor analy-sis to reduce the dimensionality and to identify underlying commonalities among respondents’ experiences. Using the Kaiser-Guttman rule (Jackson, 1993), we retained factors with an eigenvalue greater than 1.0. The direct oblimin rota-tion method was used based on the assumprota-tion that the underlying factors that are produced are correlated with one another. The resulting factor loading matrix produced an out-put that was interpretable and had a clear structure. Based on this structure, we set the cutoff for significant loadings to Table 2. Logistic regression results showing self-reported Likert-style factors that significantly predict reversion for each data set.
Predictor Coefficient Odds ratio
Day 33 survey
Intercept −1.281 .277 *
How often check FB .500 1.649 ***
How often others check FB −.970 .378 *
Mood first 33 days −.195 .822 ***
How hard not using .415 1.515 ***
AIC = 2529, BIC = 2356 Day 66 survey
Intercept −1.137 .193*
Tempted to login −.430 .217
How hard not using −.620 .378 *
Think about pledge −.267 .435 *
Other social media use −.543 .424 **
Miss Facebook (N) −.686 .987 ***
AIC = 2653, BIC = 2421 Day 99 survey
Intercept −1.130 .437 *
Overall mood change −.428 .139 *
How hard not using .820 1.213 *
Other social media use −.496 .605 **
Relieved pledge over .651 1.34 *
Going back to FB (Y) .345 1.925 **
AIC = 2153, BIC = 2048
.3. This cutoff resulted in 14 components for the Day 33 and Day 66 data sets and 15 components for the Day 99 data set, as shown in Table 3. For each variable in each factor, we calculated the average of their factor means. This produced a single value for each of the factors for every participant. We used these values to fit the factors in a logistic regression with reversion as the dependent variable. These results are presented in Table 4.
Before discussing the results, it is important to consider what respondents’ replies to this question mean. The first survey asked users to “Select the words that best describe your experiences, perceptions of, and attitudes about the 99 Days [pledge],” and subsequent surveys asked “How do you feel about [the pledge] since the last survey?,” again, because Just expected the same respondents would complete all three surveys. Given responses, we suspect that respondents likely used these adjectives in part to describe their experiences of the pledge and in part to describe how taking the pledge altered their perceptions of Facebook.
For example, we see that adjectives associated with the Surveillance factor (e.g., watched, monitored, on-stage) pre-dict decreased likelihood of reversion. This result is most readily interpretable as meaning not that the respondents felt surveilled during the 99 Days pledge but rather that their experiences during the pledge were associated with an increased feeling of being surveilled on Facebook. Experiences around impression management (e.g., on-stage, self-conscious), on the other hand, predicted increased likeli-hood of reversion. Again, we suggest this is most sensibly
interpretable as meaning that the 99 Days of Freedom pledge led respondents to think more about Facebook in terms of impression management and, as a result, returned to Facebook to have better control over perceptions of their online identities. The importance of the Judged adjectives likely also pertains to social surveillance and boundary nego-tiation, though in a different way than impression manage-ment. Those who focus on managing their impressions on Facebook were more likely to revert, while those who felt judged were less likely. The factors for feeling Manipulated and, to a lesser extent, Rebellious may arise in part from 99 Days of Freedom coming as a reaction to the emotion conta-gion study. Respondents who felt manipulated by, and per-haps who were rebelling against, Facebook were less likely to revert. Lastly, adjectives associated with Perceived Addiction (e.g., impulsive, addicting, hasty) predict increased likelihood of reversion, but only during the Day 33 and Day 99 surveys. Full results are shown in Table 4. Two of these themes, boundary negotiation (i.e., surveillance and impres-sion management) and perceived addiction, also occur in the third analysis.
Topic Modeling
Our third methodological approach analyzed the free-text responses, which provide rich snapshots of respondents’ experiences. Traditionally, one might analyze these data using approaches such as grounded theory (Glaser & Strauss, 1967/2009), in which researchers iteratively develop codes, Table 3. Factor analysis results across the three data sets. For factors with multiple high loadings, we manually assign a [Label].
Day 33 survey
Nurturing, warm [Comfort] Entertaining, friendly, fun [Enjoyable] Helpful, logical, supportive [Facilitating]
Inappropriate Powerful Manipulated
Orderly, organized [Work] Annoying, insecure, irritable [Negative] Monitored, watched [Surveillance]
Impulsive, rebellious [Disinhibited] Careful, cautious [Worried] Addicting, invasive [Perceived addiction]
Reliable Self-conscious [Impression management]
14 factors capturing 21.2% of variance Day 66 survey
Careful, orderly, organized [Work] Entertaining, helpful, supportive [Enjoyable] Inhibited, insecure [Closed]
Reckless Energetic Rebellious
Inconsistent Exhibitionistic Uncertain
Nurturing, warm [Comfort] Hasty, impulsive [Perceived addiction] Friendly, joking [Amiable]
Suspicious, watched [Surveillance] Cautious, on-stage, self-conscious
[Impression management] 14 factors capturing 24.4% of variance
Day 99 survey
Colorful, energetic [Lively] Cautious, uncertain [Uncertainty] Exhibitionistic, manipulated [Surveillance]
Nurturing, warm [Comfort] Addicting, inappropriate [Perceived
addiction]
On-stage [Impression management]
Unpredictable Orderly Joking
Logical Judged Showy
Dominant Careful Supportive
themes, and categories through repeated reading. Relatedly, one could develop a code book and then train human coders to annotate responses. Such approaches, however, scale poorly to the thousands of responses in our data.
As an alternative, recent work suggests that statistical topic models, such as latent Dirichlet allocation (LDA) (Blei et al., 2003), provide a robust, flexible approach to open-ended sur-vey analysis (Roberts et al., 2014). Topic models represent each topic, that is, each theme, as a probability distribution or words that deal with that topic, and documents are represented as combinations of topics. Topic modeling algorithms attempt to infer these underlying topics from a set of unlabeled docu-ments. Here, each response to each free-text question is treated as a single document. This approach does not capture syntactic relationships but is often surprisingly effective at modeling recognizable themes. In the context of survey analysis, we can think of automatically extracted topics as “codes” that have been assigned by an algorithm rather than by human coders. Topic models can be trained quickly and cheaply, running over tens of thousands of documents in a matter of minutes. This approach forfeits the linguistic and contextual knowledge of human coders, but in return, it provides a much more scalable approach for medium- to large-sized data sets.
For each survey, we trained a topic model on the individ-ual responses to eight questions. We did not model responses to two questions that specifically involve reactions to return-ing to Facebook, since only respondents who returned
answered those. Two more questions, one relating to plans for the next 30 days and one asking whether the respondent planned to quit any other habits, produced responses that shared no topics with other questions, so we omitted those as well. The topic proportions for each respondent were then used as predictors in a binary logistic regression model, as in the two preceding subsections, “Demographics and Likert Responses,” and “Exploratory Factor Analysis.” This analy-sis allows us to determine whether describing certain types of experiences increased or decreased the likelihood that the respondent would return to Facebook. This subsection omits analysis of the Day 99 data as it included far fewer responses than the other two data sets. For full details, please see the Methodological Appendix.
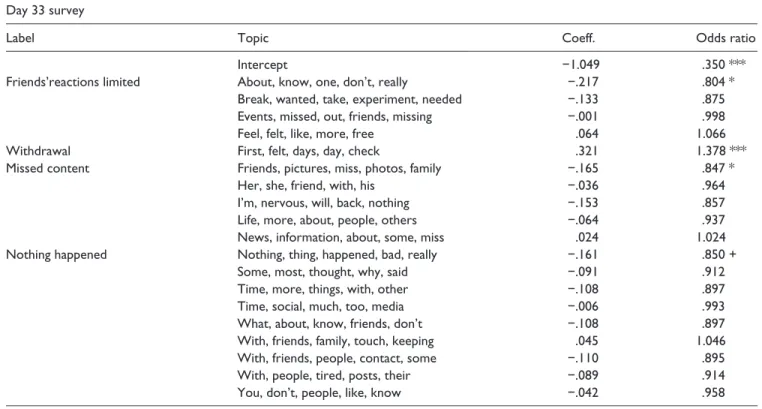
Tables 5 and 6 contain results from the Day 33 and Day 66 surveys. Each topic is described using the top five words most likely to occur in responses about that topic. Collectively, these topics represent experiences of Facebook non-use commonly described by respondents. For instance, the Missed Content topic most frequently includes the words “friends, pictures, miss, photos, family,” and the top responses for that topic describe experiences of missing out on photos and other updates posted by friends and family. The tables show how each topic predicts reversion in terms of logistic regression coefficients, odds ratios, and p. For those topics that predict a significant increase or decrease in likelihood of reversion, we also provide a manually assigned label. Given the exploratory nature of this approach, we do not report model diagnostics as in the Likert-style self-report and factor analysis sections above.
Overall, we find that the topics respondents use to describe their experiences effectively serve as significant predictors for reversion, several of which resonate with themes from the previous two analyses. For example, at Day 33, those who described feelings of perceived addiction, seen in the Withdrawal topic, were 37.8% more likely to end up return-ing to the site. We also see a near-significant effect where those who said that “nothing bad happened” were 15% less likely to revert. At Day 66, those who talked about using
other social media showed a 44.7% increase in likelihood of
reversion. Interestingly, those who talked about missing out on events were 31.5% less likely to revert.
These results provide some insights about how different experiences of non-use change the likelihood of reversion. Many topics appear readily interpretable in terms of the most common words in the topic, but not all: for example, it is not obvious at first glance what the topic “about, know, one, don’t, really” means.
To aid interpretation, we select representative examples of responses for each topic by finding the top 50 responses with the highest proportion of the topic. Reading through these responses in an iterative, inductive fashion (cf. Glaser & Strauss, 1967/2009) combines the computational power of topic modeling with some of the linguistic and contextual knowledge provided by human qualitative analysis. For each Table 4. Results of logistic regression showing which factors
predict reversion for each data set.
Factor Coefficient Odds ratio
Day 33 survey
Intercept −1.193 .285 *
Surveillance −.320 .319 **
Enjoyable .488 1.869 *
Perceived addiction .412 1.632 *
Impression management .455 1.481 ***
Manipulated −.676 .265 *
AIC = 1230, BIC = 1066 Day 66 survey
Intercept −1.427 .404*
Impression management .940 1.613 **
Surveillance −.779 .410 *
Rebellious −.197 .986 *
Closed −.854 .697 *
AIC = 1499, BIC = 1549 Day 99 survey
Intercept −1.470 .277 *
Impression management .310 1.491 **
Surveillance −.690 .470 **
Perceived addiction .652 1.672 **
Judged −.970 .072 *
AIC = 1974, BIC = 1853
data set, we provide a close qualitative reading of responses for each of the topics that significantly predicts reversion.
Day 33 Topics. In the Day 33 responses, four topics signifi-cantly predicted reversion.
Withdrawal: first, felt, days, day, check. Responses for this topic often described one initial set of experiences, generally negative, sometimes followed by a different set of experi-ences, often positive. Many of these responses discuss habit, perceived addiction, withdrawal, and so on:
Table 5. At Day 33, respondents who described withdrawal-like experiences were more likely to return to Facebook. Those who described limited reactions from friends, who said they missed photos or updates from friends and family, or who reported that nothing
bad or noteworthy happened were less likely to return. Table includes logistic regression coefficients and odds ratios for each topic, as
well as manually assigned label for topics that significantly predict increased or decreased likelihood of reversion.
Day 33 survey
Label Topic Coeff. Odds ratio
Intercept −1.049 .350 ***
Friends’reactions limited About, know, one, don’t, really −.217 .804 *
Break, wanted, take, experiment, needed −.133 .875
Events, missed, out, friends, missing −.001 .998
Feel, felt, like, more, free .064 1.066
Withdrawal First, felt, days, day, check .321 1.378 ***
Missed content Friends, pictures, miss, photos, family −.165 .847 *
Her, she, friend, with, his −.036 .964
I’m, nervous, will, back, nothing −.153 .857
Life, more, about, people, others −.064 .937
News, information, about, some, miss .024 1.024
Nothing happened Nothing, thing, happened, bad, really −.161 .850 +
Some, most, thought, why, said −.091 .912
Time, more, things, with, other −.108 .897
Time, social, much, too, media −.006 .993
What, about, know, friends, don’t −.108 .897
With, friends, family, touch, keeping .045 1.046
With, friends, people, contact, some −.110 .895
With, people, tired, posts, their −.089 .914
You, don’t, people, like, know −.042 .958
Table 6. At Day 66, those respondents who said they missed out on photos, events, birthdays, or other content were less likely
to return to Facebook. Those who described increased use of other social media were more likely to return. Table includes logistic
regression coefficients and odds ratios for each topic, as well as manually assigned label for topics that significantly predict increased or decreased likelihood of reversion.
Day 66 survey
Label Topic Coefficient Odds ratio
Intercept −1.040 .353 +
About i’m nervous nothing all .199 1.220
Back will i’m use want −.022 .977
Feel more less feeling being .206 1.229
More people friends with phone −.077 .925
More time with spend things −.119 .887
New job getting work got −.100 .904
Nothing think really bad happened −.119 .887
Missed content Out events friends missed some −.377 .685 *
People don t about what know .029 1.029
Reading more books read watching −.031 .968
Other social media Social media other use network .370 1.447 *
With friend got went her .166 1.180
In the first week I got the urge to check Facebook but after a week I did not have that urge anymore. I feel fine about it. (P#33.1031)
Like I was going through withdrawal from an addiction! I had to resist the urge to check it every few minutes. (P#33.1753)
In the first 10 days, I thought about Facebook a lot. Whenever I opened up a browser, my fingers would automatically go to ‘f’. On day 9, I had a dream about accidentally logging in to Facebook—which showed that I was consciously thinking about it. (P#33.3517
I was experiencing withdrawal and felt socially disconnected. The impluse to check FB was very strong, especially when I was feeling low. I caved in after about a week, and began checking FB a few times a day for about a week. But then I decided to quit FB again, which again only last 2-3 days. For the past 4 days I have been checking FB once-twice a day, spending around 5 min per day in total. (P#33.1381)
Respondents who described such initial withdrawal-like experiences, even if eventually overcome, had increased likelihood of returning to Facebook.
Friends’ reactions limited: about, know, one, don’t, really. Responses with high proportions of this topic come largely from the question about how the respondents’ friends reacted. The responses describe a minimal reaction from friends, in some cases that friends did not even notice:
Not many really cared or commented. I don’t think anyone shared in my revolt. (P#33.2766)
They didn’t even notice that I wasn’t there. No one called or emailed to ask what was up. (P#33.351)
Nobody is bothered. Nobody outside fb asked me why I did I do it. On fb if anybody asked I don’t know. (P#33.2989)
Interestingly, many of these responses also note the fact that, since the respondent had not logged in, s/he had not seen the reaction from Facebook friends. Such statements carry a “doesn’t know, don’t care” connotation about friends’ reactions on Facebook.
Missed content: friends, pictures, miss, photos, family. Rep-resentative responses for this topic come mostly from the question about what people miss about Facebook. Respon-dents describe missing not only the photos themselves but also what those photos connote: inside jokes, familial bonds, personal identity, and so on:
I missed my smart friends and their posts, I missed my inspiring friends and their uplifting words and photos. (P#33.2541)
Missing photo / status updates to share news from family overseas. (P#33.3331)
I miss seeing some of the family pictures posted, especially those that others post of my Grandson. (P#33.3585)
Not being able to share photos of my son. Not able to see other photos shared. (P#33.1420)
I miss seeing photos that friends and family are posting. My brother rarely shares photos of my infant niece in places other than FB. (P#33.1219)
Given these responses, it is perhaps surprising that this topic was associated with decreased likelihood of rever-sion. We suggest two possibilities. First, family members may be viewing photos via other routes, for example, the respondent may see the photos via another family member who has a Facebook account, a phenomenon known as dis-placement (Satchell & Dourish, 2009). Second, these may be friends with whom the respondent has regular offline contact, as well, and thus leaving Facebook simply means the loss of a single medium rather than a loss of the social tie entirely.
Nothing happened: nothing, thing, happened, bad, really. The most likely words describe this topic fairly accurately. The topic often occurred in response to questions about the worst thing that happened to the respondent. However, there were also some responses to the question about the best thing that happened wherein the respondent stated that s/he could not think of anything:
Nothing actually, I can’t think of anything bad worth mentioning. (P#33.1592)
I can’t say there has been anything terrible happen. (P#33.230)
not a damn thing. there was nothing on there that enriched my life. only the opposite. (P#33.469)
In examining representative responses for this topic, it becomes apparent that many respondents specifically say that they cannot think of anything bad that happened. Such statements do not rule out the possibility of negative reper-cussions having occurred, but if they are not forefront in the respondent’s mind, then the likelihood of reversion decreases slightly.
Day 66 Topics. In the Day 66 responses, two topics signifi-cantly predicted reversion.
Missing some of the pictures of the grandchildren. And missing some invitations to gatherings. (P#66.768)
I missed a birthday because of not seeing the FB invite. (P#66.485)
Missing out of messages from people and them thinking that I am ignoring them. Missing out on updates for group events. (P#66.2)
I’ve missed notices and pictures that they expected me to see. (P#66.1261)
We can see that birthdays, messages, and photos, in addi-tion to events, are a felt absence for respondents. However, as mentioned above, this topic somewhat surprisingly pre-dicts decreased likelihood of reversion. The implication may be that, if missing a few birthdays and other events is the worst thing that has happened since leaving Facebook, that is not bad enough to precipitate a return before the planned 99 days have passed. In other words, while missing out on the
content of social media emerged as a consistent theme, it is
the people who describe compulsive behaviors who ulti-mately struggle with maintaining non-use.
Other social media: social, media, other, use, network. Responses for this topic evidence mixed experiences. Some of the responses describe filling the time previously spent on Facebook by instead using other social media:
I just use other social media outlets more (instagram, pinterest, etc.). (P#66.163)
Sadly, on other sites! (P#66.421)
My family and I reside in different places, and Facebook is our primary code of contact. I have utilized other social media outlets for connection, and of course, email. (P#66.878)
However, responses for this topic also include more reflective considerations about the role of social media as well as both individual and collective engagement with and through it:
[W]e have to be responsible for our actions on social media. It has great uses, but most people are using it for dramatic response. (P#66.529)
I hate trends (social networks trends). Being out of them makes me feel different, wiser. I create my owm self-esteem, free and independent of “likeses” [sic]. (P#66.1369)
Freedom from social media and the obligation to keep checking and responding on useless information. (P#66.1226)
consider people for who they are and noy [not] for the mask that they weAr on social network [sic]. (P#66.455)
Better use of social media, detox and a bit more happy:) (P#66.374)
Such responses may explain, in part, why this topic pre-dicts increased likelihood of reversion. These respondents are not likely rejecting Facebook on ideological grounds (cf. Portwood-Stacer, 2013) but rather trying to negotiate an acceptable level and style of use, both for themselves and for their social connections (cf. Harmon & Mazmanian, 2013). Reversion in this case may represent a successful accom-plishment of such renegotiation.
Discussion
While each analysis above provides valuable insights, synthe-sizing across them enables us to triangulate on social media reversion from different perspectives. Doing so, we identify four themes—perceived addiction, boundary negotiation, mood, and other social media use—that recur in various ways, as well as show how this article builds upon prior work.
Experiences consistent with perceived addiction appear in the factor analysis and in the topic modeling. In both analy-ses, addiction-associated feelings (withdrawal, sudden urges, limited self-control, etc.) predicted increased likelihood of reversion. Whether or not these individuals would be medi-cally or clinimedi-cally diagnosed as addicted would require at least use of standardized measures (Andreassen, Torsheim, Brunborg, & Pallesen, 2012; Stieger, Burger, Bohn, & Voracek, 2013), if not consultation with medical and psychi-atric experts. These self-report measures indicate only that respondents perceived their subjective experiences as consis-tent with addiction (Douglas et al., 2008). Nonetheless, this result helps confirm that our different methods triangulate to reinforce each others’ results. This finding also confirms prior accounts of non-use as an attempt to break perceived addiction to or habitual use of social media (Baumer et al., 2013; Schoenebeck, 2014; Stieger et al., 2013). Furthermore, issues around (lack of) self-control call into question the role of volitionality in non-use (Wyatt, 2003), suggesting the pos-sibility of non-volitional users.
important to the respondent. Accordingly, this topic predicts decreased likelihood of reversion. In the demographic and Likert analysis, though, the question about how often others asked about the respondent about not being on Facebook was not a significant factor in our model. These findings extend prior work showing that concerns over surveillance lead users to avoid certain features of social networking platforms (Guha & Birnholtz, 2013). The results here show that such concerns can influence (non-)use of an entire site. Future work should examine more closely relationships between concerns over institutional surveillance (the government or Facebook watching users) and over social surveillance (users watching each other) (cf. Baumer et al., 2013).
In results from two of the three surveys, those reporting positive moods were less likely to revert, and those reporting negative were more likely to revert. This result can be seen directly in the demographic and Likert analysis, where mood emerges as a significant predictor in both the 33 and 99 days’ results. A moderate resonance can be seen in the topic model-ing results, specifically, in the “nothmodel-ing bad happened” topic. Although this topic occurs fairly consistently across the data sets, it only significantly predicts (decreased) reversion in the Day 33 data. A similar resonance can also be seen in the factor analysis: the “enjoyable” factor predicted decreased likelihood of reversion in the Day 33 data. While perhaps obvious, only a few examples of prior work have directly considered the potential influence of mood on non-use. In comparing users and non-users of social networking sites, Tufekci (2008) finds that non-users perceive such sites as less appealing or enjoyable. In qualitative studies, partici-pants often cite negative experiences as a motivation for ceasing use of a social technology (Brubaker et al., 2014; Portwood-Stacer, 2013; Schoenebeck, 2014). Satchell and Dourish’s (2009) categories of “disenchantment” and “disin-terest” both connote negative experiences as catalysts for non-use. While such prior work describes how mood might influence non-use, this article extends those findings by examining how mood influences the likelihood of returning from non-use back to use.
Finally, the use of other social media plays an important, though complex, role. Users will sometimes announce their departure from Facebook on other social media, for example, Twitter (Portwood-Stacer, 2013). The analysis here explores subsequent impacts of continued use of other social media. Initially, findings from the demographics and Likert responses seem to conflict with those from the topic model-ing. In the former, use of other social media predicts
decreased likelihood of reversion, while in the latter, the
topic describing other social media use was associated with
increased likelihood of reversion. As described above,
though, this topic included not only descriptions of increased social media use but also reflections on the role of social media in personal relationships. Thus, simply increasing other social media use may decrease the likelihood of rever-sion, but incorporating personal reflection, renegotiation,
and achievement of a more “authentic” self (cf. Harmon & Mazmanian, 2013) increases the likelihood of reversion.
This discussion demonstrates how our different methods complement one another to provide a rich picture of social media reversion. Furthermore, it describes how these find-ings build upon prior work to make contributions in our understanding of social media use and non-use.
Limitations and Future Work
Some of the findings above likely generalize broadly to all situations of technology non-use, while others may not. For instance, feelings associated with perceived addiction may be experienced when dis-using many types of technologies. However, questions around boundary negotiation, that is, impression management and social surveillance (Marwick, 2012; Palen & Dourish, 2003), likely arise from the “social” aspects of “social media.” Thus, factors similar to those we identified would likely arise with many computational tech-nologies designed and/or used to support social interaction. The complex question of where exactly we analytically demarcate between “social” media and other types of tech-nologies or media, though, far exceeds the scope of this arti-cle (see, e.g., Papacharissi, 2015).
The data analyzed here come from a unique, real-world setting and include thousands of respondents. However, since over 40,000 people signed up for 99 Days of Freedom, the response rate is around 10%. Very few respondents com-pleted more than one of the three surveys, and people who returned to Facebook may have been significantly less likely to complete the surveys, giving a skewed sample. Furthermore, since 99 Days of Freedom responded directly to the emotional contagion study (Kramer et al., 2014), those who took the pledge likely represent a particular subset of Facebook non-users. For instance, they may be more attuned to data privacy issues, which may explain in part the salience of concerns over surveillance. They also do not constitute a representative sample of Facebook rejecters (Wyatt, 2003). As noted above, though, these data are not the result of a purposeful, designed social scientific study but a conve-nience sample that happens to be uniquely suited to address questions around social media reversion (cf. Brubaker et al., 2014). Participants in the 99 Days pledge self-selected and had a vested interest in not using Facebook but still returned to the site before they had intended. That said, the above findings may not be representative of attempted non-use more broadly. Future work should examine other instances of attempted non-use followed by reversion. Furthermore, it could be valuable to explore how reversion evolves over time using, for example, experience sampling or other meth-ods to generate more fine-grained temporal data.
techniques used here can provide unique and informative insights that both reinforce and build upon other analyses. However, the approximate nature of topic modeling means that exact results are not perfectly replicable. Although some recent work has explored selecting among different solutions in large document collections (Roberts et al., 2014), more work needs to be done in comparing topic modeling solutions, identifying consistent patterns across multiple solutions, and determining relationships between topics and other variables of interest, particularly for small- to medium-sized data sets.
Finally, this article provides a primarily empirical explora-tion of social media reversion. However, we see this area as ripe for theorization, especially by work that synthesizes across this and other related studies (e.g., Baumer et al., 2013; Brubaker et al., 2014; Rainie et al., 2013; Schoenebeck, 2014). In particular, we suggest individual (sense of) agency as a potentially focal concept. Much prior work deals with how and why individuals use or do not use particular technologies (e.g., Hargittai, 2008; Jurgenson, 2013; Lampe et al., 2013; Portwood-Stacer, 2013; Wyatt, 2003). However, many of our results, such as those pertaining to experiences consistent with perceived addiction and to social boundary negotiation, sug-gest a distributed locus of influence in technology (non-)use. Questions around how much agency an individual actually has, especially in comparison with how much s/he believes s/ he has, in their own technology use should figure prominently in future research, both empirical and theoretical.
Conclusion
This article provides valuable contributions to analyzing and understanding experiences around social media. First, it explores the phenomenon of social media reversion, that is, becoming a technology non-user and then subsequently resuming use of that technology. While hinted at in prior work (Baumer et al., 2013; Brubaker et al., 2014; Schoenebeck, 2014), this article provides the first indepth exploration of the phenomenon.
Second, this article analyzes a unique real-world data set using a novel combination of mixed methods. The analysis fuses multiple quantitative and computational techniques, including logistic regression modeling, factor analysis, and topic modeling. We complement these analyses with a close qualitative reading of a subset of responses. This synthesis highlights four recurrent influences on the likelihood of returning to Facebook. Experiences consistent with perceived
addiction (e.g., withdrawal, compulsive urges) increased the
likelihood of reversion. In terms of boundary negotiation, respondents who attended to surveillance on Facebook were less likely to return, but those who focused on impression management were more likely to return. Positive moods
decreased the likelihood of reversion, while negative moods increased likelihood of reversion. Finally, respondents who replaced Facebook with other social media were less likely to revert unless they also reflected on and renegotiated their
engagement with and through the site. This synthesis enables us to identify and to understand in depth how both individual traits and subjective experiences of non-use may play a role in affecting the likelihood of reversion.
Finally, this article suggests important directions for future work. Methodologically, it opens up intriguing possibilities for combining computational text analysis, such as topic modeling, with survey responses to enable novel, informative approaches to mixed-format data. Conceptually, it provides the first indepth study to focus specifically on social media reversion, demonstrating this as a fruitful area of inquiry and advancing our understanding of experiences around negotiat-ing between use and non-use of social technologies.
Acknowledgements
Thanks to Merijn Straathof and the staff at Just for making the data available for this analysis, and to the individuals who participated in 99 Days of Freedom.
Declaration of Conflicting Interests
The author(s) declared no potential conflicts of interest with respect to the research, authorship, and/or publication of this article.
Funding
The author(s) disclosed receipt of the following financial support for the research, authorship, and/or publication of this article: This material is based in part upon work supported by the NSF under Grant No. IIS-1421498, and by a Small Grant from Cornell’s Institute for Social Science.
Notes
1. http://99daysoffreedom.com/
2. The full survey instrument is available upon request from the authors.
3. A full list of predictors is available from the authors upon request.
4. In all results, p are denoted by + < .1, * < .05, ** < .01, and *** < .001.
References
Acquisti, A., & Gross, R. (2006). Imagined communities: Awareness, information sharing, and privacy on the Facebook.
In Proceedings on Privacy Enhancing Technologies Workshop
(pp. 36–58). Cambridge, UK: Springer.
Andreassen, C. S., Torsheim, T., Brunborg, G. S., & Pallesen, S. (2012). Development of a Facebook Addiction Scale.
Psychological Reports, 110, 501–517.
Backstrom, L., Boldi, P., Rosa, M., Ugander, J., & Vigna, S. (2012). Four degrees of separation. In Proceedings of the 4th Annual ACM
Web Science Conference (pp. 33–42). New York, NY: ACM.
Baumer, E. P. S., Adams, P., Khovanskaya, V. D., Liao, T. C., Smith, M. E., Schwanda Sosik, V., & Williams, K. (2013). Limiting, leaving, and (re) lapsing: An exploration of Facebook non-use practices and experiences. In Proceedings of the SIGCHI Conference on Human Factors in Computing Systems
Blei, D. M., Ng, A. Y., & Jordan, M. I. (2003). Latent dirichlet alloca-tion. The Journal of Machine Learning Research, 3, 993–1022. Brubaker, J. R., Ananny, M., & Crawford, K. (2014). Departing
glances: A sociotechnical account of ‘leaving’ Grindr. New
Media & Society. doi:10.1177/1461444814542311
Carr, N. (2010). The shallows: What the internet is doing to our
brains. New York, NY: W.W. Norton.
Donath, J., & boyd, d. (2004). Public displays of connection. BT
Technology Journal, 22(4), 71–82.
Douglas, A. C., Mills, J. E., Niang, M., Stepchenkova, S., Byun, S., Ruffini, C., & Blanton, M. (2008). Internet addiction: Meta-synthesis of qualitative research for the decade 1996–2006.
Computers in Human Behavior, 24, 3027–3044.
Ellison, N. B., Steinfield, C., & Lampe, C. (2007). The benefits of Facebook “friends”: Social capital and college students’ use of online social network sites. Journal of Computer-Mediated
Communication, 12, 1143–1168.
Glaser, B. G., & Strauss, A. L. (2009). The discovery of grounded
theory: Strategies for qualitative research. London, England:
Transaction Publishers. (Original work published 1967) Guha, S., & Birnholtz, J. (2013). Can you see me now?: Location,
visibility and the management of impressions on foursquare. In
Proceedings of the 15th International Conference on Human-Computer Interaction with Mobile Devices and Services
(pp. 183–192). New York, NY: ACM.
Guha, S., & Wicker, S. B. (2015). Do birds of a feather watch each other? Homophily and social surveillance in location based social networks. In Proceedings of the 18th ACM Conference on Computer Supported Cooperative Work & Social Computing
(pp. 1010–1020). New York, NY: ACM.
Hargittai, E. (2008). Whose space? Differences among users and non-users of social network sites. Journal of
Computer-Mediated Communication, 13, 276–297.
Harmon, E., & Mazmanian, M. (2013). Stories of the smartphone in everyday discourse: Conflict, tension & instability. In
Proceedings of the SIGCHI Conference on Human Factors in
Computing Systems (pp. 1051–1060). New York, NY: ACM.
Humphreys, L. (2011). Who’s watching whom? A study of interac-tive technology and surveillance. Journal of Communication,
61, 575–595.
Jackson, D. A. (1993). Stopping Rules in Principal Components Analysis: A Comparison of Heuristical and Statistical Approaches. Ecology, 74(8), 2204–2214.
Joinson, A. N. (2008). Looking at, looking up or keeping up with people?: Motives and use of Facebook. In Proceedings of the
SIGCHI Conference on Human Factors in Computing Systems.
New York, NY: ACM.
Jurgenson, N. (2013, November 13). The disconnectionists. The
New Inquiry. Retrieved from http://thenewinquiry.com/essays/
the-disconnectionists
Kline, R. (2003). Resisting consumer technology in Rural America: The telephone and electrification. In N. Oudshoorn & T. Pinch (Eds.), How users matter: The co-construction of users and
technology (pp. 51–66). Cambridge, MA: MIT Press.
Kramer, A. D. I., Guillory, J. E., & Hancock, J. T. (2014). Experimental evidence of massive-scale emotional contagion through social networks. Proceedings of the National Academy
of Sciences, 111, 8788–8790.
Lampe, C., Vitak, J., & Ellison, N. (2013). Users and nonusers: Interactions between levels of adoption and social capital. In
Proceedings of the 2013 Conference on Computer Supported
Cooperative Work (pp. 809–819). New York, NY: ACM.
Le Bon, G. (1895). The crowd. London, England: T. Fisher Unwin. Lenhart, A. B. (2005). Unstable texts: An ethnographic look at
how bloggers and their audience negotiate self-presentation,
authenticity, and norm formation (Unpublished master’s
the-sis). Georgetown University, Washington, DC.
Lyon, D. (2007). Surveillance studies: An overview. Cambridge, UK: Polity.
Mainwaring, S. D., Chang, M. F., & Anderson, K. (2004). Infrastructures and their discontents: Implications for ubicomp. In
Proceedings of the Sixth International Conference on Ubiquitous
Computing (pp. 418–432). Berlin, Germany: Springer-Verlag.
Marwick, A. E. (2012). The public domain: Social surveillance in everyday life. Surveillance and Society, 9, 378–393.
Palen, L., & Dourish, P. (2003). Unpacking “privacy” for a net-worked world. In Proceedings of CHI (pp. 129–136). Ft. Lauderdale, FL. New York, NY: ACM.
Papacharissi, Z. (2015). We have always been social. Social Media
+ Society, 1, 1–2.
Portwood-Stacer, L. (2012). How we talk about media refusal, part 1: “Addiction.” Flow, 16(3). Retrieved from http://flowtv. org/2012/07/how-we-talk-about-media-refusal-part-1/ Portwood-Stacer, L. (2013). Media refusal and conspicuous
non-consumption: The performative and political dimensions of Facebook abstention. New Media & Society, 15, 1041–1057. Rainie, L., Smith, A., & Duggan, M. (2013). Coming and going
on Facebook (Pew Internet and American Life Project).
Washington, DC: Pew Research Center.
Roberts, M. E., Stewart, B. M., Tingley, D., Lucas, C., Leder-Luis, J., Gadarian, S. K., & Rand, D. G. (2014). Structural topic models for open-ended survey responses. American Journal of
Political Science, 58, 1064–1082.
Robles, E., Sukumaran, A., Rickertsen, K., & Nass, C. (2006). Being watched or being special: How I learned to stop wor-rying and love being monitored, surveilled, and assessed. In
Proceedings of the SIGCHI Conference on Human Factors in
Computing Systems (pp. 831–839). New York, NY: ACM.
Satchell, C., & Dourish, P. (2009). Beyond the user: Use and non-use in HCI. In Proceedings of the 21st Annual Conference of the Australian Computer-Human Interaction
Special Interest Group: Design: Open 24/7 (pp. 9–16). New
York, NY: ACM.
Schoenebeck, S. Y. (2014). Giving up Twitter for Lent: How and why we take breaks from social media. In Proceedings of the 32nd Annual ACM Conference on Human Factors in
Computing Systems (pp. 773–782). New York, NY: ACM.
Stieger, S., Burger, C., Bohn, M., & Voracek, M. (2013). Who com-mits virtual identity suicide? Differences in privacy concerns, internet addiction, and personality between Facebook users and quitters. Cyberpsychology, Behavior, and Social Networking,
16, 629–634.
Tufekci, Z. (2008). Grooming, gossip, Facebook and MySpace: What can we learn about these sites from those who won’t assimilate?
Information, Communication & Society, 11, 544–564.
Uotinen, J. (2003). Involvement in (the Information) Society-The Joensuu Community Resource Centre Netcafé. New Media &
Society, 5, 335–356.
PANAS scales. Journal of Personality and Social Psychology,
54, 1063–1070.
Wyatt, S. (2003). Non-users also matter: The construction of users and non-users of the Internet. In N. Oudtshoorn & T. Pinch (Eds.), How users matter: The co-construction of users and
technology (pp. 67–79). Cambridge, MA: MIT Press.
Author Biographies
Eric P.S. Baumer (PhD University of California, Irvine) is a Research
Associate in Communication and in Information Science at Cornell University. His research interest include designing language tech-nologies based on social scientific theory, studying social norms around technology (non-)use, and developing alternative concep-tions of “the user” in social technologies.
Shion Guha (MS Cornell University) is a doctoral candidate of
Information Science at Cornell University. His research interests include social network analysis, boundary negotiation processes in social media, and statistics in human-computer interaction.
Emily Quan(MPS Cornell University) is a management consultant
at Optimity Advisors specializing in the Information Management practice with a focus in digital asset management. Her research interests broadly include use and non-use of social media and social networking sites.
David Mimno(PhD University of Massachusetts, Amherst) is a
pro-fessor of Information Science at Cornell University. His research develops new methods for unsupervised machine learning and stud-ies how those methods are applied, particularly in humanitstud-ies and social science.
Geri K. Gay (PhD Cornell University) is the Kenneth J. Bissett