Pathways Involved in Cell Survival, Epithelial to
Mesenchymal Transition and Neuronal Differentiation
Marc P. Forrest
1, Adrian J. Waite
1, Enca Martin-Rendon
2,3, Derek J. Blake
1*1 Institute of Psychological Medicine and Clinical Neurosciences, MRC Centre for Neuropsychiatric Genetics and Genomics, School of Medicine, Cardiff University, Cardiff, United Kingdom, 2 Nuffield Division of Clinical Laboratory Sciences, Radcliffe Department of Medicine, University of Oxford, Oxford, United Kingdom, 3 Stem Cell Research Laboratory, NHS Blood and Transplant, John Radcliffe Hospital, Oxford, United Kingdom
Abstract
Haploinsufficiency of TCF4 causes Pitt-Hopkins syndrome (PTHS): a severe form of mental retardation with phenotypic similarities to Angelman, Mowat-Wilson and Rett syndromes. Genome-wide association studies have also found that common variants in TCF4 are associated with an increased risk of schizophrenia. Although TCF4 is transcription factor, little is known about TCF4-regulated processes in the brain. In this study we used genome-wide expression profiling to determine the effects of acute TCF4 knockdown on gene expression in SH-SY5Y neuroblastoma cells. We identified 1β04 gene expression changes (494 upregulated, 710 downregulated) in TCF4 knockdown cells. Pathway and enrichment analysis on the differentially expressed genes in TCF4-knockdown cells identified an over-representation of genes involved in TGF- signaling, epithelial to mesenchymal transition (EMT) and apoptosis. Among the most significantly differentially expressed genes were the EMT regulators, SNAI2 and
DEC1 and the proneural genes, NEUROG2 and ASCL1. Altered expression of several mental retardation genes such as UBE3A (Angelman Syndrome), ZEB2 (Mowat-Wilson Syndrome) and MEF2C was also found in TCF4-depleted cells. These data suggest that TCF4 regulates a number of convergent signaling pathways involved in cell differentiation and survival in addition to a subset of clinically important mental retardation genes.
Citation: Forrest MP, Waite AJ, Martin-Rendon E, Blake DJ (β01γ) Knockdown of Human TCF4 Affects Multiple Signaling Pathways Involved in Cell Survival, Epithelial to Mesenchymal Transition and Neuronal Differentiation. PLoS ONE 8(8): e7γ169. doi:10.1γ71/journal.pone.007γ169
Editor: Barbara Bardoni, CNRS UMR7β75, France
Received March γ0, β01γ; Accepted July 18, β01γ; Published August βγ, β01γ
Copyright: © β01γ Forrest et al. This is an open-access article distributed under the terms of the Creative Commons Attribution License, which permits unrestricted use, distribution, and reproduction in any medium, provided the original author and source are credited.
Funding: This work was funded by a Medical Research Council (http://www.mrc.ac.uk/index.htm) studentship (MPF) and an MRC Centenary Award (DJB, MPF). The funders had no role in study design, data collection and analysis, decision to publish, or preparation of the manuscript.
Competing interests: The authors have declared that no competing interests exist. * E-mail: [email protected]
Introduction
Transcription factor 4 (TCF4) is a basic helix-loop-helix (bHLH) transcription factor involved in neurodevelopment and dendritic cell diversification in the immune system [1–5]. Mounting genetic and biological evidence supports a crucial role for TCF4 in healthy brain function. Mutations in TCF4
cause Pitt-Hopkins syndrome (PTHS); a severe mental retardation syndrome associated with a facial gestalt, breathing abnormalities, visual problems, delayed speech development and seizures [6–8]. PTHS is caused by deletions, nonsense and missense mutations in the TCF4 gene on human chromosome 18, resulting in haploinsufficiency [6–9]. The majority of TCF4 missense mutations cluster in the bHLH domain of the protein where they attenuate transcription and can impair protein–protein interactions [6,8,10–1β]. In addition to PTHS, balanced chromosomal abnormalities disrupting
TCF4 and copy number variants have been found in patients
with autism and neurodevelopmental disorders that were previously undiagnosed with PTHS [1γ].
In addition to rare mutations, common variants (single nucleotide polymorphisms, SNP) in TCF4 are associated with an increased risk of schizophrenia [14,15]. Genome-wide association studies found that a SNP (rs9960767) located in intron γ of TCF4 was associated with schizophrenia (P = 4.1 x 10⁻⁹), surpassing the statistical threshold for genome-wide
significance [14,15]. Additional TCF4 variants have also been associated with schizophrenia providing further support for
TCF4 isoforms have been described, however the role of the different spliced forms on transcription has not been extensively studied [19,β0]. It is therefore possible that SNPs associated with schizophrenia may differentially regulate the expression of one or more TCF4 isoforms leading to subtle changes in critical neurodevelopmental pathways.
TCF4, TCF1β (HEB), TCFγ (EβA) form the class I bHLH transcription factors in humans [β1]. TCF4 interacts with a potentially large repertoire of transcription factors including the products of proneural genes such as ASCL1, ATOH1 and NEUROD1 to regulate neurogenesis and cell type specification in the developing brain [5,15,ββ,βγ]. ASCL1, ATOH1 and NEUROD1 are bHLH transcription factors that form obligatory heterodimers with TCF4 (and other E-proteins) to regulate gene expression at E-box containing promoters. Heterodimers bind directly to E-boxes that have the consensus sequence “CANNTG” allowing them to regulate gene expression. Additionally, the structurally related ID (inhibitors of differentiation) proteins such as IDβ, are dominant-negative regulators of TCF4. ID proteins form inactive heterodimers with TCF4 preventing the sequestered protein from binding E-boxes or interacting with other transcriptional activators thereby maintaining cells in an undifferentiated state. During neurodevelopment, the balance of E-proteins, proneural and ID proteins in a cell are therefore an important regulatory step in determining cell fate [β4].
The role of TCF4 in brain development and behavior has also been studied in mouse models. Homozygous Tcf4
knockout mice do not survive past birth and although gross brain structure and size does not seem to be affected, there are specific regions of the pontine nucleus where cells fail to migrate to their correct positions [5]. Furthermore, adult mice moderately over-expressing TCF4 in the brain have behavioural abnormalities including deficits in sensory-motor gating and cognitive performance, reminiscent of certain schizophrenia endophenotypes [ββ].
Although TCF4 has been studied in the context of neurodevelopment and behavior, very little is known about TCF4 regulated genes and processes in the developing and adult nervous system. In this study we use small interfering RNA (siRNA) to acutely knockdown TCF4 in the SH-SY5Y neuronal cell line. Using microarrays and conservative pathway analysis we find that TCF4 knockdown is associated with robust gene expression changes in multiple, convergent signaling pathways.
Results
Knockdown of TCF4 in SH-SY5Y cells
To determine the effects of TCF4 depletion on gene expression in a cell line of neuronal origin, we tested a series of siRNA duplexes for their efficacy in knocking down TCF4 in SH-SY5Y cells. SH-SY5Y cells were chosen because they express high levels of TCF4 and can be efficiently transfected with single siRNA duplexes to achieve a robust knockdown. Quantitative PCR (qPCR) and quantitative western blots were used to test the efficacy of each duplex to knockdown TCF4. qPCR analysis of each knockdown showed that KD1 (exon 1β)
caused an 80% reduction of the TCF4 transcript whereas KDβ (exon 19) reduced TCF4 expression by 6β% compared to mock transfected cells (Figure 1A). Importantly, siRNAs targeting GAPDH (exons 1 and β) and mock transfection had no significant effect on the level of the TCF4 transcript (Figure 1A). Reduced levels of the TCF4 protein was also verified by quantitative western blotting (Figure 1B and 1C). Knockdown of
TCF4 with TCF4 KD1 and KDβ resulted in a greater than 80% reduction in proteins levels with both duplexes. KDβ was less effective than KD1 at knocking down the TCF4 protein reflecting the qPCR data.
Microarray analysis of TCF4 knockdown
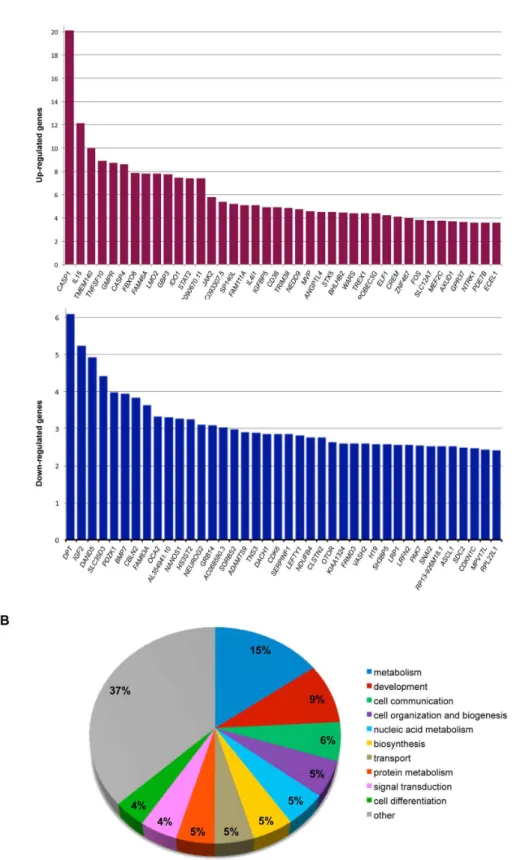
RNA prepared from siRNA-treated cells was converted to cDNA, labeled and hybridized to a Toray microarray for genome-wide transcript analysis. Two control groups, mock transfected and GAPDH siRNA transfected, were used for background correction. The GAPDH siRNA control was used because it has minimal off-target effects and is able to activate the RNA-induced silencing complex (RISC). Since TCF4 KD1 produced more gene expression changes than knockdown with TCF4 KDβ (overlap 79%) both treatment groups were combined in the ANOVA. A one-way ANOVA comparing the control (mock and GAPDH) and TCF4 (TCF4 KD1 and KDβ) knockdown groups was used to identify differentially expressed genes in TCF4-depleted cells. Gene expression changes clustered with the experimental treatment indicating that each siRNA had a distinct but overlapping gene expression signature (Figure S1). A false discovery rate (FDR) of 0.01 was used to generate a high confidence list of 1β04 differentially expressed genes (494 upregulated, 710 downregulated). The top 40 up- and downregulated genes ranked by fold change are illustrated in Figure βA. Initial examination of the most robust gene expression changes in TCF4-knockdown cells (Figure βA) appeared to suggest a role for TCF4 in apoptosis or inflammasome function (up-regulation of CASP1 and
CASP4), cell signaling (down-regulation of IGF2, BMP7 and
LEFTY1) and neurodevelopment (down-regulation of
NEUROG2, ASCL1 and MEF2C). Furthermore, several of the major gene expression changes in TCF4-knockdown cells involved transcription factors including ASCL1 and NEUROGβ that interact directly with TCF4 at E-boxes [6,10,11,β5]. Finally, a number of imprinted genes, IGF2, H19 and CDKN1C were prominent amongst the most significantly downregulated genes in TCF4-knockdown cells (Figure βA).
Figure 1. siRNA-mediated knockdown of TCF4 in SH-SY5Y
cells. SH-SY5Y cells were transfected with siRNA
oligonucleotides targeting TCF4 (KD1 and KDβ) or GAPDH. After 7βh, RNA and protein were extracted to assess the knockdown efficiency. (A) Primers complimentary to a constitutive exon present in all TCF4 isoforms (exon 1γ) were used to measure overall transcript abundance by qPCR in three biological replicates. TCF4 knockdown efficiency was similar with both KD1 and KDβ whereas the control GAPDH KD did not affect TCF4 transcript levels. (B) Western blots of protein lysates prepared from siRNA-treated SH-SY5Y cells demonstrated that KD1 and KDβ reduced TCF4 levels whilst GAPDH knockdown had no apparent effect. α-tubulin was used as a loading control and for normalization. (C) LI-COR quantitation of TCF4 protein levels in siRNA-treated cells. The levels of TCF4 in each experiment were quantified and normalized to α-tubulin as described previously [54,55]. In agreement with the qPCR results, siRNA treatment reduced TCF4 levels to approximately β0% of wild-type compared to mock or GAPDH KD-treated cells.
doi: 10.1γ71/journal.pone.007γ169.g001
Enrichment analysis of differentially expressed genes in TCF4-depleted cells
Initial functional annotations associated with the 1β04 differentially expressed genes in TCF4-knockdown cells were found to span a range of biological functions that cluster around the broad themes of metabolism, development and cell signaling (Figure βB). To ascertain whether any biological functions were enriched in our high confidence gene list, we selected all genes with Entrez gene IDs for enrichment analysis. Of the 1β04 genes that passed FDR correction of 0.01, 10γ1 had corresponding Entrez IDs (4β5 upregulated, 606 downregulated) and were statistically tested for GO annotation enrichment using Database for Annotation, Visualization and Integrated Discovery (DAVID) [β6]. Functional annotations from up- and downregulated genes were compared separately to a background list of genes consisting of all expressed genes detected on the microarray. This analysis identified several biological processes that were significantly enriched (FDR 0.05) in TCF4 knockdown cells. These terms included non-coding RNA metabolic processes, apoptosis and regulation of NF-κB signaling (Table β). Many of the terms in this analysis are related to apoptosis. Importantly, up- and down- regulated genes seemed to cluster by distinct functional annotations (Table β). For example, regulation of the NF-κB and apoptotic signaling cascades and were significantly enriched in the upregulated genes whereas annotations relating to non-coding RNA metabolism, ribosome biogenesis and protein folding were downregulated as a consequence of TCF4 knockdown. Although not all the GO annotations listed in the downregulated gene category passed multiple test correction, they were nominally significant (P < 0.05) and functionally linked.
To determine whether the apoptotic cell death pathway was indeed activated in TCF4-depleted cells, we examined cell viability and caspase activation after treatment with the different siRNAs (Figure γ). TCF4-knockdown was associated with significantly reduced cell viability compared to the control groups (P = β.8x10-16). Reduced cell viability was also
associated with increased caspase γ/7 activity (P = 1.γx10-γ) in
TCF4-depleted cells (Figure γA). Caspase-γ cleavage, which occurs in cells undergoing apoptosis, was also detected by western blotting in TCF4-depleted cells (Figure γB). Interestingly, cells treated with TCF4 KDβ showed more evidence of apoptotic cell death and reduced viability compared to TCF4 KD1. In control experiments, acute staurosporine-treatment was associated with a robust increase in apoptotic cell death in untransfected SH-SY5Y cells. Although no gross differences in cellular morphology were evident between siRNA-treated cells and controls, condensed pyknotic nuclei were frequently observed in TCF4-depleted cells (Figure Sβ).
Differential expression of genes in the TGF-β signaling and EMT pathways in TCF4-knockdown cells
To refine the analysis of downstream gene expression changes due to TCF4 knockdown, we utilized the MetaCoreTM
Figure 2. Overview of differentially expressed genes after TCF4 knockdown. (A) Top 40 upregulated (upper panel) and downregulated (lower panel) genes after FDR correction (0.01) ranked by fold change. (B) Functional characterization of all differentially expressed genes (upregulated and downregulated) (FDR 0.01) using GOSLIM annotations. All annotation categories representing less than 4% of the gene list were grouped and labeled as “other”.
biological processes than GO annotations alone. In this analysis, the full list of up- and downregulated genes with Entrez IDs (10γ1 genes) were interrogated to reveal the concerted function of the top differentially expressed genes. This analysis identified a number of cellular processes in TCF4-knockdown cells including TGF- signaling, epithelial to
Table 1. qPCR validation of differentially expressed genes.
Microarray qPCR
Gene Fold change P value Fold change P value
FAS 1.9 β.88E-05 β.9 γ.58E-05
NTRK1 γ.8 1.5γE-05 4.1 γ.58E-05
CASP8 γ.0 1.γ8E-05 10.4 β.40E-0γ
NOTCH1 β.γ 1.0βE-04 β.9 6.0γE-05
CASP1 15.7 6.1γE-05 9.8 8.06E-0γ
IGF2 -5.β 1.5βE-06 -4.β β.51E-05
CDKN1C -β.4 β.γ6E-06 -β.γ 1.0βE-0γ
NEUROG2 -γ.0 1.50E-05 -γ.6 8.γ0E-07
BMP7 -γ.7 1.γ4E-04 -β.4 5.46E-05
CDK6 -β.9 β.87E-07 -β.6 γ.71E-06 Ten differentially expressed genes belonging to various functional categories were chosen for qPCR validation. All the genes selected for validation had similar fold changes by qPCR to that seen on the microarray. In both cases, the presented P
values represent the statistical significance between the pooled control (mock treated, GAPDH KD) and TCF4 KD (KD1, KDβ) groups.
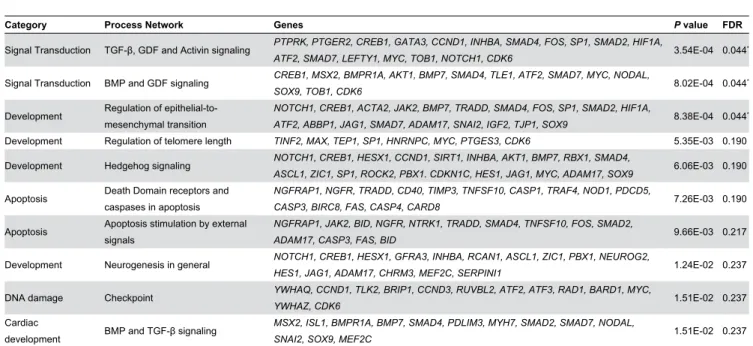
mesenchymal transition (EMT), hedgehog signaling, apoptosis and neurogenesis (Table γ). These data corroborate the findings using DAVID, as process networks relating to apoptosis (“Death Domain receptors and caspases in apoptosis” and “Apoptosis stimulation by external signals”) appeared in the list (Table γ).
Novel terms relating to particular signal transduction pathways and developmental processes were identified using MetaCore (Table γ). Specifically, three process networks passed stringent FDR correction (FDR 0.05). In the signal transduction category we identified process networks associated with “TGF- , GDF and activin signaling” and “BMP and GDF signaling” to be over-represented. These terms refer to signaling through the TGF- superfamily of ligands [β7]. TGF- ligands operate through the activation of transmembrane serine–threonine receptor kinases that phosphorylate SMAD proteins to coordinate cell-type specific gene expression. MetaCore analysis revealed that several elements of the TGF- signaling pathway where differentially expressed after TCF4 knockdown. Differentially expressed genes included two ligands of the TGF- family (INHBA and BMP7), the BMPR1A receptor, and several of the SMAD proteins (SMADβ, SMAD4, SMAD7), demonstrating that each level of the pathway was affected (Table 4).
The third term that remained statistically significant after FDR correction was in the development category and relates to EMT (Table γ). EMT is a developmental process whereby cells loose their adhesive properties and become more motile. EMT is
Table 2. GO term enrichment analysis using DAVID.
GO annotation Genes P value
Corrected P value Upregulated genes (423 DAVID IDs)
1 GO:004γ1ββ~regulation of I-kappaB kinase/NF-kappaB cascade
CD40, TFG, TNFSF10, CASP1, TBK1, PLK2, TRIM38, NOD1, RHOC, HTR2B, WLS,
CARD8, SHISA5, TRADD, ZDHHC17 4.87E-07 8.50E-04*
β GO:004β981~regulation of apoptosis
MEF2C, LOC100289713, NGFRAP1, ARHGEF6, NOTCH1, SH3GLB1, TNFSF13B, B4GALT1, TNFSF10, IDO1, BNIP3, APH1A, NOD1, ADAM17, CARD8, NGFR, SOCS3, KALRN, TRADD, SOX9, MSX2, AEN, CADM1, BARD1, CASP4, CREB1, CD38, CASP1, AKT1, CASP3, MCL1, JAK2, DPF2, TXNIP, FAS, TIA1, ANGPTL4, EYA1, YWHAZ, NTRK1, SIRT1, BCL2L13
1.10E-05 1.9βE-0β*
γ GO:0009967~positive regulation of signal transduction
CD40, BMPR1A, TFG, HIF1A, FKBP8, TNFSF10, CASP1, JAK2, TBK1, PLK2, TRIM38, NOD1, HTR2B, ADAM17, JAG1, RHOC, WLS, RICTOR, SMAD4, SHISA5, TRADD, ZDHHC17
1.18E-05 β.06E-0β*
Downregulated genes (598 DAVID IDs)
1 GO:00γ4660~ncRNA metabolic process
CARS2, FARSB, POP7, TSEN2, WDR12, EXOSC1, DUS3L, TARSL2, ADAT2, RPL35A, PDCD11, PIWIL1, IMP4, QTRTD1, TRMT10C, PUS3, EXOSC7, FTSJ1, MKI67IP, RPL7, DIMT1
β.4βE-05 4.14E-0β*
β GO:00ββ61γ~ribonucleoprotein complex biogenesis
WDR12, GEMIN6, RRS1, EXOSC1, NCBP1, SURF6, RPL35A, TSR1, IMP4, PDCD11,
GEMIN5, EXOSC7, FTSJ1, NUFIP1, MRTO4, RPL7, BYSL, DIMT1 γ.7βE-05 6.γ7E-0β
γ GO:004ββ54~ribosome biogenesis WDR12, RRS1, EXOSC1, SURF6, RPL35A, TSR1, IMP4, PDCD11, FTSJ1, EXOSC7,
MRTO4, RPL7, BYSL, DIMT1 8.01E-05 1.γ7E-01
4 GO:0006457~protein folding BAG2, DNAJC12, SEC63, RUVBL2, FKBP7, GRPEL1, APCS, SACS, PFDN6, HSPBP1,
PPIF, PPID, CCT6A, URI1, PPIH 7.06E-04 1.β0
Figure 3. Knockdown of TCF4 induces apoptosis in SH-SY5Y cells. Cells were treated with siRNAs for 7βh after which cell viability and caspase activity were measured (A). In addition to the siRNA treatment groups, untransfected SH-SY5Y cells were exposed to staurosporine (1µM in DMSO) and vehicle for γh to induce apoptosis. Knockdown of TCF4 leads to a significant reduction in cell viability (P = β.8x10-16, blue bars). Furthermore, TCF4-knockdown is also associated with an increase in caspase
γ/7 activity compared to controls (P = 1.γx10-γ, red bars). Although GAPDH knockdown is associated with reduced cell viability and
elevated caspase γ/7 activity compared to mock-treated cells, both assays showed statistical significant differences between the control groups (mock and GAPDH) compared to TCF4-knockdown (TCF4 KD1 and KDβ) supporting the microarray data. As expected, staurosporine treatment also reduced cell viability and increased caspase γ/7 activity in untransfected cells. Western blot analysis of caspase γ processing after 7βh knockdown shows that caspase γ cleavage products are detected in siRNA treated cells (B). -actin was used as a loading control for all treatment groups.
essential for neural tube formation and is thought to be a key step regulating cancer cell metastasis [β8]. Two important EMT regulators, SNAI2 and DEC1 (BHLHB2 in Figure βA) are differentially expressed in response to TCF4 depletion. SNAI2
promotes EMT and is downregulated in TCF4-knockdown cells whereas DEC1 is upregulated in TCF4-knockdown cells (Figure βA). It is also noteworthy that differentially expressed genes associated to the EMT category are also of general importance to development as they include elements of the Notch, BMP and IGF signaling pathways.
RT-PCR was used to gain further support for the differential expression of EMT genes in TCF4-depleted cells (Figure Sγ). These data confirm the gene expression changes detected on the microarray and show that in addition to SNAI2, SNA11 is also downregulated in TCF4-depleted cells. Importantly, expression of the closely related class I bHLH gene TCF3/E47
was unaltered in TCF4-depleted cells suggesting the alterations in the EMT gene expression pathway occurred independently of E47.
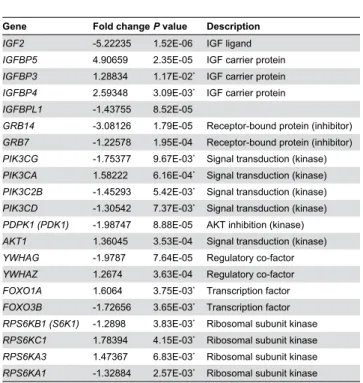
The IGF-signaling pathway also appears to be altered in TCF4-depleted SH-SY5Y cells [β9]. Specifically, IGF2 and
GRB14 are among the most significantly downregulated genes whereas IGFBP5 and the genes encoding other IGF-binding proteins are upregulated in our dataset (Figure β and Table 5). These alterations in gene expression are also evident in downstream elements of the IGF-signaling pathway and include down-regulation of several kinases and adaptor molecules such as AKT1 and RPS6KB1 that encodes the p70 ribosomal S6 kinase (Table 5).
Table 4. Gene expression changes associated with TGF-and Notch signaling pathways in TCF4-knockdown cells.
Gene FC P value Description TGF-β signaling pathway
BMP7 -γ.94 1.γ4E-04 BMP Ligand
BMPR1A β.46 1.81E-05 Tyrosine kinase receptor (BMP)
SMAD2 -β.15 4.γ8E-04 R-SMAD (TGF/Nodal)
SMAD4 1.49 4.71E-04 co-SMAD
SMAD7 1.γ8 γ.97E-04 I-SMAD
SMAD6 1.23 1.04E-0β* I-SMAD
SMAD1 1.28 9.59E-0γ* R-SMAD (BMPR1)
NODAL -1.β5 β.β7E-04 Ligand (Nodal)
INHBA -β.γ8 β.68E-07 Ligand (Activin A)
LEFTY1 -β.81 γ.γ7E-04 Ligand (Inhibitor of Nodal)
Notch signaling pathway
NOTCH1 β.40 1.0βE-04 Ligand receptor
NOTCH2 -1.43 8.48E-0γ* Ligand receptor
JAG1 β.59 4.61E-04 Ligand receptor (inhibitor of Notch)
ADAM17 1.44 γ.8γE-04 metallopeptidase (Notch-cleavage)
APH1A 1.64 1.57E-04 -secretase complex (Notch-cleavage)
HES1 1.65 4.67E-05 Notch effector
HES7 -1.54 6.40E-0γ* Notch effector
Gene expression changes in manually curated signaling pathways in TCF4-knockdown cells. The data are presented as statistically significant (FDR 0.01) gene expression changes (fold change) for the genes in the TGF- and Notch signaling pathways. * Pass FDR correction of 0.05.
Table 3. Process network enrichment in MetaCore.
Category Process Network Genes P value FDR
Signal Transduction TGF- , GDF and Activin signaling PTPRK, PTGER2, CREB1, GATA3, CCND1, INHBA, SMAD4, FOS, SP1, SMAD2, HIF1A,
ATF2, SMAD7, LEFTY1, MYC, TOB1, NOTCH1, CDK6 γ.54E-04 0.044*
Signal Transduction BMP and GDF signaling CREB1, MSX2, BMPR1A, AKT1, BMP7, SMAD4, TLE1, ATF2, SMAD7, MYC, NODAL,
SOX9, TOB1, CDK6 8.0βE-04 0.044*
Development Regulation of epithelial-to-mesenchymal transition
NOTCH1, CREB1, ACTA2, JAK2, BMP7, TRADD, SMAD4, FOS, SP1, SMAD2, HIF1A,
ATF2, ABBP1, JAG1, SMAD7, ADAM17, SNAI2, IGF2, TJP1, SOX9 8.γ8E-04 0.044*
Development Regulation of telomere length TINF2, MAX, TEP1, SP1, HNRNPC, MYC, PTGES3, CDK6 5.γ5E-0γ 0.190 Development Hedgehog signaling NOTCH1, CREB1, HESX1, CCND1, SIRT1, INHBA, AKT1, BMP7, RBX1, SMAD4,
ASCL1, ZIC1, SP1, ROCK2, PBX1. CDKN1C, HES1, JAG1, MYC, ADAM17, SOX9 6.06E-0γ 0.190
Apoptosis Death Domain receptors and caspases in apoptosis
NGFRAP1, NGFR, TRADD, CD40, TIMP3, TNFSF10, CASP1, TRAF4, NOD1, PDCD5,
CASP3, BIRC8, FAS, CASP4, CARD8 7.β6E-0γ 0.190
Apoptosis Apoptosis stimulation by external signals
NGFRAP1, JAK2, BID, NGFR, NTRK1, TRADD, SMAD4, TNFSF10, FOS, SMAD2,
ADAM17, CASP3, FAS, BID 9.66E-0γ 0.β17
Development Neurogenesis in general NOTCH1, CREB1, HESX1, GFRA3, INHBA, RCAN1, ASCL1, ZIC1, PBX1, NEUROG2,
HES1, JAG1, ADAM17, CHRM3, MEF2C, SERPINI1 1.β4E-0β 0.βγ7
DNA damage Checkpoint YWHAQ, CCND1, TLK2, BRIP1, CCND3, RUVBL2, ATF2, ATF3, RAD1, BARD1, MYC,
YWHAZ, CDK6 1.51E-0β 0.βγ7
Cardiac
development BMP and TGF- signaling
MSX2, ISL1, BMPR1A, BMP7, SMAD4, PDLIM3, MYH7, SMAD2, SMAD7, NODAL,
SNAI2, SOX9, MEF2C 1.51E-0β 0.βγ7
Altered expression of neurogenic and neurological disease genes in TCF4-depleted cells
One of the initial aims of this study was to identify gene expression changes in neurodevelopmental genes. Accordingly, we found that the proneural genes ASCL1 and
NEUROG2 were downregulated in TCF4-depleted cells (Figure βA). In addition to the proneural genes, a number of genes implicated in rare Mendelian forms of mental retardation were differentially expressed in TCF4 knockdown cells (Table 6). Interestingly, these differentially expressed genes are mutated in disorders that resemble Rett syndrome and have phenotypic similarities to PTHS. For example, MEF2C is found in the top 40 most significantly upregulated genes in TCF4-knockdown cells (Figure βA). Furthermore, UBE3A (mutated in AS) is downregulated in TCF4 knockdown cells whereas the MWS gene and EMT regulator ZEB2, is upregulated (Table 6).
Discussion
It is now well established that rare, highly penetrant TCF4
alleles are associated with neurodevelopmental phenotypes whereas common variants are associated with disorders such as schizophrenia [6–8,1γ,14]. Recent cognitive and imaging studies have also shown that TCF4 is important for normal brain function [1,15]. However, knowledge of TCF4-regulated genes and pathways in the brain is comparatively sparse.
Table 5. Gene expression changes associated with the IGF signaling pathway in TCF4-knockdown cells.
Gene Fold changeP value Description
IGF2 -5.βββγ5 1.5βE-06 IGF ligand
IGFBP5 4.90659 β.γ5E-05 IGF carrier protein
IGFBP3 1.β88γ4 1.17E-0β* IGF carrier protein
IGFBP4 β.59γ48 γ.09E-0γ* IGF carrier protein
IGFBPL1 -1.4γ755 8.5βE-05
GRB14 -γ.081β6 1.79E-05 Receptor-bound protein (inhibitor)
GRB7 -1.ββ578 1.95E-04 Receptor-bound protein (inhibitor)
PIK3CG -1.75γ77 9.67E-0γ* Signal transduction (kinase)
PIK3CA 1.58βββ 6.16E-04* Signal transduction (kinase)
PIK3C2B -1.45β9γ 5.4βE-0γ* Signal transduction (kinase)
PIK3CD -1.γ054β 7.γ7E-0γ* Signal transduction (kinase)
PDPK1 (PDK1) -1.98747 8.88E-05 AKT inhibition (kinase)
AKT1 1.γ6045 γ.5γE-04 Signal transduction (kinase)
YWHAG -1.9787 7.64E-05 Regulatory co-factor
YWHAZ 1.β674 γ.6γE-04 Regulatory co-factor
FOXO1A 1.6064 γ.75E-0γ* Transcription factor
FOXO3B -1.7β656 γ.65E-0γ* Transcription factor
RPS6KB1 (S6K1) -1.β898 γ.8γE-0γ* Ribosomal subunit kinase
RPS6KC1 1.78γ94 4.15E-0γ* Ribosomal subunit kinase
RPS6KA3 1.47γ67 6.8γE-0γ* Ribosomal subunit kinase
RPS6KA1 -1.γβ884 β.57E-0γ* Ribosomal subunit kinase Gene expression changes in the manually curated IGF signaling pathway in TCF4-knockdown cells. The data are presented as statistically significant (FDR 0.01) gene expression changes sorted by fold change for the genes in the IGF signaling pathway [β9]. * Pass FDR correction of 0.05.
Using genome-wide transcriptional profiling of SH-SY5Y cells where TCF4 was knocked down with siRNAs, we demonstrate that TCF4 reduction affects the expression of genes involved in cell signaling, cell survival and neurodevelopment. By deconstructing the top gene expression changes, we also show that genes controlling apoptosis tend to be upregulated whilst genes that support processes involving non-coding RNA metabolism are downregulated. Process network enrichment analysis also suggests that the TGF- , Notch and IGF signaling pathways may converge on the EMT pathway in TCF4-depleted cells.
GO enrichment analysis implicates TCF4 in apoptosis and non-coding RNA metabolism
We used several bioinformatics tools to search for processes and pathways that may be altered in TCF4-depleted cells. Initial results from GO term enrichment analysis using DAVID showed that apoptosis and NF-κB signaling were statistically significant processes among the upregulated genes. Shared terms in GO categories between NF-κB signaling and cell death categories show that many of the genes in each pathway are the same, indicating some degree of convergence between NF-κB signaling and apoptosis (Table β). In neurons, NF-κB regulates the expression of genes participating in seemingly diverse aspects of neurodevelopment, learning and memory [γ0]. NF-κB signaling has also been implicated in enhancing neuronal apoptosis associated with neurodegenerative disease, brain injury and inflammatory conditions [γ1]. Similarly in neurons, caspase activation is known to be important for axon pruning and synapse elimination and can mediate some of the chronic neuropathological events associated with brain injury or neurodegeneration [γβ]. Since acute knockdown of TCF4 over a period of 7βh reduced cell viability and increased caspase γ/7 activity, up-regulation of some caspases and components of the NF-κB pathway in TCF4-depleted cells may induce cell death (Figure γ). It is therefore possible that TCF4 may regulate the expression of some caspase genes and other components of the pro-apoptotic signaling pathway in SH-SY5Y cells.
Table 6. Altered expression of several mental retardation (MR) genes in TCF4-knockdown cells.
Gene Disease OMIM InheritanceFC P value Reference
TCF4 PTHS 610954 AD -γ.10 β.0β E-05 [9]
MEF2C Syndromic MR 61γ44γ AD γ.7γ 1.γ7 E-05 [50]
UBE3A AS 1058γ0 imprinted -1.γ9 1.56 E-0γ* [59]
ZEB2 MWS βγ57γ0 AD 1.48 γ.60 E-0γ* [60]
FMR1 Fragile X
TCF4-knockdown affects genes in the TGF-β signaling pathway
To gain further insight in to TCF4-regulated pathways, we used MetaCore to identify network processes that were altered in TCF4-depleted cells. Enrichment analysis on the top 10γ1 differentially expressed genes, demonstrated that several components of the TGF- signaling pathway are affected. Specifically, we found robust down-regulation of the TGF-superfamily ligands (BMP7, NODAL, LEFTY1 and INHBA) and altered expression of several downstream components of the TGF- signaling cascade including BMPR1A, and some of the SMAD transcription factors (Table 4). TGF- signaling regulates many aspects of cell proliferation, differentiation, migration and apoptosis [β7]. In the nervous system, TGF-signaling regulates neural crest formation and in also required for neurogenesis, neurite outgrowth and synaptogenesis [γγ,γ4]. Interestingly, Bmp7 regulates the survival and proliferation of neural progenitor cells in the developing neocortex of mice and maintains Ngn2 (the murine orthologue of NEUROG2) in ventricular and subventricular zones of the cortex [γ5]. Notably, both BMP7 (FC, -γ.9γ) and NEUROG2
(FC, -γ.10) are robustly downregulated in TCF4-depleted cells suggesting that TCF4 may coordinately regulate each gene (Figure βA).
TCF4-knockdown affects EMT regulators
In addition to driving developmental programs, TGF-signaling is also involved in EMT.
Process network enrichment identified genes in the EMT pathway to be differentially expressed in TCF4-knockdown cells compared to controls (Table 4). This pathway governs the transition between epithelial and mesenchymal phenotypes known to be important during development and in cancer metastasis [γ6]. TGF- activates SMADs γ and 4 to transcribe
SNAI1 that represses expression of critical epithelial cell genes such as CDH1 (E-cadherin, a commonly used molecular marker of the epithelial phenotype) allowing activated cells to switch to the mesenchymal phenotype [β7]. In addition to components of the TGF- signaling pathway, the EMT regulators SNAI1/2 and DEC1 (BHLHB2 on the array) were differentially expressed in TCF4-knockdown cells (Figure βA and Figure Sγ). SNAI1 and β are transcriptional repressors that bind to E-boxes in the promoter regions of genes including
Cdh1 [γ7]. Similarly, DEC1 is another transcriptional repressor that regulates EMT in pancreatic cancer cells in response to TGF- stimulation [γ8]. Our data are therefore consistent with findings in other cell types showing that the E-proteins TCF4 and E47 are involved in EMT [γ9–41].
Gene expression changes in the IGF signaling pathway
In addition to changes in gene expression associated with the TGF- and Nodal signaling, TCF4-knockdown also alters the expression of components of the IGF signaling pathways (Table 5). TCF4-knockdown is associated with a 5.β fold down-regulation of IGF2 and up-regulation of the genes encoding IGF binding proteins, IGFBPγ, -4 and -5 (Figure βA and Table 5). In the brain, IGFβ is required for memory consolidation and enhancement [4β], adult hippocampal neurogenesis [4γ],
synapse formation and dendritic spine maturation [44]. Since
IGF2 has a role in learning and memory and PTHS patients have profound intellectual disability [45], TCF4 regulation of
IGF2 expression may be a determinant of cognitive dysfunction. IGF1 treatment has been shown to reverse some of the neurophysiological abnormalities in a mouse model of Rett Syndrome lacking methyl CpG-binding protein β (Mecp2
[46]). Because IGF1 and IGFβ activate the same receptor, IGFβ may have some utility in reversing some of the cognitive deficits in PTHS patients. Another component of the IGF pathway RPS6KB1 (encoding a member of the ribosomal protein S6 kinase family), is also downregulated in TCF4-depleted cells (Table 5). RPS6KB1 may be particularly important in the context of neurodevelopment because genetic ablation of this gene rescues multiple physiological and behavioural phenotypes in a mouse model of fragile X syndrome, caused by aberrant synaptic translation [47].
Altered expression of neurodevelopmental genes in TCF4-knockdown cells
ASCL1 and NEUROG2 are important neurogenic bHLH transcription factors that interact directly with TCF4 and appear among the top downregulated genes in TCF-depleted cells (Figure βA and Table β respectively). Since both of these proneural genes are downregulated, this may indicate that as well as regulating proneural activity through protein: protein interactions, TCF4 may also regulate proneural gene expression. In addition to ASCL1 and NEUROG2, other neurodevelopmental transcriptional regulators such as, MEF2C
(syndromic mental retardation) and ZEB2 (MWS) were also differentially expressed in TCF4-depleted cells.
PTHS, MWS and AS are sometimes classified as Rett-like syndromes because of their similar clinical presentation and genetics [9,48]. Furthermore, haploinsufficiency of MEF2C also results in a form of severe mental retardation, with absent speech, hypotonia and epilepsy [49,50]. Importantly, we found that the genes for each of these phenotypically similar disorders (MEF2C, ZEB2 and UBE3A) were differentially expressed in TCF4-depleted cells (Table 6). From a mechanistic perspective, TCF4, ZEBβ and MEFβC can all regulate gene expression at E-boxes in the promoter regions of certain genes [51,5β]. These data, allied with the phenotypic overlap between these disorders, suggest that each of these genes may participate in a similar neurodevelopmental transcriptional pathway. Thus, alterations in the activity or levels of TCF4 as seen in PTHS, autism and possibly schizophrenia, may be associated with dysregulation of several transcription factors that control neurodevelopmental gene expression programs at E-box containing promoters.
contribute to the molecular pathology of common diseases such as autism and schizophrenia.
Methods
RNA interference and transfection
β7 mer RNA oligonucleotide duplexes were designed using predictive algorithms (siDESIGN Center, http:// www.thermoscientificbio.com/design-center/; siMAXTM Design
Tool, http://www.eurofinsdna.com) and were selected for their predicted efficacy scores and homology to regions of interest. Two duplexes (KD1 (exon 1β), GGGACAGACAGUAUAAUGGCAAAUAGA; KDβ (exon19), 5’-AUAAUGACGAUGAGGACCUGACACCAG) were designed to target constitutive exons found in all the published human
TCF4 transcripts [19]. The GAPDH siRNA 5’-CGGAGUCAACGGAUUUGGUCGUAUUGG was used in control experiments to identify transcripts that were altered by RNA interference having minimal off-target affects. siRNAs (Eurofins MWG Operon) were stored as a 50mM stock in siMAX Universal Buffer (γ0mM HEPES, 100mM KCl, 1mM MgClβ; pH 7.γ) at -80°C.
SH-SY5Y (American Type Culture Collection, ATCC) cells were cultured in Dulbecco’s modified Eagle medium (DMEM, Invitrogen) supplemented with 10% (v/v) foetal calf serum (FCS, PAA laboratories) without antibiotics. β4h after seeding, cells were transfected with the different siRNA duplexes (TCF4 KD1 and KDβ, GAPDH or mock) using Lipofectamine® RNAiMAX (Invitrogen) at a final concentration of 10nM. 48h after the first transfection the cells were re-transfected using the same conditions. The following day (7βh after the first transfection), RNA and protein were prepared from each experimental condition. Each transfection was performed in quadruplicate and three biological replicates were used for gene expression analysis whilst the remaining sample was used for western blotting.
Western blotting
For quantitation of protein levels after siRNA treatment, transfected SH-SY5Y cells were lysed in RIPA buffer and the resulting lysates were clarified by centrifugation. 10µg of each lysate was separated on a 1β% gel polyacrylamide gel and transferred to nitrocellulose as described previously [5γ]. Membranes were blocked overnight in blocking buffer (5% (w/v) milk powder in Tris-buffered saline containing Tween-β0 (TBST)) and then incubated with TCF4 (Abnova) and anti-α-tubulin antibodies (1βG10, Developmental Studies Hybridoma Bank, The University of Iowa) diluted in blocking buffer. After extensive washing in TBST, blots were incubated with the appropriate secondary antibody prior to imaging on a LI-COR Odyssey infrared scanner. Proteins levels were quantified using the Odyssey software version β.1 as described previously [54,55].
Quantitative and reverse transcriptase PCR (qPCR and RT-PCR)
RNA was extracted from siRNA-treated cells using RNeasy Plus Mini Kits (QIAGEN) according to the manufacturer’s instructions. Total RNA was treated with Ambion® TURBO DNA-free™ DNase I (Invitrogen) before being converted to cDNA using the ProtoScript® M-MuLV First Strand cDNA Synthesis Kit (NEB). Triplicate β5µl qPCR reactions were prepared on a Corbett robot (Corbett Robotics CAS1β00/ QIAGEN) using 10ng of cDNA as a template, SensiMixTM
SYBR No-ROX (Bioline) and an optimized concentration of gene-specific primers. qPCR was then performed on a Qiagen Rotor-Gene 6000 (Corbett Robotics/QIAGEN). GAPDH, TCF4 and 18S primer efficiencies were all optimized prior to use on experimental samples. Gene expression was quantified using the ΔCT method and 18S rRNA as an internal control. Primer sequences are listed in Table S1A.
TaqMan® gene expression assays were used to validate gene expression changes (NOTCH1, FAS, CASP8, CASP1, NTRK1, NEUROG2, CDK6, BMP7, IGF2 and CDKN1C) after knockdown using pre-optimized reagents (Table S1B). Briefly, 1-10ng of cDNA was used as template in β0µl reactions with the TaqMan® Fast Advanced Master Mix depending on transcript abundance (Applied Biosystems/Life technologies). All samples were run in triplicate according to the Fast Advanced Master Mix protocol using the ABI 7900HT Fast Real-Time PCR System (Applied Biosystems/Life technologies). Results were then analyzed on the RQ Manager 1.β (Applied Biosystems/Life technologies). All genes were normalized to 18S rRNA using the ΔCT method. To calculate fold change, the relative transcript abundance from mock and GAPDH KD samples were pooled and compared to the values of pooled KD1 and KDβ samples. A two-tailed t-test was performed on these two groups to determine statistical significance.
For semi-quantitative RT-PCR, 10ng of cDNA was amplified (γ0 cycles) in a β5µl reaction with REDTaq® DNA Polymerase according to manufacturer’s instructions (Sigma). The sequences of the gene-specific primer pairs are listed in Table S1C. β0µl of the PCR reaction was separated on a β.5% agarose gel containing ethidium bromide. PCR products were imaged with a GelDoc-It® TS Imaging System (UVP).
Toray Microarray
GAPDH) and TCF4 knockdown (KD1, KDβ) groups was then performed to identify differentially expressed genes. A false discovery rate (FDR) was used to correct for multiple testing (FDR < 0.01, 1β04 differentially expressed genes; FDR < 0.05, 5γ74 differentially expressed genes). The data discussed in this publication have been deposited in NCBI’s Gene Expression Omnibus [56] and are accessible through GEO Series accession number GSE48γ67 (http:// www.ncbi.nlm.nih.gov/geo/query/acc.cgi?acc=GSE48γ67).
Enrichment Analysis
The Entrez Gene IDs from the high confidence (FDR 0.01, 10γ1 IDs) gene list was used as the initial dataset for enrichment analysis. In addition, a background list consisting of Entrez Gene IDs from all genes detected by the microarray was also generated (18966 IDs). Biological process GO term enrichment (GOTERM_BP_FAT) was performed using DAVID v 6.7 [β6]. 4β5 upregulated and 606 downregulated genes were analyzed separately using the same background list. Process Network term enrichment was performed using MetaCoreTM
(GeneGo, Thomson Reuters). Here, the full FDR corrected list (10γ1 IDs) was uploaded and compared to the background list of genes. An FDR cut off of 0.05 was used to determine significant enrichment from both analyses. Manually curated pathways were annotated using the Kyoto Encyclopedia of Genes and Genomes (KEGG, http://www.genome.jp/kegg/) Pathways and WikiGenes (http://www.wikigenes.org) web resources [57,58]. Please note that we have used the HGNC (Human Genome Nomenclature Committee) nomenclature for each gene but provide common synonyms for some of the genes that were followed up in this study.
Cell viability and caspase assays
SH-SY5Y cells were plated in 96 well plates and treated with the appropriate siRNAs for 7βh as described above. Cell viability and caspase γ/7 activation were measured in the same plate using the CellTiter-Fluor™ Cell Viability (Promega) and the Caspase-Glo® γ/7 (Promega) assays. Staurosporine-treated (1µM in DMSO, γh at γ7°C) SH-SY5Y cells were used
as a positive control for each assay. Cell viability was measured in β4 replicates of each condition whereas 1β biological replicates were used to assay caspase γ/7 activity. The data were normalized to the levels in the mock-transfected cells, nominally 100%, and represented as the mean and standard error. T-tests were used to compare treatment groups. In addition to the microplate assays, caspase γ cleavage was assessed by western blotting. After treatment, dead cells were collected from the media by centrifugation and lysed with the remaining live cells. 15μg of each lysate was used for western blotting with a caspase γ (#966β, Cell Signaling) and -actin (AC-15, Sigma) antibodies.
Immunocytochemistry
SH-SY5Y cells were processed for immunocytochemistry as described previously [5γ,54]. Briefly, siRNA-treated cells grown on coverslips were fixed in 4% (v/v) formaldehyde, permeabilised with 0.01% (v/v) Triton-X100 and blocked with 10% (v/v) foetal calf serum. Cells were labeled at room
temperature with Alexa Fluor 488 phalloidin (165nM, Invitrogen), Hoechst (1µg/ml, Invitrogen) and an anti-TCF4 polyclonal antibody (Covalab, UK) for 1h followed by Alexa Fluor 546 goat anti-rabbit IgG (Invitrogen) for a further γ0min. After washing in PBS, coverslips were mounted in Aqua-Poly/ Mount (Polysciences, Inc.) and images were captured on a Leica SPβ confocal microscope using a 6γX oil immersion objective lens. Images were assembled using Adobe Photoshop CS4 and only adjusted for brightness and contrast.
Supporting Information
Figure S1. Hierarchical clustering of the top differentially
expressed genes. The top 1β04 differentially expressed genes
(FDR 0.01) cluster by treatment group as evident from the dendrogram to left of the heatmap. Samples from the control treatments (mock and GAPDH KD) and TCF4 KD treatment (KD1 and KDβ) are shown to cluster into defined groups (white and black respectively). The top section of the heat map displays differential expression relative to controls: up-regulated genes are shown in red while down-up-regulated genes are coloured blue.
(EPS)
Figure S2. Cellular imaging of siRNA-treated SH-SY5Y
cells. SH-SY5Y cells were treated with siRNAs for 7βh as
described above. Fixed cells were stained with Alexa Fluor 488 phalloidin (F-actin), Hoescht-γγγ4β (nuclei) and with an anti-TCF4 polyclonal antibody. Although there is a marked reduction in TCF4 immunoreactivity in TCF4 KD cells, no apparent morphological differences are observed between treatment groups after γ days knockdown. A few condensed pyknotic nuclei, indicative of apoptosis were observed after TCF4 KD treatment (arrow heads).
(TIF)
Figure S3. Semi-quantitative RT-PCR analysis of
EMT-regulating transcription factors in TCF4-knockdown cells.
RT-PCR was used to confirm differential expression of several transcription factors that drive EMT. SNAI1 and SNAI2
transcripts are down-regulated in TCF4-knockdown cells whereas BHLHE40 (DEC1) and MEF2C transcripts are up-regulated. These data also show that TCF3/E47 transcripts, which encode a paralogue of TCF4 that is required for EMT, are unaltered in TCF4-depleted cells. Note that alterations in
SNAI1 were not evident on the microarray possibly due to its low expression in SH-SY5Y cells.
(TIF)
Table S1. Primer sequences and TaqMan probes.
(A) qPCR primers used for knockdown quantification (SYBR Green).
Acknowledgements
The authors thank Dominic Sweeney and Ria Chapman for help with the cellular assays and statistical analysis.
Author Contributions
Conceived and designed the experiments: MPF DJB. Performed the experiments: MPF. Analyzed the data: MPF AJW EMR DJB. Contributed reagents/materials/analysis tools: AJW. Wrote the manuscript: MPF EMR DJB.
References
1. Navarrete K, Pedroso I, De Jong S, Stefansson H, Steinberg S et al. (β01γ) TCF4 (eβ-β; ITFβ): A schizophrenia-associated gene with pleiotropic effects on human disease. Am J Med Genet B Neuropsychiatr Genet 16β: 1-16. doi:10.100β/ajmg.b.γβ109. PubMed: βγ1β9β90.
β. Reizis B (β010) Regulation of plasmacytoid dendritic cell development. Curr Opin Immunol ββ: β06-β11. doi:10.1016/j.coi.β010.01.005. PubMed: β014485γ.
γ. Murre C (β005) Helix-loop-helix proteins and lymphocyte development. Nat Immunol 6: 1079-1086. doi:10.10γ8/ni1β60. PubMed: 16βγ99β4. 4. Henthorn P, Kiledjian M, Kadesch T (1990) Two distinct transcription
factors that bind the immunoglobulin enhancer microE5/kappa β motif. Science β47: 467-470. doi:10.11β6/science.β1055β8. PubMed: β1055β8.
5. Flora A, Garcia JJ, Thaller C, Zoghbi HY (β007) The E-protein Tcf4 interacts with Math1 to regulate differentiation of a specific subset of neuronal progenitors. Proc Natl Acad Sci U S A 104: 15γ8β-15γ87. doi: 10.107γ/pnas.0707456104. PubMed: 17878β9γ.
6. Zweier C, Peippo MM, Hoyer J, Sousa S, Bottani A et al. (β007) Haploinsufficiency of TCF4 causes syndromal mental retardation with intermittent hyperventilation (Pitt-Hopkins syndrome). Am J Hum Genet 80: 994-1001. doi:10.1086/51558γ. PubMed: 174γ6β55.
7. Amiel J, Rio M, de Pontual L, Redon R, Malan V et al. (β007) Mutations in TCF4, encoding a class I basic helix-loop-helix transcription factor, are responsible for Pitt-Hopkins syndrome, a severe epileptic encephalopathy associated with autonomic dysfunction. Am J Hum Genet 80: 988-99γ. doi:10.1086/51558β. PubMed: 174γ6β54. 8. Brockschmidt A, Todt U, Ryu S, Hoischen A, Landwehr C et al. (β007)
Severe mental retardation with breathing abnormalities (Pitt-Hopkins syndrome) is caused by haploinsufficiency of the neuronal bHLH transcription factor TCF4. Hum Mol Genet 16: 1488-1494. doi: 10.109γ/hmg/ddm099. PubMed: 17478476.
9. Peippo M, Ignatius J (β01β) Pitt-Hopkins Syndrome. Mol Syndromol β: 171-180. PubMed: ββ6701γ8.
10. Sepp M, Pruunsild P, Timmusk T (β01β) Pitt-Hopkins syndrome-associated mutations in TCF4 lead to variable impairment of the transcription factor function ranging from hypomorphic to dominant-negative effects. Hum Mol Genet β1: β87γ-β888. doi:10.109γ/hmg/ dds11β. PubMed: ββ460ββ4.
11. Forrest M, Chapman RM, Doyle AM, Tinsley CL, Waite A et al. (β01β) Functional analysis of TCF4 missense mutations that cause Pitt-Hopkins syndrome. Hum Mutat γγ: 1676-1686. doi:10.100β/humu. ββ160. PubMed: ββ777675.
1β. de Pontual L, Mathieu Y, Golzio C, Rio M, Malan V et al. (β009) Mutational, functional, and expression studies of the TCF4 gene in Pitt-Hopkins syndrome. Hum Mutat γ0: 669-676. doi:10.100β/humu.β09γ5. PubMed: 19βγ5βγ8.
1γ. Talkowski ME, Rosenfeld JA, Blumenthal I, Pillalamarri V, Chiang C et al. (β01β) Sequencing chromosomal abnormalities reveals neurodevelopmental loci that confer risk across diagnostic boundaries. Cell 149: 5β5-5γ7. doi:10.1016/j.cell.β01β.0γ.0β8. PubMed: ββ5β1γ61. 14. Stefansson H, Ophoff RA, Steinberg S, Andreassen OA, Cichon S et al.
(β009) Common variants conferring risk of schizophrenia. Nature 460: 744-747. PubMed: 19571808.
15. Blake DJ, Forrest M, Chapman RM, Tinsley CL, O’Donovan MC et al. (β010) TCF4, schizophrenia, and Pitt-Hopkins Syndrome. Schizophr Bull γ6: 44γ-447. doi:10.109γ/schbul/sbq0γ5. PubMed: β04β1γγ5. 16. Zhu X, Gu H, Liu Z, Xu Z, Chen X et al. (β01γ) Associations between
TCF4 gene polymorphism and cognitive functions in schizophrenia patients and healthy controls. Neuropsychopharmacology γ8: 68γ-689. doi:10.10γ8/npp.β01β.βγ4. PubMed: βγβ49814.
17. Quednow BB, Ettinger U, Mössner R, Rujescu D, Giegling I et al. (β011) The schizophrenia risk allele C of the TCF4 rs9960767 polymorphism disrupts sensorimotor gating in schizophrenia spectrum and healthy volunteers. J Neurosci γ1: 6684-6691. doi:10.15βγ/ JNEUROSCI.05β6-11.β011. PubMed: β154γ597.
18. Wirgenes KV, Sønderby IE, Haukvik UK, Mattingsdal M, Tesli M et al. (β01β) TCF4 sequence variants and mRNA levels are associated with neurodevelopmental characteristics in psychotic disorders. Transl Psychiatry β: e11β. doi:10.10γ8/tp.β01β.γ9. PubMed: ββ8γβ956. 19. Sepp M, Kannike K, Eesmaa A, Urb M, Timmusk T (β011) Functional
diversity of human basic helix-loop-helix transcription factor TCF4 isoforms generated by alternative 5' exon usage and splicing. PLOS ONE 6: eββ1γ8. doi:10.1γ71/journal.pone.00ββ1γ8. PubMed: β1789ββ5.
β0. Liu Y, Ray SK, Yang XQ, Luntz-Leybman V, Chiu IM (1998) A splice variant of Eβ-β basic helix-loop-helix protein represses the brain-specific fibroblast growth factor 1 promoter through the binding to an imperfect E-box. J Biol Chem β7γ: 19β69-19β76. doi:10.1074/jbc. β7γ.γ0.19β69. PubMed: 9668116.
β1. Massari ME, Murre C (β000) Helix-loop-helix proteins: regulators of transcription in eucaryotic organisms. Mol Cell Biol β0: 4β9-440. doi: 10.11β8/MCB.β0.β.4β9-440.β000. PubMed: 10611ββ1.
ββ. Brzózka MM, Radyushkin K, Wichert SP, Ehrenreich H, Rossner MJ (β010) Cognitive and sensorimotor gating impairments in transgenic mice overexpressing the schizophrenia susceptibility gene Tcf4 in the brain. Biol Psychiatry 68: γγ-40. doi:10.1016/j.biopsych.β010.04.0β6. PubMed: β04γ41γ4.
βγ. Bertrand N, Castro DS, Guillemot F (β00β) Proneural genes and the specification of neural cell types. Nat Rev Neurosci γ: 517-5γ0. doi: 10.10γ8/nrn874. PubMed: 1β094β08.
β4. Powell LM, Jarman AP (β008) Context dependence of proneural bHLH proteins. Curr Opin Genet Dev 18: 411-417. doi:10.1016/j.gde. β008.07.01β. PubMed: 187ββ5β6.
β5. Li S, Mattar P, Zinyk D, Singh K, Chaturvedi CP et al. (β01β) GSKγ temporally regulates neurogenin β proneural activity in the neocortex. J Neurosci γβ: 7791-7805. doi:10.15βγ/JNEUROSCI.1γ09-1β.β01β. PubMed: ββ674β56.
β6. Huang da W, Sherman BT, Lempicki RA (β009) Systematic and integrative analysis of large gene lists using DAVID bioinformatics resources. Nat Protoc 4: 44-57. PubMed: 191γ1956.
β7. Massagué J (β01β) TGFbeta signalling in context. Nat Rev Mol Cell Biol 1γ: 616-6γ0. doi:10.10γ8/nrmγ4γ4. PubMed: ββ99β590.
β8. Acloque H, Adams MS, Fishwick K, Bronner-Fraser M, Nieto MA (β009) Epithelial-mesenchymal transitions: the importance of changing cell state in development and disease. J Clin Invest 119: 14γ8-1449. doi: 10.117β/JCIγ8019. PubMed: 194878β0.
β9. Fernandez AM, Torres-Alemán I (β01β) The many faces of insulin-like peptide signalling in the brain. Nat Rev Neurosci 1γ: ββ5-βγ9. doi: 10.10γ8/nrnγβ09. PubMed: ββ4γ0016.
γ0. Gutierrez H, Davies AM (β011) Regulation of neural process growth, elaboration and structural plasticity by NF-kappaB. Trends Neurosci γ4: γ16-γβ5. doi:10.1016/j.tins.β011.0γ.001. PubMed: β145946β. γ1. Qin ZH, Tao LY, Chen X (β007) Dual roles of NF-kappaB in cell
survival and implications of NF-kappaB inhibitors in neuroprotective therapy. Acta Pharmacol Sin β8: 1859-187β. doi:10.1111/j. 1745-7β54.β007.00741.x. PubMed: 180γ1598.
γβ. Hyman BT, Yuan J (β01β) Apoptotic and non-apoptotic roles of caspases in neuronal physiology and pathophysiology. Nat Rev Neurosci 1γ: γ95-406. doi:10.10γ8/nrnγββ8. PubMed: ββ595785. γγ. Bond AM, Bhalala OG, Kessler JA (β01β) The dynamic role of bone
morphogenetic proteins in neural stem cell fate and maturation. Dev Neurobiol 7β: 1068-1084. doi:10.100β/dneu.ββ0ββ. PubMed: ββ489086.
γ4. Panchision DM, Pickel JM, Studer L, Lee SH, Turner PA et al. (β001) Sequential actions of BMP receptors control neural precursor cell production and fate. Genes Dev 15: β094-β110. doi:10.1101/gad. 894701. PubMed: 11511541.
γ6. Nieto MA (β011) The ins and outs of the epithelial to mesenchymal transition in health and disease. Annu Rev Cell Dev Biol β7: γ47-γ76. doi:10.1146/annurev-cellbio-09β910-1540γ6. PubMed: β1740βγβ. γ7. Cobaleda C, Pérez-Caro M, Vicente-Dueñas C, Sánchez-García I
(β007) Function of the zinc-finger transcription factor SNAIβ in cancer and development. Annu Rev Genet 41: 41-61. doi:10.1146/ annurev.genet.41.110γ06.1γ0146. PubMed: 17550γ4β.
γ8. Wu Y, Sato F, Yamada T, Bhawal UK, Kawamoto T et al. (β01β) The BHLH transcription factor DEC1 plays an important role in the epithelial-mesenchymal transition of pancreatic cancer. Int J Oncol 41: 1γγ7-1γ46. PubMed: ββ8β56β9.
γ9. Sobrado VR, Moreno-Bueno G, Cubillo E, Holt LJ, Nieto MA et al. (β009) The class I bHLH factors Eβ-βA and Eβ-βB regulate EMT. J Cell Sci 1ββ: 1014-10β4. doi:10.1β4β/jcs.0β8β41. PubMed: 19β951β8. 40. Moreno-Bueno G, Cubillo E, Sarrió D, Peinado H, Rodríguez-Pinilla SM
et al. (β006) Genetic profiling of epithelial cells expressing E-cadherin repressors reveals a distinct role for Snail, Slug, and E47 factors in epithelial-mesenchymal transition. Cancer Res 66: 954γ-9556. doi: 10.1158/0008-547β.CAN-06-0479. PubMed: 17018611.
41. Bolós V, Peinado H, Pérez-Moreno MA, Fraga MF, Esteller M et al. (β00γ) The transcription factor Slug represses E-cadherin expression and induces epithelial to mesenchymal transitions: a comparison with Snail and E47 repressors. J Cell Sci 116: 499-511. doi:10.1β4β/jcs. 00ββ4. PubMed: 1β508111.
4β. Chen DY, Stern SA, Garcia-Osta A, Saunier-Rebori B, Pollonini G et al. (β011) A critical role for IGF-II in memory consolidation and enhancement. Nature 469: 491-497. doi:10.10γ8/nature09667. PubMed: β1β70887.
4γ. Bracko O, Singer T, Aigner S, Knobloch M, Winner B et al. (β01β) Gene expression profiling of neural stem cells and their neuronal progeny reveals IGFβ as a regulator of adult hippocampal neurogenesis. J Neurosci γβ: γγ76-γγ87. doi:10.15βγ/JNEUROSCI. 4β48-11.β01β. PubMed: ββγ99759.
44. Schmeisser MJ, Baumann B, Johannsen S, Vindedal GF, Jensen V et al. (β01β) IkappaB kinase/nuclear factor kappa B-dependent insulin-like growth factor β (Igfβ) expression regulates synapse formation and spine maturation via Igfβ receptor signaling. J Neurosci γβ: 5688-570γ. doi:10.15βγ/JNEUROSCI.0111-1β.β01β. PubMed: ββ514γγ0. 45. Van Balkom ID, Vuijk PJ, Franssens M, Hoek HW, Hennekam RC
(β01β) Development, cognition, and behaviour in Pitt-Hopkins syndrome. Dev Med Child Neurol 54: 9β5-9γ1. doi:10.1111/j. 1469-8749.β01β.04γγ9.x. PubMed: ββ71β89γ.
46. Tropea D, Giacometti E, Wilson NR, Beard C, McCurry C et al. (β009) Partial reversal of Rett Syndrome-like symptoms in MeCPβ mutant mice. Proc Natl Acad Sci U S A 106: β0β9-β0γ4. doi:10.107γ/pnas. 081βγ94106. PubMed: 19β08815.
47. Bhattacharya A, Kaphzan H, Alvarez-Dieppa AC, Murphy JP, Pierre P et al. (β01β) Genetic removal of p70 S6 kinase 1 corrects molecular, synaptic, and behavioral phenotypes in fragile X syndrome mice. Neuron 76: γβ5-γγ7. doi:10.1016/j.neuron.β01β.07.0ββ. PubMed: βγ08γ7γ6.
48. Armani R, Archer H, Clarke A, Vasudevan P, Zweier C et al. (β01β) Transcription factor 4 and myocyte enhancer factor βC mutations are
not common causes of Rett syndrome. Am J Med Genet A 158A: 71γ-719. doi:10.100β/ajmg.a.γ4β06. PubMed: ββγ8γ159.
49. Le Meur N, Holder-Espinasse M, Jaillard S, Goldenberg A, Joriot S et al. (β010) MEFβC haploinsufficiency caused by either microdeletion of the 5q14.γ region or mutation is responsible for severe mental retardation with stereotypic movements, epilepsy and/or cerebral malformations. J Med Genet 47: ββ-β9. doi:10.11γ6/jmg.β009.0697γβ. PubMed: 1959βγ90.
50. Zweier M, Rauch A (β01β) The MEFβC-Related and 5q14.γq15 Microdeletion Syndrome. Mol Syndromol β: 164-170. PubMed: ββ6701γ7.
51. Remacle JE, Kraft H, Lerchner W, Wuytens G, Collart C et al. (1999) New mode of DNA binding of multi-zinc finger transcription factors: deltaEF1 family members bind with two hands to two target sites. EMBO J 18: 507γ-5084. doi:10.109γ/emboj/18.18.507γ. PubMed: 10487759.
5β. Molkentin JD, Olson EN (1996) Combinatorial control of muscle development by basic helix-loop-helix and MADS-box transcription factors. Proc Natl Acad Sci U S A 9γ: 9γ66-9γ7γ. doi:10.107γ/pnas. 9γ.18.9γ66. PubMed: 8790γγ5.
5γ. Esapa CT, Waite A, Locke M, Benson MA, Kraus M et al. (β007) SGCE missense mutations that cause myoclonus-dystonia syndrome impair epsilon-sarcoglycan trafficking to the plasma membrane: modulation by ubiquitination and torsinA. Hum Mol Genet 16: γβ7-γ4β. PubMed: 17β00151.
54. Waite A, De Rosa MC, Brancaccio A, Blake DJ (β011) A gain-of-glycosylation mutation associated with myoclonus-dystonia syndrome affects trafficking and processing of mouse epsilon-sarcoglycan in the late secretory pathway. Hum Mutat γβ: 1β46-1β58. doi:10.100β/humu. β1561. PubMed: β17967β6.
55. Locke M, Tinsley CL, Benson MA, Blake DJ (β009) TRIMγβ is an Eγ ubiquitin ligase for dysbindin. Hum Mol Genet 18: βγ44-βγ58. doi: 10.109γ/hmg/ddp167. PubMed: 19γ49γ76.
56. Edgar R, Domrachev M, Lash AE (β00β) Gene Expression Omnibus: NCBI gene expression and hybridization array data repository. Nucleic Acids Res γ0: β07-β10. doi:10.109γ/nar/γ0.1.β07. PubMed: 1175ββ95. 57. Kanehisa M, Goto S, Kawashima S, Okuno Y, Hattori M (β004) The
KEGG resource for deciphering the genome. Nucleic Acids Res γβ: Dβ77-Dβ80. doi:10.109γ/nar/gkh06γ. PubMed: 1468141β.
58. Hoffmann R (β008) A wiki for the life sciences where authorship matters. Nat Genet 40: 1047-1051. doi:10.10γ8/ng.f.β17. PubMed: 187β8691.
59. Mabb AM, Judson MC, Zylka MJ, Philpot BD (β011) Angelman syndrome: insights into genomic imprinting and neurodevelopmental phenotypes. Trends Neurosci γ4: β9γ-γ0γ. doi:10.1016/j.tins. β011.04.001. PubMed: β159β595.
60. Garavelli L, Mainardi PC (β007) Mowat-Wilson syndrome. Orphanet J Rare Dis β: 4β. doi:10.1186/1750-117β-β-4β. PubMed: 17958891. 61. Bhakar AL, Dölen G, Bear MF (β01β) The pathophysiology of fragile X