Melissa Rebelo Vieira
Licenciatura em Biologia Celular e Molecular
Carbon monoxide:
novel strategy to promote neuronal differentiation
Dissertação para obtenção do Grau de Mestre em
Genética Molecular e Biomedicina
Orientadora: Prof. Doutora Helena Luísa de Araújo Vieira
Investigadora PI, CEDOC-FCM, UNL
Júri:
Presidente: Prof. Doutora Paula Gonçalves Arguente: Prof. Doutor Vítor Espírito Santo
Vogal(ais): Prof. Doutora Helena Luísa de Araújo Vieira
Melissa Rebelo Vieira
Bachelor in Cellular and Molecular Biology
Carbon monoxide:
novel strategy to promote neuronal differentiation
Thesis for Master´s Degree in
Molecular Genetics and Biomedicine
Supervisor: Prof. Dr. Helena Luísa de Araújo Vieira
PI, CEDOC-FCM, UNL
V
Carbon monoxide: novel strategy to promote neuronal differentiation
Copyright Melissa Rebelo Vieira, FCT/UNL, UNL
A Faculdade de Ciências e Tecnologia e a Universidade Nova de Lisboa têm o direito, perpétuo e sem limites
geográficos, de arquivar e publicar esta dissertação através de exemplares impressos reproduzidos em papel ou
de forma digital, ou por qualquer outro meio conhecido ou que venha a ser inventado, e de a divulgar através de
repositórios científicos e de admitir a sua cópia e distribuição com objectivos educacionais ou de investigação,
VII
Acknowledgments
It would not been possible to write this master’s thesis without the help and support of the kind people around me. I would like to convey my gratitude to my friends and family and share the happiness of completing my master’s thesis.
Above all, I would like to thank my family for the personal support and great patience at all times. Especially my parents and brother to whom a mere expression of thanks will not be enough. Hope someday I will be able to repay the effort and love, do the same and much more. Also to my grandmother, I miss you and our time together.
All this year has been valuable on both academic and personal levels. For that I thank my supervisor, Dr. Helena Vieira, for the teachings, insightful comments and guidance. It is a great honour and an inspiration to meet a person that really loves science.
My fellow colleagues in the laboratory - Sofia, Queiroga, Pereira, Sara, Daniela, Mafalda and even Isabel - I am thankful for the fun times with the group, assistance in the laboratory and good advices. To CEDOC colleagues that work as a big family doing great science.
To my friend Ana Brito, I am grateful for the support and for believing in me even when I did not. To the UBF family for teaching me a valuable lesson of life in showing me the one that guides me spiritually throughout my life.
Thank to all others who I may have not referred personally but that directly or indirectly contributed to my work and personal growth.
IX
Abstract
Neurodegenerative and ischemic diseases are a major cause of disability and death in industrialized society. Novel strategies to stimulate neurogenesis and neuronal differentiation are potential therapy approaches.
Neuronal differentiation is a high demanding process involving changes in gene expression, cell function and morphology. When differentiation is triggered, proliferation decreases and several signals activate intracellular pathways related to neuronal induction and fate. The modulation of mitochondrial function and cell metabolism is necessary for supporting the new metabolic needs.
The endogenous product of heme-oxygenase (HO) activity – carbon monoxide (CO) is recognized as
a cytoprotective and homeostatic molecule. CO’s biological activities are mainly anti-apoptotic, anti-inflammatory and anti-proliferative functions. They can involve ROS signalling and promotion of mitochondrial biogenesis.
Our working hypothesis is that CO might play a role in neuronal differentiation. The present work proposal aims to study CO as a potential player in neuronal differentiation and to disclose the cellular pathways implicated in this process.
CO-releasing molecule A1 (CORM-A1) was used as CO source. The in vitro models SH-SY5Y and NT2 human cell lines were used to explore the effect of CO during neuronal differentiation.
In SH-SY5Y cell model, the process was studied by assessing changes in cell number, protein expression and mitochondrial population of the final cell population. The neuronal differentiation protocol consisted of decreasing serum concentration and adding retinoic acid (RA) in the medium, in co-treatment with CORM-A1. Neuronal differentiation process decreased total SH-SY5Y cell population, increased βIII-tubulin expression and enhanced mitochondrial population. CO seems to improve neuronal differentiation, nevertheless these data need to be further explored and clarified.
Overall this work set the main tools that will be used in the future for continuing this research project on CO as a potential promoter of neuronal differentiation.
Resumo
As doenças neurodegenerativas e isquémicas são a maior causa de incapacidade e morte nos países industrializados. As novas estratégias para promover a neurogénese e a diferenciação neuronal são potenciais abordagens terapêuticas.
A diferenciação neuronal é um processo exigente envolvendo alterações da expressão genética, funcionamento e morfologia celular. Quando a diferenciação é desencadeada, a proliferação diminui e diversos sinais activam vias intracelulares de indução e linhagem neuronal. Adaptações ao nível da função mitocondrial e metabolismo celular são necessárias para suportar as novas necessidades metabólicas.
O monóxido de carbono (CO), produto endógeno da actividade da heme-oxigenase (HO), é reconhecido como molécula homeostática e citoprotectora. As actividades biológicas do CO são maioritariamente anti-apoptóticas, anti-inflamatórias e anti-proliferativas. Elas podem envolver sinalização por ROS e aumento da biogénese mitocondrial.
A nossa hipótese baseia-se no potencial papel do CO na modulação da diferenciação neuronal. O objectivo é estudar o CO como indutor da diferenciação neuronal e compreender as vias celulares implicadas neste processo.
A molécula libertadora de CO - CORM-A1 foi usada como fonte de CO. Os modelos in vitro de linhas celulares humanas, SH-SY5Y e NT2, foram usados para explorar o efeito do CO.
No modelo celular SH-SY5Y, a diferenciação neuronal foi estudada através da avaliação da população celular, expressão proteica e população mitocondrial no final do processo. O protocolo usado para estimular a diferenciação neuronal baseia-se na diminuição do soro e suplementação de ácido retinóico (RA) no meio de cultura, em co-tratamento com a CORM-A1. O processo de
diferenciação neuronal diminuiu a população total, aumentou a expressão de βIII-tubulina e aumentou a população mitocondrial. O CO parece promover a diferenciação neuronal, contudo mais resultados são necessários para validar esta tendência.
Esta dissertação estabelece as ferramentas fundamentais a serem usadas no futuro no estudo do CO na promoção da diferenciação neuronal.
XI
Contents
Acknowledgments ... V
Abstract ... VII
Resumo ... VIII
Figure Index ... XIII
Table Index ... XV
Abbreviations ... XVI
I. Introduction ... 1
1. Adult neurogenesis ... 3
2. Neuronal differentiation ... 3
2.1 Induction of neuronal differentiation by retinoic acid (RA) ... 4
2.2 Metabolic adaptations during neuronal differentiation ... 5
2.3 O2 concentrations and mitochondrial biogenesis during neuronal differentiation ... 6
2.4 ROS generation and signalling during neuronal differentiation ... 6
3. Neurogenesis and pathophysiology of the brain ... 6
3.1 Neurodegenerative and ischemic diseases ... 6
3.2 In vivo and in vitro strategies to induce neurogenesis and neuronal differentiation ... 7
4. Biological activity of carbon monoxide (CO) ... 7
4.1 CO and the central nervous system (CNS) ... 8
4.2 Therapeutic strategies with CO ... 9
4.3 CORM-A1 characteristics and advantages ... 9
5.
In vitro
models for studying neuronal differentiation ... 10
5.1 SH-SY5Y neuroblastoma cell line ... 10
5.2 NT2 human teratocarcinoma cell line ... 11
5.3 Advantages of continuous cell line based-models ... 11
6. Aim ... 12
II. Materials and Methods ... 13
7. Cell culture medium, material and solutions ... 15
7.1 Materials /Reagents ... 15
8. SH- SY5Y neuroblastoma cell line ... 16
8.1 Cell line ... 16
8.2 Cell culture maintenance ... 16
8.3 Cell passage for neuronal differentiation ... 16
8.4 Neuronal differentiation treatments ... 16
9. NT2 human teratocarcinoma cell line ... 17
9.1 Cell line ... 17
9.2 Cell culture maintenance ... 17
9.3 Cell passage for neuronal differentiation ... 17
9.4 Neuronal differentiation treatments ... 17
9.5 Replate to neuronal enrichment ... 17
9.6 Neuronal enrichment ... 17
10. Experimental protocols ... 18
10.1 Optical microscopy ... 18
10.2 Cell count... 18
10.3 Western blot ... 18
10.4 Flow cytometry ... 20
10.5 Immunofluorescence microscopy ... 20
10.6 Statistical analysis ... 20
III. Results ... 21
11. Validation of neuronal differentiation protocol in SH-SY5Y cells ... 23
11.1 Design and establishment of a neuronal differentiation protocol ... 23
11.2 Neuronal differentiation induces changes in the morphology of SH-SY5Y cells ... 24
11.3 Neuronal differentiation modulates the final cell population of SH-SY5Y cells ... 27
11.4 Neuronal differentiation induces changes in protein expression of SH-SY5Y cells ... 27
11.5 Neuronal differentiation modulates the mitochondrial population of SH-SY5Y cells ... 30
12. Enhancement of neuronal differentiation process via CORM-A1
treatment in SH-SY5Y cell line ... 31
12.1 CORM-A1 treatment does not alter morphology of SH-SY5Y cells during neuronal differentiation ... 31
12.2 CORM-A1 effect in the final cell population of SH-SY5Y cells during neuronal differentiation ... 34
XIII
12.4 CORM-A1 treatment modulates mitochondrial population of
SH-SY5Y cells during neuronal differentiation ... 37
13. Enhancement of neuronal differentiation process via CORM-A1
treatment in NT2 cell line ... 39
13.1 Neuronal differentiation induces changes in cell morphology and
protein expression of NT2 cells ... 39 13.2 CORM-A1 treatment modulates the final cell population of NT2 cells
during neuronal differentiation ... 41
IV. Discussion ... 43
XV
Figure Index
I. Introduction
Figure 1.1 – Adult neurogenic niches – niches anatomy, cell types, steps of neurogenesis
process and stage specific markers expression... 4
Figure 1.2 – Cascade of classes of mammalian cells with neural capability, their source and respective potential ... 5
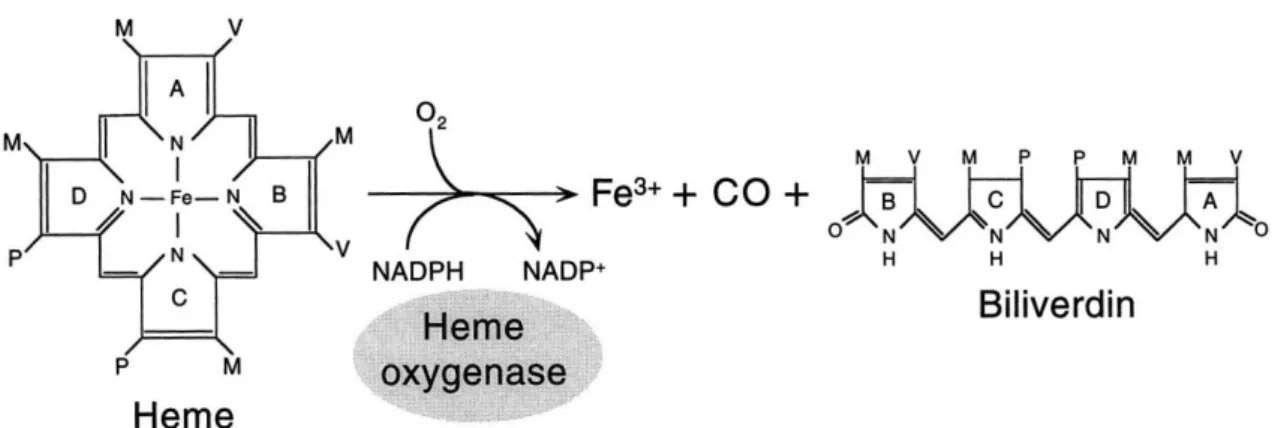
Figure 4.1 – Representation of heme reaction of catabolism ... 7
Figure 4.2 – Chemical structure of the molecule CORM-A1 ([H3BCO2]Na2)... 9
II. Materials and Methods
Figure 8.1 – SH-SY5Y cells culture for neuronal differentiation ... 16Figure 9.1 – NT2 cells culture for neuronal differentiation ... 18
III. RESULTS
Figure 11.1 – Morphological analysis of SH-SY5Y cells during neuronal differentiation, day 0 ... 25Figure 11.2 – Morphological analysis of SH-SY5Y cells during neuronal differentiation, day 7 ... 26
Figure 11.3 – Cell number analysis on nuclei count with crystal violet ... 27
Figure 11.4 – Protein analysis of the 7th day of neuronal differentiation ... 28
Figure 11.5 –Quantification of βIII-tubulin expression in SH-SY5Y cells ... 29
Figure 11.6 – Quantification of NeuN expression in SH-SY5Y cells ... 29
Figure 11.7 – Representative gates and layout used to evaluate mitochondrial population ... 30
Figure 11.8 – Quantification of mitochondrial population in SH-SY5Y cells by flow cytometry analysis ... 31
Figure 12.1 – Morphological analysis of SH-SY5Y cells during neuronal differentiation, day 7 ... 32
Figure 12.2 – Morphological analysis of SH-SY5Y cells treated with CORM-A1 during neuronal differentiation, day 7 ... 33
Figure 12.3 – Cell number analysis on nuclei count with crystal violet ... 34
Figure 12.4 – Protein analysis of the 7th day of neuronal differentiation ... 35
Figure 12.5 –Quantification of βIII-tubulin expression in SH-SY5Y cells ... 36
Figure 12.6 – Quantification of NeuN expression in SH-SY5Y cells ... 36
Figure 12.7 – Representative gates and layout used to evaluate mitochondrial population ... 37
XVII
Table Index
II. Materials and Methods
Table 7.1 – Cell culture reagents – medium and supplements ... 15
Table 10.1 – Components for preparation of 10%(v/v) SDS-PAGE gel (20-80kDa)... 19
Table 10.2 – Solutions and buffers composition ... 20
Table 10.3 – Antibodies used in western blot and immunofluorescence techniques ... 20
III. Results
Table 11.1 – Different protocols using SH-SY5Y cells as a model of neuronal differentiation . 23 Table 11.2 – Selected protocol using SH-SY5Y cells as a model of neuronal differentiation ... 24Table 11.3 – Western blot bands identification ... 28
Abbreviations
APS - ammonium persulfate ATP – adenosine triphosphate BCA - bicinchoninic acid BSA - bovine serum albumin ChAT - choline acetyltransferase CNS – central nervous system CO – carbon monoxide
CORM – carbon monoxide releasing molecule DAT – dopamine active transporter
DMEM - dulbecco’s modified eagle medium DMSO - dimethyl sulfoxide
DNA – deoxyribonucleic acid
ECL - enhanced chemiluminescence EDTA – ethylenediamine tetraacetic acid FBS – fetal bovine serum
GFAP-glial fibrillary acidic protein HO - heme-oxygenase
Ki-67 – (MKI67) marker of proliferation Ki-67 MAP2 – microtubule associated protein 2 MAPK – mitogen activated protein kinases NeuN – neuronal nuclei
NSC – neural stem cell
NSE – neuron specific enolase NT2 - NTERA-2 clone D1 cell line O2– oxygen
PBS – phosphate buffer saline PCR – polymerase chain reaction RA – retinoic acid
RIPA – radio immunoprecipitation assay ROS – reactive oxygen species
RT – room temperature
SDS-PAGE – sodium dodecyl sulfate–polyacrylamide Sox2-SRY (sex determining region Y) box 2
TEMED - tetramethylethylenediamine TH - tyrosine-hydroxylase
T-TBS – tris-buffered saline with tween 20
I. Introduction
3
1. Adult neurogenesis
Neurogenesis is a process of generation of functional neurons. Neural populations of precursor cells undergo steps of fate specification to terminally differentiate into neurons. Neurogenesis is described as a process occurring throughout life and conserved across species (Ming & Song 2011).
Adult neurogenesis in higher vertebrates provides neuronal replacement, crucial to physiological renewing of cerebral tissue, as well as in response to stress situations (Burns et al. 2009). Adult neurogenesis in mammals is confined to discrete brain regions, neurogenic niches. In the anterior part of the subventricular zone new neurons are generated and migrate to the olfactory bulb through the rostral migratory stream differentiating into interneurons (figure 1.1 - A). Neuronal precursors in the subgranular zone migrate locally to the granule cell layer and differentiated into dentate granule mature neuronal cells and extend axonal projections to the Cornu ammonis region (figure 1.1 - B) (Ming & Song 2011).
In the neurogenic niches resides a population of precursor cells comprising adult neural stem cells (NSCs) and progenitor cells (Ming & Song 2011). Precursor cells are maintained in a reversible state of dormancy and minimal basal activity. Able to leave this state by a rapid activation of signaling pathways, cells rapidly proliferate and differentiate in response to signal conditions (Cheung & Rando 2013; Kawaguchi et al. 2013). The self-renewal ability is sustained by two types of cell division: symmetric division replaces the stem cell population; and asymmetric division generates cells with a more restricted fate (Götz & Huttner 2005). The neurogenic niches are specialized to support proliferation, migration and differentiation with a highly self-renewal capacity, potential and propensity to generate certain cell types in a spatially and temporally defined manner. Precursor cells can give rise to differentiated neural cell types, initially forming neurons and, at later stages, different types of glia cells (figure 1.2) (Gage 2000).
2. Neuronal differentiation
In the process of cell differentiation, precursor cells start to lose their undifferentiated characteristics and gain specific cell type differentiation markers. The process of cell differentiation involves several cellular changes on the level of gene expression, function and morphology. When differentiation is triggered, metabolic adaptations provide a source of energy and building blocks to synthesis of new molecules (Ming & Song 2011).
Figure 1.1 - Adult neurogenic niches – niches anatomy, cell types, steps of neurogenesis process and stage-specific markers expression. A - Subventricular zone: activation of glia-like cells (1), proliferation (2), generation of neuroblasts (3), migration to olfactory bulb (4), maturation and integration of interneurons (5). B - Subgranular zone of dentate gyrus: activation of glia-like cells (1), proliferation (2), generation of neuroblasts (3), integration (4) and maturation of granule cells (5). [BLBP-brain lipid-binding protein, CA3-Cornu Ammonis, DCX-doublecortin, Dlx2-distal-less homeobox 2, GAD65-glutamic acid decarboxylase 65, GCL-granule cell layer, GFAP-glial fibrillary acidic protein, LV-lateral ventricle, Mash1-mammalian achaete-scute comlex homolog 1, MCM2-minichromosome maintenance complex component 2, ML-molecular layer, NeuN-neuronal nuclei, Prox1-Prospero homeobox 1, SGZ-subgranular zone, Sox2-SRY (sex determining region Y) box 2, SVZ-subventricular zone, Tbr2-T-box brain 2]. Adapted from (Ming & Song 2011).
2.1 Induction of neuronal differentiation by retinoic acid (RA)
RA, metabolite of vitamin A, is a contributor factor for initiation of neural differentiation. RA isoforms, as example of all-trans RA, mediate the transcription of target genes associated with neural differentiation (Lie et al. 2006). Distinct cell susceptibility and response to RA exposure is detectable within a total population of neural precursor cells (Orsolits et al. 2013). RA is broadly used in in vitro
5 Figure 1.2 – Cascade of classes of mammalian cells with neural capability, their source and respective potential. Starting with the zygote, precursor cells progress through the pathway of differentiation in each step to a more restricted fate. Cells present distinct degrees of self-renewal and potency and also possible a dedifferentiation capacity. Adapted from (Gage 2000).
2.2 Metabolic adaptations during neuronal differentiation
2.3 O2 concentrations and mitochondrial biogenesis in neuronal differentiation
Differential O2 tensions in the neurogenic niche and surroundings are physiologically involved in
quiescence, proliferation and differentiation of NSCs. Hypoxic conditions (2,5-5% O2) seems to
promote self-renewal and proliferation, supporting the survival of precursors. Amplifying progenitor cells tend to migrate to higher levels of O2, since an efficient differentiation is associated with an
increase of aerobic metabolism (Santilli et al. 2010). The dependence on a constant and abundant supply of ATP requires adequate provision of O2 and mitochondrial activity.
Mitochondrial mass and DNA content increase with spontaneous differentiation of human embryonic stem cells followed by ATP and reactive oxygen species (ROS) production (Cho et al. 2006). Experiments involving mouse embryonic stem cells differentiation into cardiomyocytes showed that mitochondrial biogenesis was enhanced and required for anaerobic glycolysis transition to mitochondrial respiration (Chung et al. 2007). NeuroD6 transcription factor, modulator of survival and energy pathways contributing to neuronal differentiation, is associated with enhanced mitochondrial biogenesis, high membrane potential, expression of respiratory chain subunits and high ATP levels in early stages of neuronal differentiation of PC12 cells (Baxter et al. 2012).
2.4 ROS generation and signaling during neuronal differentiation
Low levels of ROS generation are an important event in cell signaling during differentiation. Human embryonic stem cell lines increase ROS production during differentiation, as result of increased mitochondrial biogenesis (Cho et al. 2006). Reduction of ROS intracellular production decreases expression of neuron-like markers (N-cadherin and βIII-tubulin), during RA-induced neuronal differentiation of P19 embryonal carcinoma cells (Konopka et al. 2008). In neuregulin-induced differentiation of PC12 cells, ROS production regulates activation of Ras and Erk of MAPK pathway and modulates neuronal differentiation (Goldsmit et al. 2001). It would appear then that ROS act as signaling factors on specific downstream targets activating several pathways of neuronal differentiation.
3. Neurogenesis and the pathophysiology of the brain
3.1 Neurodegenerative and ischemic diseases
The increasing life expectancy in the society leads to prevalence of neurodegenerative diseases within the aging population. Neurodegenerative diseases comprise a wide spectrum of complex neural
disorders characterized by cell degeneration. Parkinson’s disease, Huntington’s disease or Alzheimer’s disease are some examples of chronic neurodegenerative diseases that present a
7
survivors. Hypoxic-ischemic encephalopathy involves a lack of O2 and glucose supply in the brain tissue. Although being a massive pathology, few therapeutic approaches are available and approved: hypothermia for newborns and administration of recombinant tissue plasminogen activator for adult ischemic stroke, both presenting a very short time-window for treatment (Khaja & Grotta 2007; Wachtel & Hendricks-Muñoz 2011). Therefore new therapies based on neurogenesis promotion can be a promising strategy.
3.2 In vivo and in vitro strategies to induce neurogenesis and neuronal differentiation
Taking into account the limited options of treatment, neurodegenerative and ischemic diseases represent potential targets for restorative therapies. Adult neurogenesis is limited under physiological conditions but could be induced after injury. Indeed, therapeutic strategies via modulation/enhancement of endogenous neurogenesis and neuronal differentiation represent a path with great interest to exploit for an effective tissue recovery (Burns et al. 2009). Another potential strategy concerns cell replacement therapy, which may be achieved by in vitro differentiation into desired cell types following transplantation into the affected region or by direct transplantation of stem cells followed by spontaneous or promoted in vivo differentiation (Yasuhara et al. 2008). In both strategies, (i) promotion of neurogenesis or (ii) cellular transplantation (stem cells, neuronal precursors or postmitotic neurons), there is an urgent need of deeper knowledge on neuronal differentiation. A better understanding of the important cellular and molecular processes involved in neuronal differentiation, creates the opportunity for screening treatment strategies, in order to facilitate and optimize them.
4. Biological activity of carbon monoxide (CO)
CO is an endogenous molecule produced during heme degradation, along with iron and biliverdin, by heme-oxygenase (HO) enzymes (figure 4.1) (Ryter Jawed Choi, Augustine M. K. 2006). CO binds mostly to transition metals with a specific redox state (Alberto & Motterlini 2007).
CO competes along with molecular O2 for hemoproteins (Bilban et al. 2008). The high affinity of
hemoglobin for CO facilitates the production of carboxy-hemoglobin, whose elevated levels can lead to intoxication, since it impairs the delivery of O2. Biological functions and therapeutic potential of CO
at low doses have been highlighted in numerous models of tissue and cell types (for review Bilban et al. 2008; Bannenberg and Vieira 2009; Ryter Jawed Choi, Augustine M. K. 2006; Motterlini and Otterbein 2010).
4.1 CO and the central nervous system (CNS)
The involvement of CO in several important aspects of cerebral regulation demonstrates its functional significance in the central nervous system. Endogenous production of CO occurs in every cell of the body and a major source of CO is dependent on HO enzymes (Abraham & Kappas 2008; Mahan 2012). HO active enzyme is expressed as three isoforms, being the two most common 1 and HO-2. HO-1 is ubiquitously induced under neuroinflammatory and stress response conditions in the CNS (Ryter Jawed Choi, Augustine M. K. 2006; Abraham & Kappas 2008; Bilban et al. 2008). Constitutive enzyme HO-2 is the most abundant isoform in the brain accounting for almost all CO production (Parfenova & Leffler 2008). High expression of HO-2 in CNS includes neurons and glia cells of dentate gyrus, hippocampus, cerebellum, olfactory bulb and caudal brainstem (Ryter Jawed Choi, Augustine M. K. 2006; Mahan 2012). Endogenous CO has several cerebral physiological functions (for review Mahan 2012; Hanafy et al. 2013).
Exogenous low concentrations of CO present beneficial effects in CNS: (i) reduction in inflammation, (ii) vasodilation, and (iii) inhibition of apoptosis are protective attributes with potential clinical prospects (Motterlini & Otterbein 2010). Namely, (i) in rat model of hemorrhagic stroke CO mediates anti-inflammatory response (Yabluchanskiy et al. 2012); (ii) CO delivery stimulates vasodilator and cytoprotective effects in endothelial cells of the cerebral vascular system (Parfenova et al. 2006; Zimmermann et al. 2007) and (iii) exogenous administration of CO inhibits ischemia-reperfusion injury (IRI)-induced apoptosis of retinal ganglion cells and in vitro of neuronal SH-SY5Y cells via activation of soluble guanylate-cyclase (Schallner et al. 2013). CO provides cytoprotective preconditioning and increases resistance against apoptosis in neuron and astrocytic primary cell cultures (Vieira et al. 2008; Queiroga et al. 2010). CO limits perinatal cerebral ischemia lesion and reduces neuronal apoptosis by increasing expression of anti-apoptotic Bcl-2, preventing cytochrome c release and inhibiting caspase-3 activation (Queiroga et al. 2012).
9
ATP and ROS generation increase, ultimately influencing cellular behaviour, which confers cytoprotection against apoptosis (Almeida et al. 2012).
4.2 Therapeutic strategies with CO
The abundance of evidences showing the beneficial effects of CO towards clinics led to the exploitation of different approaches in administration of exogenous CO. Delivery of gaseous and soluble CO compositions through inhalation, injection or ingestion addressing the treatment, transplantation, surgery and/or diagnosis of several diseases (Bauer & Pannen 2009; Motterlini & Otterbein 2010). Drugs like methylene dichloride, organic aldehydes, esters or CO-releasing molecules (CORMs) are used in tissues for CO release. These pro-drugs can have the advantage of tissue selective targeting (Alberto & Motterlini 2007; Motterlini 2007).
Currently, research attempts to test the efficacy of the use of CORMs in several disease models (Zimmermann et al. 2007; Yabluchanskiy et al. 2012). There are a high variety of these compounds with distinct chemistry, feasible to synthetize with aim to surpass limitations of storage, dosage and specific targeting. CO covalently bounds to these organic and organometallic compounds, capable of delivering controlled amounts of CO to tissues and organs in a time and tissue specific manner, responding to a physiological situation (Bannenberg & Vieira 2009; Motterlini & Otterbein 2010).
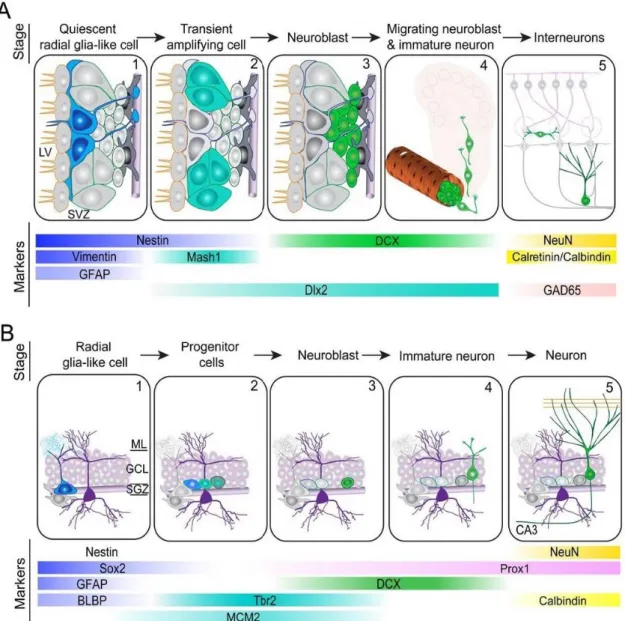
4.3 CORM-A1 characteristics and advantages
CORM-A1 ([H3BCO2]Na2) is a stable water-soluble CORM compound capable of overcoming solubility
limitations (Foresti et al. 2004; Motterlini 2007). CORM-A1 is a boronate compound containing a carboxylic acid (figure 4.2) (Motterlini et al. 2005).
Figure 4.2 – Chemical structure of the molecule CORM-A1 ([H3BCO2]Na2). CORM-A1 is a boronate compound, soluble and stable in water, with a half-life time of approximately 21 minutes (t1/2 = ~ 21min) for transfer CO to myoglobin at a physiological pH (pH=7.4). Adapted from(Motterlini & Otterbein 2010).
presents cerebroprotective effects against seizure-induced vascular injury episodes in newborn piglets (Zimmermann et al. 2007).
A pharmaceutically acceptance of CORM complexes requires a low toxicity preserving an effective action, biocompatibility and stability in blood. CORM-based therapies seem promising since synthetized molecules present enhanced properties for safe CO delivery and represent a strategy more acceptable in the patient perspective than CO gas (Bannenberg & Vieira 2009; Motterlini & Otterbein 2010).
5.
In vitro
models for studying neuronal differentiation
In vitro models to identify the molecular mechanisms involved in neurogenesis and neuronal differentiation, under physiological and pathological conditions, are essential to assess and design cell therapy strategies.
5.1 SH-SY5Y human neuroblastoma cell line
11 5.2 NT2 human teratocarcinoma cell line
NTERA-2 clone D1 (NT2/D1 or NT2) cell line is a subline of NTERA-2 cells, establish from TERA-2 parental cell line. The TERA-2 parental cell line was originally isolated from lung metastasis of a patient with testicular embryonal carcinoma. The pluripotent NT2 cell line is capable of differentiate into functional, postmitotic neurons in response to RA. During neuronal differentiation NT2 cells acquire typical neuronal markers such as βIII-tubulin, MAP2 and Tau. The absence or low expression of Nestin (neuronal precursors) and GFAP (glial cells) markers reinforces the notion of pure neuronal culture after neuronal enrichment (Podrygajlo et al. 2009; Tegenge et al. 2011). NT2 display a variety of neurotransmitter phenotypes, including cholinergic, GABAergic and glutamatergic phenotypes (Podrygajlo et al. 2009; Coyle et al. 2011). In some groups has been reported that NT2 cells can differentiate into other cell types, as astrocytes and radial glial cells, but in small number compared to the neuronal population (Coyle et al. 2011). NT2 cells already have been used for transplantation to assess their endogenous neuroprotective mechanisms against ischemic stroke in experimental animals and human patients (Nelson et al. 2002; Hara et al. 2007). NT2 cell line is, in addition, a useful model to characterize the cellular process occurring during neuronal differentiation (Gompel et al. 2004; Pistritto et al. 2012).
5.3 Advantages of continuous cell line-based models
6. Aim
The main purpose of this thesis is to study the potential role of CO as a promoter of neuronal differentiation and to clarify the cellular mechanisms involved in this process.
Neurodegenerative and ischemic diseases are major cause of disability and death in industrialized society. Thus, novel strategies to stimulate and improve neuronal differentiation can be promising potential therapies for these diseases. One potential strategy developed herein is the use of CO for improving neuronal differentiation, in particular CORM-A1. CORMs are recently developed sources of CO that bring the advantage of efficiency and safety with the same benefits of CO molecule itself. Furthermore, the assessment of CO function along the process of neuronal differentiation is essential to understand the changes occurring on the cellular level and target the cellular pathways involved. The findings of this project can represent a potential support in future studies in the area of neuronal differentiation and in the improvement of strategies of neuronal cell therapy in regenerative medicine. Mitochondrial biogenesis occurs during differentiation as consequence of the metabolic shifts and CO was already stated to stimulate mitochondrial biogenesis (Almeida et al. 2012; Baxter et al. 2012). Furthermore, ROS generation and signaling can be induced by CO and ROS are also signaling factors of downstream targets in pathways involved in neuronal differentiation (Vieira et al. 2008; Konopka et al. 2008). As a final point, CO regulates proliferation and is anti-apoptotic (Vieira et al. 2008; Motterlini & Otterbein 2010), while tight modulation between proliferation, differentiation and cell death is crucial during neuronal differentiation process of NSCs. The aspects covered earlier suggest our hypothesis that, CO can modulate neuronal differentiation potentially by: (i) inhibition of proliferation, (ii) increase of mitochondrial biogenesis for a more oxidative metabolism and higher energy production and/or (iii) stimulation of ROS generation and signaling.
15
7. Cell culture medium, material and solutions
7.1 Materials/Reagents
The following described materials used in cell culture were acquired from Gibco - Life Technologies
unless stated otherwise: Dulbecco’s Modified Eagle´s Medium containing 4,5 g/L D-glucose (high glucose) (DMEM-HG); Dulbecco’s Modified Eagle´s Medium/Nutrient Mixture F-12 (DMEM/F-12) in a
1:1 mixture of DMEM:Ham’s F-12; Fetal Bovine serum (FBS) following heat-inactivation (56ºC, 30 minutes); Penicillin and Streptomycin (Pen/Strep) containing 10,000 units/mL penicillin and 10,000 µg/mL streptomycin; Trypsin-EDTA (trypsin) containing 0,05%(v/v) Trypsin-EDTA(1X); Dimethyl sulfoxide (DMSO) (Santa Cruz Biotechnology). For more detailed information please see table 7.1 below. All plastic and glass material was provided by Corning Life Sciences and was sterile or was previously sterilized in an autoclave at 120ºC during 20 minutes.
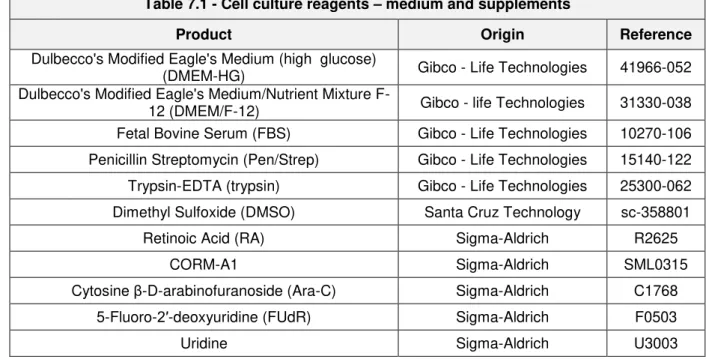
7.2 Preparation of solutions
All-trans RA was prepared and stored in filtered aliquots of 10 mM concentration in DMSO at -80ºC. Filtered solutions of 5 mM CORM-A1 were prepared by dissolving the compound in pure distilled water and stored at -20ºC. CO-depleted inactive form of CORM-A1 (iCORM-A1), used as a negative control, was dissolved in 0,1 M HCl following bubbling pure N2 through the solution during 10 minutes
in order to remove all CO gas, finally pH was adjusted to 7,4 as previously described (Motterlini et al. 2005). Cytosine β-D-arabinofuranoside (Ara-C), 5-Fluoro-2′-deoxyuridine (FUdR), and Uridine compounds were prepared in cell culture grade water for 1 mM filtered solution and stored at -20ºC and 4ºC. All solutions were sterilized in autoclave at 120ºC during 20 minutes or filtered in laminar hood using a pore size filter of 0,22 µM. Detailed information described in below table 7.1.
Table 7.1 - Cell culture reagents – medium and supplements
Product Origin Reference
Dulbecco's Modified Eagle's Medium (high glucose)
(DMEM-HG) Gibco - Life Technologies 41966-052 Dulbecco's Modified Eagle's Medium/Nutrient Mixture
F-12 (DMEM/F-F-12) Gibco - life Technologies 31330-038 Fetal Bovine Serum (FBS) Gibco - Life Technologies 10270-106 Penicillin Streptomycin (Pen/Strep) Gibco - Life Technologies 15140-122 Trypsin-EDTA (trypsin) Gibco - Life Technologies 25300-062 Dimethyl Sulfoxide (DMSO) Santa Cruz Technology sc-358801
Retinoic Acid (RA) Sigma-Aldrich R2625
CORM-A1 Sigma-Aldrich SML0315
Cytosine β-D-arabinofuranoside (Ara-C) Sigma-Aldrich C1768 5-Fluoro-2′-deoxyuridine (FUdR) Sigma-Aldrich F0503
8. SH-SY5Y neuroblastoma cell line
8.1 Cell line
The human neuroblastoma cell line SH-SY5Y is from ATCC® CRL-2266™. Cells were cryopreserved at -80ºC in 95%(v/v) FBS and 5%(v/v) DMSO, with passage 14 and stock cell density of 1 - 6x10⁶ cells per vial.
8.2 Cell culture maintenance
The SH-SY5Y line was cultured in DMEM/F-12 supplemented with 10%(v/v) FBS and 2%(v/v) Pen/Strep (growth medium). Cells were maintained in a humidified atmosphere of 5%(v/v) CO2 at
37ºC. Stock cells were grown in 75 cm2 T-flasks and subcultured once a week in 1:4 cell passage with fresh growth medium whenever cell confluency achieved ~80-90%. Growth medium was changed twice a weak.
8.3 Cell passage for neuronal differentiation
Cells were detached by trypsinization at room temperature (RT) and slight shaking and hitting to drain down cells. Resuspended cells with growth medium were plated on 75 cm2 T-flasks in a 1:2 cell passage. A remaining amount of cellular suspension was collected for cell counting with trypan blue and crystal violet solutions.
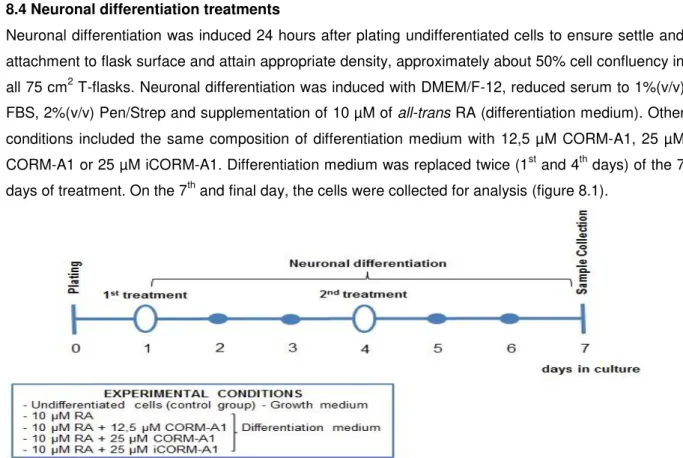
8.4 Neuronal differentiation treatments
Neuronal differentiation was induced 24 hours after plating undifferentiated cells to ensure settle and attachment to flask surface and attain appropriate density, approximately about 50% cell confluency in all 75 cm2 T-flasks. Neuronal differentiation was induced with DMEM/F-12, reduced serum to 1%(v/v) FBS, 2%(v/v) Pen/Strep and supplementation of 10 µM of all-trans RA (differentiation medium). Other conditions included the same composition of differentiation medium with 12,5 µM CORM-A1, 25 µM CORM-A1 or 25 µM iCORM-A1. Differentiation medium was replaced twice (1st and 4th days) of the 7 days of treatment. On the 7th and final day, the cells were collected for analysis (figure 8.1).
17
9. NT2 human teratocarcinoma cell line
9.1 Cell line
NT2 human teratocarcinoma cell line, NTERA-2 cl.D1 [NT2/D1] is from ATCC® CRL-1973™. Cells were cryopreserved at -80ºC in 95%(v/v) FBS and 5%(v/v) DMSO, with passage 31 and stock cell density of 5 - 10x106 cells per vial.
9.2 Cell culture maintenance
NT2 cell line was grown in DMEM-HG supplemented with 10%(v/v) FBS and 1%(v/v) Pen/Strep (growth medium). Cells were maintained in a humidified atmosphere of 5%(v/v) CO2 at 37ºC. Stock
cells per vial were grown in 75 cm2 T-flasks and subcultured with fresh growth medium whenever high cell confluency was achieved (~90-100% cell confluency) in a 1:4 cell passage. Growth medium was changed every 2 to 3 days.
9.3 Cell passage for neuronal differentiation
Cells were rinsed with phosphate-buffered saline (PBS) and then incubated with trypsin for 2 minutes at 37ºC for trypsinization and resuspended in growth medium. Finally, cells were counted in trypan blue and split 2,3x10⁶ cells per 75 cm2 T-flask.
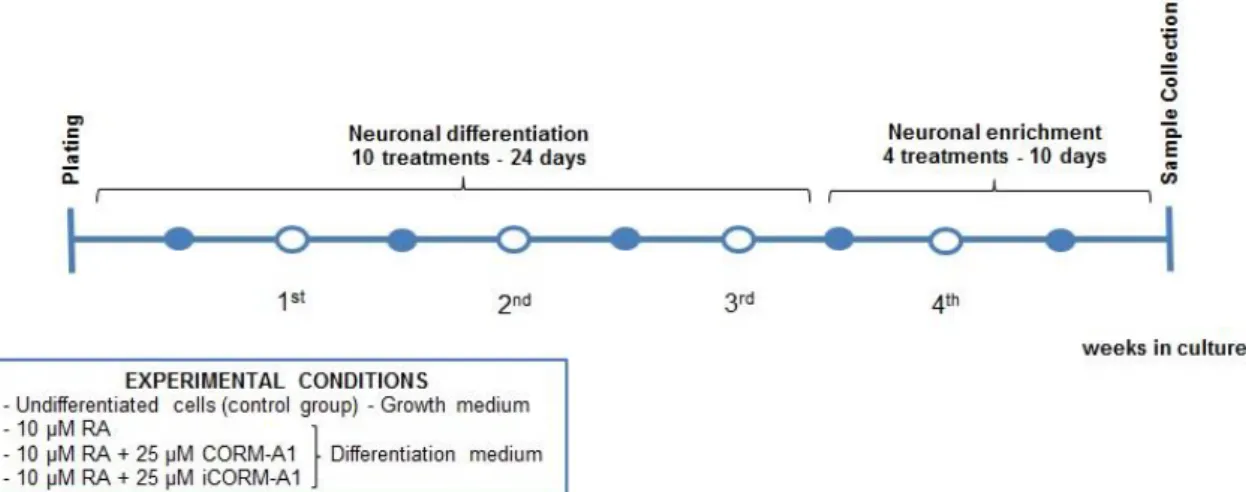
9.4 Neuronal differentiation treatments
Neuronal differentiation was induced 24 hours after plating undifferentiated cells to ensure settle and attachment to flask surface and attain appropriate density. The NT2 cell line neuronal differentiation was induced in DMEM-HG with 10%(v/v) FBS and 1%(v/v) Pen/Strep, supplemented with 10 µM all-trans RA (differentiation medium). Other conditions included the same composition of differentiation medium supplemented with 25 µM CORM-A1 or 25 µM iCORM-A1. Differentiation medium was replaced three times a week, in alternated days, until reach 10 differentiation treatments (24 days).
9.5 Replate to neuronal enrichment
After 10th differentiation treatment, a cell replate at lower density was performed to disperse the dense multilayer cell culture and start neuronal enrichment for obtaining neurons. The cells were detached by trypsinization, as earlier mentioned, following a sturdy hit to remove more lose cells, presumably neurons attached to the dense monolayer of flat cells. Cells from each 75 cm2 T-flask culture were transfer into two 175 cm2 T-flasks in a 1:2 cell passage.
9.6 Neuronal enrichment
Figure 9.1 – NT2 cells culture for neuronal differentiation. Representative scheme of the pratical component concerning the culture of NT2 cell line to study neuronal differentiation.
10. Techniques of analysis
10.1 Opticalmicroscopy
The change in cell morphology during neural differentiation was evaluated in light microscope Zeiss Axiovert 40 CFL. Zeiss microscope software ZEN was used for image acquisition. ImageJ software was used for image processing and analysis.
10.2 Cell count
Cell number (SH-SY5Y and NT2 cell lines) was calculated by counting cells in a hemocytometer under 100X magnification in light microscope Zeiss Axiovert 40 CFL. Cell concentration per mL was calculated by the expression:
𝜒̅ × dilution factor × 1 × 104 = cells/mL
𝜒̅ − average number of cells counted in the 4 squares of hemocytometer. 1 × 10⁴− hemocytometer factor.
Cell viability was assessed by counting cells from an aliquot of cell suspension stained with trypan blue. The non-colored cells were regarded as live cells. Because cells can aggregate, cell nuclei were counted based on crystal violet procedure and represented the total cell amount. After treatment, cells were trypsinized and resuspended in growth medium following centrifugation (500 g, 5 minutes). The pellet resuspended in PBS following again centrifugation (500 g, 5 minutes). Then, cells were resuspended in 0,1 M Citric Acid solution prepared in H2O mili-Q for membrane disruption and stained
in crystal violet solution.
10.3 Western blot
19
total cell extract was determined by BCA assay (BCA kit - Pierce, Illinois; Microplate reader TECAN). Bovine serum albumin (BSA) solution in 0,0625 / 0,125 / 0,25 / 0,5 / 1 and 2 mg/mL concentrations was used to establish the standard curve for protein quantification. Equal amount of protein (10-40 µg/well) from each sample prepared in loading buffer (2,5X) was loaded onto a 10%(v/v) sodium dodecyl sulfate–polyacrylamide (PAGE) gel (table 10.1). Samples were separated by SDS-PAGE electrophoresis (135-150 V, 1 hour) and transferred to nitrocellulose membranes (500 mA, 1 hour and 15 minutes). All buffer solutions are described in table 10.2.
Rouge Ponceau was used as internal control to verify total protein loading, run and transfer efficiency. Membranes were blocked by 5%(v/v) milk in T-TBS (1X) (2 hours at RT in agitation) to avoid nonspecific binding of antibodies. Membranes were probed with monoclonal mouse antibodies:
anti-βIII-tubulin, anti-NeuN and anti-actin (overnight at 4ºC in agitation). Membranes were detected with horseradish peroxidase-conjugated IgG mouse secondary antibody (2 hours at RT in agitation). The conditions in which the antibodies were used are described in table 10.3. Washes were performed using T-TBS(1X) solution. Blots were developed using enhanced chemiluminescence (ECL) kit (GE Healthcare – Life Sciences). Bands were visualized on Amersham hyperfilm ECL (GE Healthcare – Life Sciences) and Chemidoc XRS+ System apparatus (Bio-Rad). ImageJ software was used for image processing and quantification of bands intensity.
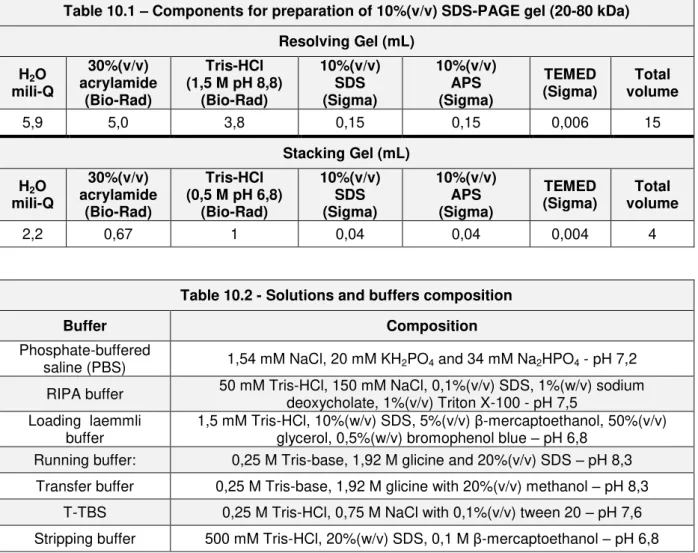
Table 10.1 – Components for preparation of 10%(v/v) SDS-PAGE gel (20-80 kDa)
Resolving Gel (mL)
H2O mili-Q 30%(v/v) acrylamide (Bio-Rad) Tris-HCl (1,5 M pH 8,8)
(Bio-Rad) 10%(v/v) SDS (Sigma) 10%(v/v) APS (Sigma) TEMED (Sigma) Total volume
5,9 5,0 3,8 0,15 0,15 0,006 15
Stacking Gel (mL)
H2O mili-Q 30%(v/v) acrylamide (Bio-Rad) Tris-HCl (0,5 M pH 6,8)
(Bio-Rad) 10%(v/v) SDS (Sigma) 10%(v/v) APS (Sigma) TEMED (Sigma) Total volume
2,2 0,67 1 0,04 0,04 0,004 4
Table 10.2 - Solutions and buffers composition
Buffer Composition
Phosphate-buffered
saline (PBS) 1,54 mM NaCl, 20 mM KH2PO4 and 34 mM Na2HPO4 - pH 7,2
RIPA buffer 50 mM Tris-HCl, 150 mM NaCl, 0,1%(v/v) SDS, 1%(w/v) sodium deoxycholate, 1%(v/v) Triton X-100 - pH 7,5
Loading laemmli buffer
1,5 mM Tris-HCl, 10%(w/v) SDS, 5%(v/v) β-mercaptoethanol, 50%(v/v) glycerol, 0,5%(w/v) bromophenol blue – pH 6,8
Running buffer: 0,25 M Tris-base, 1,92 M glicine and 20%(v/v) SDS – pH 8,3 Transfer buffer 0,25 M Tris-base, 1,92 M glicine with 20%(v/v) methanol – pH 8,3
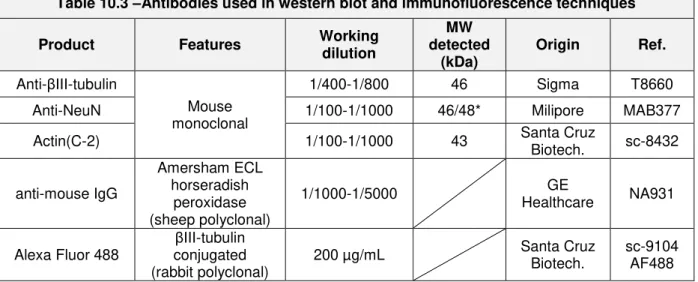
* The antibody recognizes 2-3 bands in the 46-48 kDa range and possibly another band approximately at 66 kDa.
10.4 Flow cytometry
Mitochondrial population of SH-SY5Y cells was analysed through flow cytometry. SH-SY5Y cells were plated at a density of 0,2-0,3x10⁶ cells/well in 24-well plates coated with Poly-D-lysine in 0,15 M sodium borate buffer solution pH 8,4. After differentiation treatments cells were harvested and incubated with 10 nM dye MitoTracker Deep Red (MTDR) (15 minutes at 37ºC). The dye was diluted in PBS(1X) and handle in the dark. Data acquisition was obtained in FACSCalibur and Cell Quest Software (BD Biosciences, San Jose, CA, USA). Flow cytometry data was analysed by FlowJo software version 10.1 with the most help of Claudia Pereira (Cell and Death Disease Lab., CEDOC/FCM).
10.5 Immunofluorescence microscopy
NT2 cells were plated at a density of 1-2x10⁶ cells/well in 6-well plates coated with Poly-D-lysine in 0,15 M sodium borate buffer solution pH 8,4 and matrigel in DMEM-HG with 1%(v/v) Pen/Strep. Cells were fixed with 4%(v/v) PFA and 4%(w/v) sucrose solution (20 minutes at RT). Cells were then permeabilized with 0,3%(v/v) Triton X-100 solution(15 minutes at RT). Later, cells were incubated with primary antibody anti-βIII-tubulin (2 hours at RT) following secondary antibody incubation Alexa Fluor 488 (1 hour at RT) (table 10.3). Both antibodies were dilute in 1%(w/v) BSA and 0,1%(v/v) Triton X-100 solution. Samples were mounted in Prolong mounting media (with DAPI - Invitrogen) and images were captured with Zeiss Axiovert 40 CFL microscope. All solutions were prepared in PBS(1X). Washes with PBS(1X) solution were performed between each step.
10.6 Statistical analysis
All values are expressed by mean±standart deviation (S.D.). The results are from three independent experiments unless stated otherwise. For statistical comparisons data were analysed by one–way analysis of variance (ANOVA). Differences between groups were regarded as significant when possessing a p-value less than 0,05 corresponding to a confidence level of 95%.
Table 10.3 –Antibodies used in western blot and immunofluorescence techniques
Product Features Working
dilution
MW detected
(kDa)
Origin Ref.
Anti-βIII-tubulin
Mouse monoclonal
1/400-1/800 46 Sigma T8660 Anti-NeuN 1/100-1/1000 46/48* Milipore MAB377
Actin(C-2) 1/100-1/1000 43 Santa Cruz
Biotech. sc-8432
anti-mouse IgG
Amersham ECL horseradish
peroxidase (sheep polyclonal)
1/1000-1/5000 GE
Healthcare NA931
Alexa Fluor 488
βIII-tubulin conjugated (rabbit polyclonal)
200 µg/mL Santa Cruz Biotech.
23
11. Validation of neuronal differentiation protocol in SH-SY5Y cell line
11.1 Design and establishment of a neuronal differentiation protocol
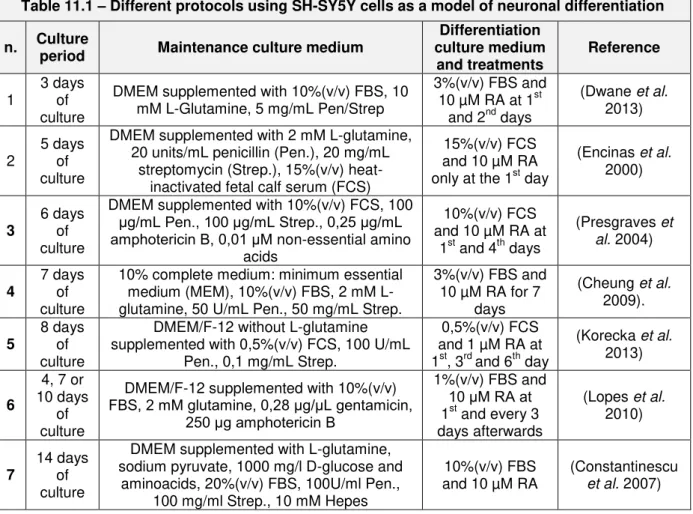
SH-SY5Y neuroblastoma cell line was for the first time used in our research group as model to study neuronal differentiation. Different differentiation protocols were studied in the literature to assess what were the common points between them and select the essential steps to establish a new protocol taking into account SH-SY5Y cell line characteristics and the objectives of the present work. The table 11.1 describes the different protocols found in the literature for neuronal differentiation of SH-SY5Y cell line.
The period of culture was very diverse between protocols. After 7 days of differentiation, neuronal characteristics of SH-SY5Y cells were more consensual rather than shorter periods of culture. Even more, 7 days of culture is adequate considering other protocols/models with much longer periods of differentiation and the limited practical time of this Master thesis traineeship. Culture medium composition broadly comprised DMEM supplemented with nutrient compounds mostly amino acids and growth factors, with the addition of antibiotic solutions to improve cell viability and growth. Thereby DMEM/F-12 supplemented with 10%(v/v) FBS and 2%(v/v) Pen/Strep was chosen as the culture growth medium for cellular maintenance. RA exposure and serum amount reduction in the medium are central steps for neuronal differentiation that could not be overlooked. A concentration of 10 µM
Table 11.1 – Different protocols using SH-SY5Y cells as a model of neuronal differentiation
n. Culture
period Maintenance culture medium
Differentiation culture medium and treatments Reference 1 3 days of culture
DMEM supplemented with 10%(v/v) FBS, 10 mM L-Glutamine, 5 mg/mL Pen/Strep
3%(v/v) FBS and 10 µM RA at 1st
and 2nd days
(Dwane et al. 2013)
2
5 days of culture
DMEM supplemented with 2 mML-glutamine, 20 units/mL penicillin (Pen.), 20 mg/mL
streptomycin (Strep.), 15%(v/v) heat-inactivated fetal calf serum (FCS)
15%(v/v) FCS and 10 µM RA only at the 1st day
(Encinas et al.
2000)
3
6 days of culture
DMEM supplemented with 10%(v/v) FCS, 100
μg/mL Pen., 100 μg/mL Strep., 0,25 μg/mL amphotericin B, 0,01 μM non-essential amino
acids
10%(v/v) FCS and 10 µM RA at
1st and 4th days
(Presgraves et al. 2004)
4
7 days of culture
10% complete medium: minimum essential medium (MEM), 10%(v/v) FBS, 2 mM L-glutamine, 50 U/mL Pen., 50 mg/mL Strep.
3%(v/v) FBS and 10 µM RA for 7
days
(Cheung et al.
2009).
5
8 days of culture
DMEM/F-12 without L-glutamine supplemented with 0,5%(v/v) FCS, 100 U/mL
Pen., 0,1 mg/mL Strep.
0,5%(v/v) FCS and 1 µM RA at 1st, 3rd and 6th day
(Korecka et al.
2013)
6
4, 7 or 10 days
of culture
DMEM/F-12 supplemented with 10%(v/v)
FBS, 2 mM glutamine, 0,28 μg/μL gentamicin, 250 μg amphotericin B
1%(v/v) FBS and
10 μM RA at
1st and every 3 days afterwards
(Lopes et al.
2010)
7
14 days of culture
DMEM supplemented with L-glutamine, sodium pyruvate, 1000 mg/l D-glucose and
aminoacids, 20%(v/v) FBS, 100U/ml Pen., 100 mg/ml Strep., 10 mM Hepes
10%(v/v) FBS and 10 µM RA
(Constantinescu
RA and a reduction of serum from 10%(v/v) to 1%(v/v) FBS were performed to induce neuronal differentiation in SH-SY5Y cell line. Most protocols perform more than one treatment per period of differentiation. Thus, 2 differentiation treatments were chosen within the 7 days of culture: 1st and 4th days of culture to exchange the differentiation medium and by that, replenish the compounds combination of the medium needed for neuronal differentiation.
Thus the protocol to be used, stated in section 8 materials and methods, consists of (table 11.2):
The following results (section 11.2 to 11.5) have the objective of demonstrating that regarding neuronal differentiation, the established protocol is valid and adequate for using SH-SY5Y cell line as a neuronal differentiation model.
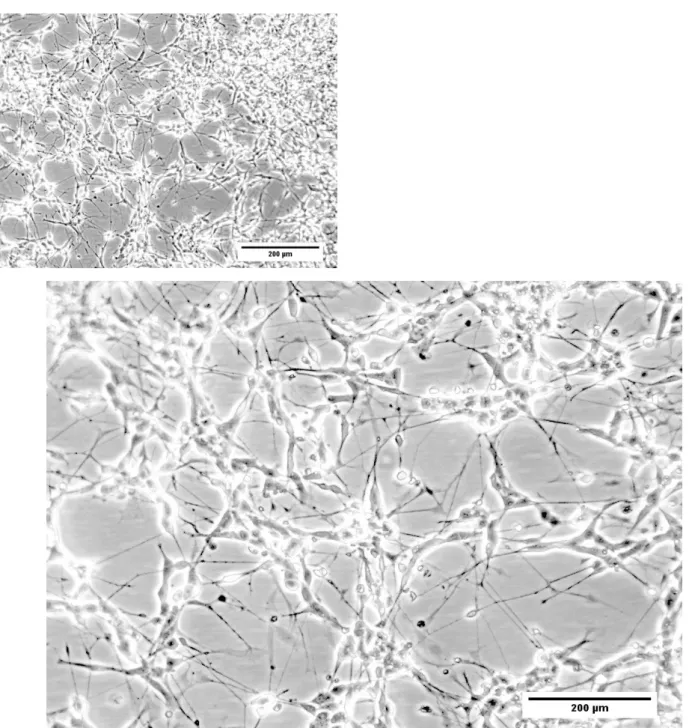
11.2 Neuronal differentiation induces changes in the morphology of SH-SY5Y cells
Cell morphology was the first trade analysed for the neuronal phenotype expected for differentiated SH-SY5Y cells (figures 11.1 and 11.2). From a wide perspective of the process, the major difference observed in the cell population was an increase in the number of cell structures that extend and connect the cells, designated neurites (figure 11.2). Neurites are structures resembling dendrites and/or axons of a typical neuronal phenotype. Undifferentiated conditions, on the contrary, present reduced number of neurites, usually, characterized by being small branches (figure 11.1). Beside neurite outgrowth, cell body morphology tends to alter between conditions. Undifferentiated conditions show aggregates of rounded cells with small branches. Neuronal differentiation treatment induces a change towards a more elongated cell body with extended neurites and cells spaced from each other (data not shown).
Table 11.2 – Selected protocol using SH-SY5Y cells as a model of neuronal differentiation
Culture period Maintenance culture medium Differentiation culture medium and treatments
7 days of culture DMEM/F-12 supplemented with 10%(v/v) FBS and 2%(v/v) Pen/Strep
25 Figure 11.1 - Morphological analysis of SH-SY5Y cells during neuronal differentiation, day 0. SH-SY5Y cells induced to differentiated by 10 µM RA and 1%(v/v) FBS on plating day (10 µM RA + 1%(v/v) FBS – DAY 0). Phase contrast images obtained in Zeiss microscope (100x and 200x magnification).
Figure 11.2 - Morphological analysis of SH-SY5Y cells during neuronal differentiation, day 7. SH-SY5Y cells induced to differentiated by 10 µM RA and 1%(v/v) FBS at the final stage of the process (10 µM RA + 1%(v/v) FBS – DAY 7). Phase contrast images obtained in Zeiss microscope (100x and 200x magnification).
27 11.3 Neuronal differentiation modulates the final cell population of SH-SY5Y cells
Undifferentiated cells sustain continuous proliferation of SH-SY5Y population, while neuronal differentiation diminishes cellular population by decreasing mitotic cell divisions (figure 11.3). Another valid cause for the decrease on cell population is the possible occurrence of cell death during neuronal differentiation.
Figure 11.3 –Cell number analysis based on nuclei count with crystal violet. Treatment conditions include SH-SY5Y undifferentiated cells on plating day (Undif.Cells 10%(v/v) FBS - DAY 0), SH-SY5Y undifferentiated cells (Undif.Cells 10%(v/v) FBS - DAY 7) and SH-SY5Y differentiated cells induced by 10 µM RA and 1%(v/v) FBS (10 µM RA + 1%(v/v) FBS – DAY 7) at final stage of the process. The graphic is representative of cell number obtained before plating for treatment and after 7 days of differentiation and presented as relative percentage to undifferentiated cells (100%) (Undif.Cells 10%(v/v) FBS - DAY 0). All values are mean±SD, n=3 with no significant difference between data (one-way analysis of variance).
11.4 Neuronal differentiation induces changes in protein expression of SH-SY5Y cells
To study the protein expression in SH-SY5Y cell line differentiation, western blot analysis was performed. Firstly the total amount of protein was assessed and Rouge Ponceau dye, showed that all wells presented the same relative amount of protein. It was followed by immunodetection of specific proteins for neurons and Actin protein as internal control (figure 11.4). Protein amount in each lane was quantified as the ratio between the protein of interest (βIII-tubulin or NeuN) and the internal control (Actin) (figures 11.5 and 11.6). This normalization to a protein of basal expression enables the comparison between protein expression levels of the different sample groups. The neuronal phenotype of differentiated SH-SY5Y cells is demonstrated by higher levels of expression for the typical neuronal marker βIII-tubulin (figure 11.5). This is in accordance to the literature, that once cells start to differentiate, there is an increase on the expression of specific neuronal markers (Encinas et al. 2000; Lopes et al. 2010). The expression of neuronal marker NeuN in SH-SY5Y cell line indicates that there might be increased NeuN protein expression during neuronal differentiation (figure 11.6). Nevertheless, more replicates must be performed to confirm the higher levels of NeuN expression in differentiated SH-SY5Y cells opposed to undifferentiated cells.
0 100 200 300 400
Undif.cells 10%(v/v) FBS Undif.cells 10%(v/v) FBS 10 µM RA + 1%(v/v) FBS
DAY 0 DAY 7
1 2
Rouge Ponceau
46-48 kDa NeuN
46 kDa βIII-tubulin
43 kDa Actin
Figure 11.4 – Protein analysis of the 7th day of neuronal differentiation. Treatment conditions include SH-SY5Y undifferentiated cells (Undif.cells 10%(v/v) FBS – DAY 7), SH-SY5Y differentiated cells induced by 10 µM RA and 1%(v/v) FBS (10 µM RA + 1%(v/v) FBS – DAY 7) at final stage of the process (table 11.3). Run on a 10%(v/v) acrylamide gel (20-80 kDa). Staining with NeuN(1:1000), βIII-tubulin (1:800) and Actin (1:1000) and Chemiluminescence (ECL) for band detection in film and ChemidocXRS+ system.
Table 11.3 – Western blot bands identification
no.1 no.2
DAY 7
29 Figure 11.5 – Quantification of βIII-tubulin expression in SH-SY5Y cells. Treatment conditions include SH-SY5Y undifferentiated cells (Undif.cells10%(v/v) FBS – DAY 7), SH-SY5Y differentiated cells induced by 10 µM RA and 1%(v/v) FBS (10 µM RA + 1%(v/v) FBS – DAY 7) at final stage of the process. Bands quantification was assessed in ImageJ software by relative quantification of βIII-tubulin bands normalized by actin bands. Values presented as relative percentage to undifferentiated cells (100%) (Undif.cells 10%(v/v) FBS – Day 7). All values are mean±SD, n=2 with *p<0,05 compared with Undif.cells 10%(v/v) FBS – DAY 7 (one-way analysis of variance).
Figure 11.6 – Quantification of NeuN expression in SH-SY5Y cells. Treatment conditions include SH-SY5Y undifferentiated cells (Undif.cells10%(v/v) FBS – DAY 7), SH-SY5Y differentiated cells induced by 10 µM RA and 1%(v/v) FBS (10 µM RA + 1%(v/v) FBS – DAY 7) at final stage of the process. Bands quantification was assessed in ImageJ software by relative quantification of NeuN bands normalizated by actin bands. Values presented as relative percentage to undifferentiated cells (100%) (Undif.cells 10%(v/v) FBS – Day 7). Data from a single representative experiment (n=1).
*
0 100 200 300
Undif.Cells 10%(v/v) FBS 10 µM RA + 1%(v/v) FBS
DAY 7 Rel a tiv e pe rce nta ge to c on trol (% ) βII I -tub ul in e x pre s s io n 0 100 200 300
Undif.cells 10%(v/v) FBS 10µM RA + 1%(v/v) FBS
11.5 Neuronal differentiation modulates the mitochondrial population of SH-SY5Y cells
Neuronal differentiation is a highly energetic process and metabolic adaptations are necessary to support the cellular changes. Quantification of mitochondrial population was done by using MitoTracker Deep Red (MTDR) dye and assessing FL4-H plot in flow cytometry as exemplified in the histogram (figure 11.7). The gates outlined comprised the negative FL4-H-, positive FL4-H+ and control group (undifferentiated cells) FL4-H control gates. The high intensity fluorescence signal of the MTDR (emission 662-665 nm) at FL4-H+ region shows positive staining of mitochondria in live cells. Neuronal differentiation seems to increase mitochondrial population of SH-SY5Y cells. Indeed, the shift towards a higher intensity signal in the layout profile of differentiated cells in relation to undifferentiated cells in the histogram is indicative of mitochondrial population increase (figure 11.7). During neuronal differentiation process, differentiated SH-SY5Y cells present higher levels of mitochondrial population than undifferentiated cells, which were calculated using the median values of fluorescence intensity corresponding to each cellular population in the different culture conditions (figure 11.8).
31 Figure 11.8 – Quantification of mitochondrial population in SH-SY5Y cells by flow cytometry analysis. Treatment conditions include SH-SY5Y undifferentiated cells (Undif.cells 10%(v/v) FBS), SH-SY5Y differentiated cells induced by 10 µM RA and 1%(v/v) FBS (10 µM RA + 1%(v/v) FBS) at the 4th and 7th days of the process (DAY 4 and DAY 7). Population mitochondrial mass was assessed using MTDR (10 nM) and fluorescence intensity was quantified using relative median values expressed in arbitrary units (a.u). All values are mean±SD, n=2 with *p<0,05 compared with undif.cells 10%(v/v) FBS – DAY 4 and #p<0,05 compared with Undif.cells 10%(v/v) FBS – DAY 7 (one-way analysis of variance).
12. Enhancement of neuronal differentiation process via CORM-A1 treatment
in SH-SY5Y cell line
The following results (section 12.1 to 12.4) purpose to corroborate previous evidences in our laboratory about the CO regulatory action in the neuronal differentiation process, in particular, via
CORM-A1 treatment, as CO source. The study of CORM-A1 role aims at understanding whether CO improves neuronal differentiation and which are the involved pathways, keeping in mind that CORM-A1 treatment can be a possible novel strategy to stimulate and improve neuronal differentiation.
12.1 CORM-A1 treatment does not alter morphology of SH-SY5Y cells during neuronal
differentiation
Neuronal differentiation treatment induces a change in morphology in SH-SY5Y cell population towards a neuronal phenotype, as shown before (figure 12.1). Neuronal differentiation treatment with supplementation of 25 µM CORM-A1 replicates the same phenotype of standard differentiated SH-SY5Y cells, presenting elongated cell body and neurite outgrowth (figure 12.2). The condition does not present any distinct differences from the differentiated SH-SY5Y cells in the absence of CORM-A1.
*
#
0 500 1000 1500 2000 2500 3000 Undif.cells 10%(v/v) FBS10 µM RA + 1%(v/v) FBS
Undif.cells 10%(v/v) FBS
10 µM RA + 1%(v/v) FBS
DAY 4 DAY 7
Figure 12.1 - Morphological analysis of SH-SY5Y cells during neuronal differentiation, day 7. SH-SY5Y cells induced to differentiated by 10 µM RA and 1%(v/v) FBS at the final stage of the process (10 µM RA + 1%(v/v) FBS – DAY 7). Phase contrast images obtained in Zeiss microscope (100x and 200x magnification).
33 Figure 12.2 - Morphological analysis of SH-SY5Y cells treated with CORM-A1 during neuronal differentiation, day 7. SH-SY5Y cells induced to differentiated by 10 µM RA and 1%(v/v) FBS and 25 µM CORM-A1 at the final stage of the process (10 µM RA + 1%(v/v) FBS + 25 µM CORM-A1 – DAY 7). Phase contrast images obtained in Zeiss microscope (100x and 200x magnification).
12.2 CORM-A1 effect in the final cell population of SH-SY5Y cells during neuronal
differentiation
Undifferentiated cells sustain continuous proliferation of SH-SY5Y population while neuronal differentiation diminishes final cellular population. The final population of differentiated SH-SY5Y cells subjected to CORM-A1 treatment presents a slight increase in cell number compared with neuronal differentiation process in the absence of CORM-A1 (figure 12.3). This result suggest a tendency to increase the final neuronal population with supplementation of 25 µM CORM-A1 in culture, nevertheless, this tendency requires to be confirmed with future work.
Figure 12.3 –Cell number analysis based on nuclei count with crystal violet. Treatment conditions include SH-SY5Y undifferentiated cells on plating day (Undif.Cells 10%(v/v) FBS - DAY 0), SH-SY5Y undifferentiated cells (Undif.Cells 10%(v/v) FBS - DAY 7) and SH-SY5Y differentiated cells induced by 10 µM RA and 1%(v/v) FBS (10 µM RA + 1%(v/v) FBS – DAY 7) and 25 µM CORM-A1 (10 µM RA + 1%(v/v) FBS + 25 µM CORM-A1 – DAY 7) at final stage of the process. The graphic is representative of cell number obtained before plating for treatment and after 7 days of differentiation and presented as relative percentage to undifferentiated cells (100%) (Undif.Cells 10%(v/v) FBS - DAY 0). All values are mean±SD, n=3 with no significant difference between data (one-way analysis of variance).
12.3 CORM-A1 effect in protein expression of SH-SY5Y cells during neuronal differentiation
For following neuronal differentiation process, neuronal protein expression was studied by western blot technique. Firstly the total amount of protein was assessed by Rouge Ponceau dye, showing that all wells presented the same amount of protein. It was followed by immunodetection of specific proteins for neurons and Actin protein was used as internal control (figure 12.4). Protein amount in each lane was quantified and normalized by the ratio between the protein of interest (βIII-tubulin or NeuN) and the internal control (Actin) (figures 12.5 and 12.6). Differentiated SH-SY5Y cells seem to present higher levels of βIII-tubulin and NeuN expression when compared to undifferentiated cells (figures 12.5 and 12.6). The effect of CORM-A1 treatment in the expression of these neuronal markers is inconclusive, evidencing significant deviations and lack of replicates. There is a tendency to increase NeuN specific neuronal protein expression in culture with supplementation of 25 µM of
0 100 200 300 400 Undif.cells 10%(v/v) FBS Undif.cells 10%(v/v) FBS
10 µM RA + 1%(v/v) FBS
10 µM RA + 1%(v/v) FBS + 25
µM CORM-A1
DAY 0 DAY 7
![Figure 4.2 – Chemical structure of the molecule CORM-A1 ([H 3 BCO 2 ]Na 2 )](https://thumb-eu.123doks.com/thumbv2/123dok_br/16671700.742743/27.892.320.576.700.852/figure-chemical-structure-molecule-corm-a-bco-na.webp)