Influence of exercise modality on
agreement between gas exchange and
heart rate variability thresholds
F.A. Cunha
1, R.A. Montenegro
2, A.W. Midgley
3, F. Vasconcellos
4, P.P. Soares
5and P. Farinatti
6 1Laborato´rio de Atividade Fı´sica e Promoc¸a˜o da Sau´de, Programa de Po´s-Graduac¸a˜o em Cieˆncias Me´dicas,Faculdade de Cieˆncias Me´dicas, Universidade do Estado do Rio de Janeiro, Rio de Janeiro, RJ, Brasil 2Laborato´rio de Atividade Fı´sica e Promoc¸a˜o da Sau´de, Programa de Po´s-Graduac¸a˜o em Fisiopatologia Clı´nica e Experimental,
Universidade do Estado do Rio de Janeiro, Rio de Janeiro, RJ, Brasil 3
Department of Sport and Physical Activity, Edge Hill University, Ormskirk, Lancashire, England 4
Centro de Investigac¸a˜o, Formac¸a˜o, Inovac¸a˜o, Intervenc¸a˜o e Desporto, Faculdade de Desporto, Universidade do Porto, Porto, Portugal 5
Departamento de Fisiologia e Farmacologia, Universidade Federal Fluminense, Nitero´i, RJ, Brasil 6
Laborato´rio de Atividade Fı´sica e Promoc¸a˜o da Sau´de, Instituto de Educac¸a˜o Fı´sica e Desportos, Universidade do Estado do Rio de Janeiro, Rio de Janeiro, RJ, Brasil
Abstract
The main purpose of this study was to investigate the level of agreement between the gas exchange threshold (GET) and heart rate variability threshold (HRVT) during maximal cardiopulmonary exercise testing (CPET) using three different exercise modalities. A further aim was to establish whether there was a 1:1 relationship between the percentage heart rate reserve (%HRR) and percentage oxygen uptake reserve (%VO: 2R) at intensities corresponding to GET and HRVT. Sixteen apparently
healthy men 17 to 28 years of age performed three maximal CPETs (cycling, walking, and running). Mean heart rate andVO: 2
at GET and HRVT were 16 bpm (P,0.001) and 5.2 mL?kg-1?min-1(P=0.001) higher in running than cycling, but no significant differences were observed between running and walking, or cycling and walking (P.0.05). There was a strong relationship between GET and HRVT, with R2ranging from 0.69 to 0.90. A 1:1 relationship between %HRR and %:
VO2R was not observed
at GET and HRVT. The %HRR was higher during cycling (GET mean difference=7%; HRVT mean difference=11%; both P,0.001), walking (GET mean difference=13%; HRVT mean difference=13%; both P,0.001), or running (GET mean difference=11%; HRVT mean difference=10%; both P,0.001). Therefore, using HRVT to prescribe aerobic exercise intensity appears to be valid. However, to assume a 1:1 relationship between %HRR and %VO: 2R at HRVT would probably
result in overestimation of the energy expenditure during the bout of exercise.
Key words: Aerobic exercise; Autonomic nervous system; Heart rate reserve; Oxygen uptake reserve; Poincare plot; Ramp protocol
Introduction
Appropriate prescription of aerobic exercise intensity is important for the safety and effectiveness of training programs (1). Aerobic exercise intensity can be prescribed using work rate, heart rate, and ratings of perceived exertion, among other methods (2). The gas exchange threshold (GET) is often considered as an effective method to prescribe exercise intensity because it is closely related to the tolerance for prolonged exercise (3-5). Accordingly,
a recent position paper on exercise prescription in cardiac rehabilitation (6) recommended a change from ‘‘range-based’’ to ‘‘threshold-‘‘range-based’’ approaches. This recommen-dation supports the use of the heart rate reserve (HRR) and oxygen uptake reserve (VO: 2R) at GET as markers of the
transition between light-to-moderate and moderate-to-high effort intensity domains. The high cost of equipment and required expertise, however, sometimes precludes
Correspondence: P. Farinatti, Laborato´rio de Atividade Fı´sica e Promoc¸a˜o da Sau´de, Instituto de Educac¸a˜o Fı´sica e Desportos, Universidade do Estado do Rio de Janeiro, Rua Sa˜o Francisco Xavier, 524, Sala 8121F, 20550-013 Rio de Janeiro, RJ, Brasil. E-mail: [email protected]
prescribing exercise that requires measurement of GET. Alternative methods to estimate GET are therefore desirable.
Heart rate variability (HRV) has been widely used as a physiological tool to evaluate autonomic cardiac regula-tion at rest and during moderate-to-heavy physical exercise (7-10). Previous studies have shown that there is a progressive reduction in HRV during incremental exercise until achieving 50-60% of peak oxygen uptake (:
VO2 peak). At the same time, a progressive decrease in
parasympathetic activity, concomitant with an increase in sympathetic activity, occurs until GET is reached (11,12). This threshold, characterized by HRV stabilization, has been referred to as the heart rate variability threshold (HRVT), and measurements made during maximal cardiopulmonary exercise testing (CPET) suggest that it is correlated with GET (11). The HRVT could, therefore, potentially be used as a simple, low-cost alternative for GET, since the heart rate and work rate at the HRVT (like GET) can be derived from CPET and used to prescribe aerobic exercise at an appropriate intensity (11,13-19). The HRVT has an additional advantage in that its determination does not require a test subject to provide a maximum effort, as is required for the determination of GET.
Previous maximal CPET studies have found a significant, strong correlation between GET and HRVT using cycle ergometry (11,16,18,19), treadmill running (20), walking (14), and track running (13). However, no study has directly investigated the extent to which the exercise modality affects the relationship between GET and HRVT. Considering that HRV varies according to exercise mode (21) and that the physiological strain (measured by peak heart rate andVO: 2 peak) seems to be
significantly greater during treadmill exercise than during cycle ergometry (22,23), it is thus reasonable that the level of agreement between the GET and HRVT may also be affected by exercise modality. Another unanswered question is whether the intensity of aerobic exercise can be accurately prescribed using the heart rate response associated with GET and HRVT, by assuming a 1:1 relationship between the %HRR and %:
VO2R. For
example, the relationship between heart rate and VO: 2 is
currently used to estimate the energy expenditure associated with an exercise bout (1,2). However, three recent studies by our group did not confirm the hypothe-tical 1:1 relationship between the %HRR and %VO: 2R
during maximal ramp-incremented CPET (24) and pro-longed running bouts performed at different constant work rates (25,26). In both activities, the %HRR was greater than the corresponding %:
VO2R. Consequently, a change
in heart rate would not be a valid marker of the change in relative metabolic intensity, which suggests that using heart rate to prescribe training volume during aerobic exercise is not valid.
Hence, the main purpose of the present study was to
investigate the level of agreement between GET and HRVT during maximal CPET performed within three different exercise modalities (cycling, walking, and run-ning). We hypothesized that different exercise modalities would affect the level of agreement between GET and HRVT. A secondary aim was to establish whether there would be a 1:1 relationship between %HRR and %VO: 2R
at intensities corresponding to GET and HRVT.
Material and Methods
Participants
Apparently healthy men, all college students, were personally invited to participate in this study. Sixteen students (21±4 years of age (mean±SD) with a height of 175.5±6.7 cm, body mass of 77.5±11.6 kg, body mass index of 25.1±2.7 kg/m2, body fat of 11.1±5.0%, resting heart rate of 64±11 bpm, and resting VO: 2 of
3.0±0.5 mL?kg-1
?min-1) volunteered to participate in this
study. The inclusion criteria were:a) no use of medication that might influence the cardiovascular or metabolic responses to exercise (e.g., appetite suppressant, anti-depressant, antihypertensive, neuroleptics, antiarrhyth-mics, and lithium); b) no smoking or use of ergogenic substances that could affect exercise performance;c) no history of cardiovascular, respiratory, bone, muscle, or joint problems that could compromise the safety of physical exercise; and d) were engaged in physical activities of moderate/vigorous intensity lasting 30 min or more three times per week for at least 6 months prior to the study. All participants were classified as being at low risk for cardiovascular disease (2). The protocol was approved by the UERJ Ethics Committee Board (#0222.0228.000-11), and all volunteers gave written informed consent before participation in the study.
Experimental design
Each subject visited the laboratory 4 times on 4 separate days to undertake the following procedures.Visit 1. Participants completed a preparticipation screening questionnaire on cardiovascular risk to identify aspects related to physical activity, including the adaptation to treadmill use, anthropometric measurements, assess-ment of resting :
VO2, and familiarization with the test
protocols and equipment. All participants had previous experience with treadmill and cycle exercise, and none presented movement difficulties or limitations.Visits 2-4. Participants performed three maximal CPETs (cycling, walking, and running) separated by 72 h and performed in a randomized, counter-balanced order. All tests were always conducted at approximately the same time of day (between 7:00 and 11:00 a.m.) to negate any effects of circadian variation.
Resting VO: 2 assessment
%VO: 2R in accordance with available strict
recommenda-tions (27). There was no physical exercise, alcohol, soft drinks, or caffeine in the 24 h preceding the assessment, fasting for 8 h prior to the assessment, and minimum effort when traveling to the laboratory. In the laboratory, participants laid down in a quiet environment for 10 min, after which VO: 2 (mL?kg-1?min-1) was measured for
40 min. The resting VO: 2 was taken as the average of
the last 5 min of steady-state data as published elsewhere (28). The resting :
VO2was always measured at the same
time of the day, between 7:00 and 11:00 a.m.
Maximal cardiopulmonary exercise testing
Prior to CPET, the subjects were instructed not to engage in any form of physical exercise in the previous 24 h, to abstain from alcohol, soft drinks, and caffeine in the 8 h preceding the test, and fast for 3 h before the test. In the laboratory, participants laid down quietly without drinking water for 10 min in a quiet room that was kept at a relatively constant temperature (21-236C). After this rest period, the maximal CPETs were performed on a motorized treadmill (InbramedTM Super ATL, Brazil), or
on a cycle ergometer (Cateye EC-1600, CateyeTM,
Japan). The work rate increments were individualized to elicit each subject’s limit of tolerance within 8-12 min. Initially, a non-exercise model, developed to approximate the VO: 2 of a healthy population 19 to 80 years of age
(29), was applied to help design the ramp protocol. Based upon the predicted maximal oxygen uptake (VO: 2 max), the
final work rate was calculated using the equations from the American College of Sports Medicine for either cycling, walking, or running (2).
For the incremental cycling test, the predicted mean±SD final power was 348±32 W; 0 and 30 W were used for the 3-min warm-up period and initial work rate, respectively. The cycling cadence was maintained at 55 revs/min throughout the test and the mean±SD work rate increment was 32±4 W/min. The walking test was characterized by simultaneous changes in speed and slope. A 3-min warm-up period was performed at 5.0 km/ h and 0% grade. The initial and final treadmill speeds for the CPET were fixed at 4.0 and 6.0 km/h, respectively. The treadmill slopes for 60 and 100% of predictedVO: 2 max
were then calculated for the initial 19.5±1.5 and final 22.3±1.5% work rate periods, respectively. The mean±SD work rate increment was 0.22±0.01 km/h and 0.31±0.03%/min for speed and slope, respectively. For the running test, the predicted final speed was 14.4±0.8 km/h, and work rates corresponding to 40 and 60% of the predictedVO: 2 maxwere then calculated for the
3-min warm-up period (5.8±0.3 km/h) and initial work rate (8.6±0.5 km/h). The treadmill slope was set at 1% throughout the whole running test, and the rate increment was 0.64±0.04 km?h-1?min-1.
Tests were considered maximal if the participants satisfied at least three of the four following criteria (30):
a) maximum voluntary exhaustion as reflected by a score of 10 on the Borg CR-10 scale;b) 90% of the predicted maximal heart rate (HRmax=220––age), or presence of a
heart rate plateau (Dheart rate between two consecutive work rates#4 bpm);c) presence of aVO: 2plateau (D
:
VO2
between two consecutive work rates,2.1 mL?kg-1?min-1); and d) a maximal respiratory exchange ratio (RERmax)
.1.10. Participants were verbally encouraged to perform a maximal effort; holding onto the side or front bars of the treadmill was not permitted.
Breath-by-breath pulmonary gas exchange and min-ute ventilation were determined using a VO2000 analyzer (Medical GraphicsTM, USA), and data were then
retro-spectively time-averaged into 30-s bins. Prior to testing, the gas analyzers were calibrated according to the manufacturer’s instructions using a certified standard mixture of oxygen (17.01%) and carbon dioxide (5.00%), balanced with nitrogen (AGATM, Brazil). Flows and
volumes of the pneumotacograph were calibrated with a syringe graduated for a 3 L capacity (Hans RudolphTM,
USA). The ambient temperature during all testing ranged from 21 to 236C, and relative humidity ranged from 55 to 70%.
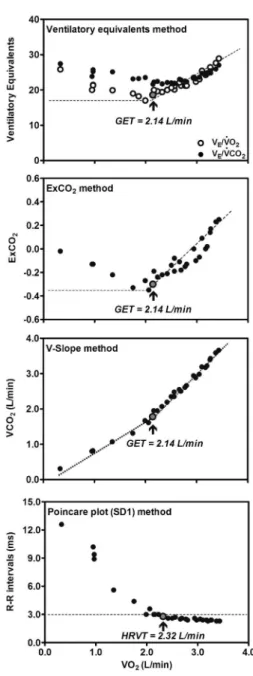
GET determination
GET was determined in accordance with the com-bined procedure described by Gaskill et al. (31), which includes: a) a ventilatory equivalent method, with GET defined as the VO: 2 corresponding to the first sustained
rise in the ventilatory equivalent of O2 without a
concomitant rise in the ventilatory equivalent of CO2;b)
an excess carbon dioxide method, with GET defined as theVO: 2corresponding to the first sustained rise in excess
CO2; andc) a modified V-slope method, with GET defined
as the :
VO2 value corresponding to the first point of
increase in theVO: 2–
:
VCO2 slope.
The final GET value for each participant was detected by simultaneously evaluating full-page graphs of data plotted for each of the three methods. Visual representa-tions of the three methods are illustrated in Figure 1. Visual inspection to determine GET was independently performed by two experienced investigators. If the difference between evaluators with regard to VO: 2 at
GET was within 3%, the mean value was adopted as the final result. When the difference exceeded 3%, a third investigator was asked to determine GET. The combina-tion of these three methods has been shown to improve the accuracy and reliability of GET determination (31).
HRVT determination
The heart rate and HRV during CPET were recorded by a heart rate monitor (RS800cx, PolarTM, Finland) with
an acquisition rate of 1,000 Hz. The R-R interval data were downloaded by the Polar Precision Performance Software (PolarTM) and analyzed using the KubiosTMHRV
of Applied Physics, University of Kuopio, Finland). The R-R intervals were averaged for each 30-s window. The sampling frequency was 1,000 Hz, and signal artifacts were filtered out by the program by excluding R-R interval values with differences of more than 20% of the preceding R-R interval (12). The HRVT was defined as the first work rate during the maximal CPET test in which the standard deviation for heart rate, calculated using Poincare plots (nonlinear method; Figure 1), when SD1 was less than 3 ms (17). Poincare plot analysis of HRV consists of
plotting each cardiac R-R interval as a function of the previous interval, which allows calculating trends in heart dynamics while removing the influence of nonstationary time series trends, as occurs during incremental exercise (32). This procedure makes possible the identification of patterns of heart rate dynamics during exercise that are not easily detected by linear time and frequency domain measures of HRV (11). Furthermore, this method of analysis was chosen because it uses the same type of visual technique that was applied to determine GET (see Figure 1), being relatively simple to use and understand (32). Previous studies have adopted the SD1 as a criterion for determining the HRVT (14-17), because this index seems to be related to parasympathetic activity and the HRVT assessment has been mainly attributed to vagal withdrawal (11).
Data analysis
Statistical analyses were performed using IBM SPSS Statistics 20 (SPSSTM Inc., USA), and data are reported
as means±SD. The effect of exercise mode (cyclingvs
walking vs running) on maximal physiological results obtained from CPET was tested with marginal models using the mixed procedure. The effect of method (GETvs
HRVT) and mode on the threshold values for heart rate,
%HRR, :
VO2, and %
:
VO2R were also tested using
marginal models. Where a marginal model was statisti-cally significant, post hoc pairwise comparisons with Sidak-adjusted P values were performed. The level of agreement between the GET and HRVT methods for each mode of exercise was assessed using Bland and Altman (33) plots and associated 95% limits of agreement (LoA), and ordinary least squares regression. The effect size and the prediction errors from the regression analysis are reported as the coefficient of determination (R2) and
standard error of the estimate, respectively. All statistical assumptions were checked and verified using standard graphic methods (34). Statistical significance for all inferential statistical tests was determined to be P#0.05.
Results
Table 1 shows HRpeak, absolute
:
VO2 peak, relative
:
VO2 peak, maximal minute ventilation (
:
VEmax), maximal
respiratory exchange ratio (RERmax), and time to
exhaus-tion obtained in the incremental exercise tests. Mean HRpeak and absolute and relative
:
VO2 peak were
signifi-cantly higher during treadmill walking and running com-pared to cycling. Mean RERmax was significantly higher
during treadmill walking than during running, and the mean time to exhaustion was significantly higher in cycling and treadmill running than in treadmill walking.
Table 2 depicts data for heart rate, %HRR, relative
:
VO2, %
:
VO2R and work rates at GET and HRVT in
the three modes of exercise, as well as relevant statistics for GET-HRVT differences. The mode of exercise had a
Table 1. Mean±SD values for HRpeak, absolute
:
VO2 peak, relative
:
VO2 peak,
:
VEmax,RERmax, and time to exhaustion in the three maximal cardiopulmonary exercise tests.
Exercise modalities P
Cycling Treadmill walking
Treadmill running
Cyclingvs treadmill
walking
Cyclingvs treadmill
running
Treadmill walkingvs treadmill running
HRpeak(bpm) 187 ± 11 194 ± 9 196 ± 10 0.004 ,0.001 0.30
:
VO2 peak(mL/min) 2888 ± 405 3336 ± 507 3356 ± 359 ,0.001 ,0.001 1.00
:
VO2 peak(mL?kg-1?min-1) 37.7 ± 6.2 43.3 ± 5.0 43.8 ± 5.1 ,0.001 ,0.001 0.96
:
VEmax(L/min) 91.0 ± 16.2 91.9 ± 13.7 99.0 ± 12.1 0.99 0.075 0.13
RERmax 1.12 ± 0.04 1.14 ± 0.03 1.10 ± 0.04 0.68 0.14 0.014
Time to exhaustion (min) 10 ± 2 9 ± 1 10 ± 2 0.020 0.95 0.003
HRpeak: peak heart rate;
:
VO2 peak: peak oxygen uptake;
:
VEmax: maximal minute ventilation; RERmax: maximal respiratory exchange ratio (n=16). The P values were derived from marginal models using the mixed procedure in SPSS.
Table 2. Mean±SD values for HR, %HRR, relativeVO: 2, %
:
VO2R,and work rate at the GET and HRVT for the three modes of
exercise, as well as relevant statistics for GET-HRVT differences.
GET HRVT GET-HRVT differences Regression analysis results
Mean ± SD Mean ± SD Mean
diff
95%CI SD 95%
LoA
b0 b1 R2 SEE
Cycling
HR (bpm) 133 ± 7 135 ± 9 2 1-4 3 ––4-8 34.971 0.728* 0.86 2.1
HRR (%) 56 ± 8 58 ± 9 2 1-3 3 ––4-8 5.584 0.869* 0.90 2.5
:
VO2(mL?kg-1?min-1) 20.2 ± 5.8 19.6 ± 6.0 ––0.6 ––1.7-0.5 2.0 ––4.5-3.3 5.371 0.737* 0.82 1.7
:
VO2R (%) 49 ± 9 47 ± 11 ––2 ––5-1 6 ––14-10 17.422 0.666* 0.71 4.9
Power (W) 109 ±14 107 ± 13 ––2 ––6-2 7 ––16-12 16.167 0.833* 0.76 6.7
Walking
HR (bpm) 141 ± 11 144 ± 16 3 ––1-7 8 ––13-19 51.823 0.622* 0.85 4.4
HRR (%) 60 ± 9 62 ± 12 2 1-5 6 ––10-14 20.064 0.643* 0.77 4.4
:
VO2(mL?kg-1?min-1) 21.8 ± 5.3 22.9 ± 6.5 1.1 ––0.6-2.8 3.2 ––5.2-7.4 5.321 0.719* 0.77 2.7
:
VO2R (%) 47 ± 12 49 ± 15 2 ––2-6 8 ––14-18 11.454 0.720* 0.71 6.9
Speed (km/h) 4.3 ± 0.1 4.4 ± 0.2 0.1 ––0.007-0.3 0.3 ––0.5-0.7 8.825 ––1.040* 0.32 0.2
Slope (%) 17.9 ± 2.7 18.3 ± 3.0 0.4 ––0.4-1.2 1.4 ––2.4-3.2 0.325 1.004* 0.78 1.5
Running
HR (bpm) 148 ± 14 152 ± 15 4 1-7 5 ––6-14 14.561 0.878* 0.87 5.3
HRR (%) 64 ± 8 67 ± 10 3 1-5 4 ––5-11 14.117 0.743* 0.84 3.3
:
VO2(mL?kg-1?min-1) 24.3 ± 3.4 25.9 ± 4.8 1.5 0.04-3.0 2.8 ––3.8-6.8 9.116 0.589* 0.69 2.0
:
VO2R (%) 53 ± 7 56 ± 11 4 0.03-7 7 ––10-18 24.864 0.492* 0.70 3.8
Speed (km/h) 9.2 ± 0.4 9.6 ± 0.8 0.4 ––0.02-0.7 0.6 ––0.8-1.6 ––2.440 1.302* 0.45 0.6
The mean difference, 95%CIs, the SD, and the 95% LoA for the GET-HRVT differences are also reported for each mode of exercise. Any discrepancies between individual means and mean differences are due to rounding error. Regression results for the relationship between GET and HRVT for each mode of exercise are also shown. HR: heart rate; HRR: heart rate reserve;: VO: 2: oxygen uptake;
VO2R: oxygen uptake reserve; GET: gas exchange threshold; HRVT: heart rate variability threshold; Mean diff: mean difference
significant effect on the threshold values. Heart rate, HRR, and relative VO: 2 were, on average, 16 bpm (F=10.3,
P,0.001), 8% (F=4.4, P=0.021), and 5.2 mL?kg-1
?min-1
(F=8.2, P=0.001) higher in the running than in the cycling test, respectively. No differences were found for these variables in the comparison between running and walking, and between cycling and walking (P.0.05). The main effect of exercise modality with regard to %VO: 2R was not
significant (F=2.9, P=0.072).
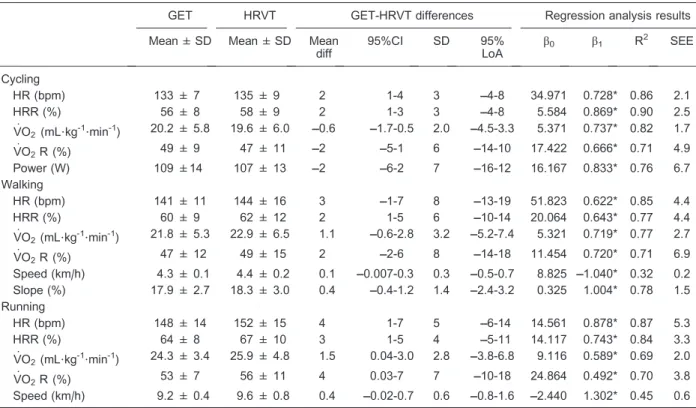
Figure 2 shows Bland-Altman plots of individual differences between the GET and HRVT methods for measuring the %HRR and %VO: 2R in the three modes of
exercise. The method of determination significantly affected the threshold values. Mean heart rate and %HRR were 3 bpm (F=14.8, P=0.001) and 2% (F=13.6, P=0.002) higher when determined by the HRVT compared with the GET. On the other hand, the method of determination had no significant effect on relativeVO: 2(F=3.1, P=0.093) or
%:
VO2R (F=1.9, P=0.10) values. The interaction
between assessment method and mode of exercise was not significant for relativeVO: 2(F=2.2, P=0.13), %
:
VO2R
(F=2.5, P=0.10), heart rate (F=0.3, P=0.74), or %HRR (F=0.2, P=0.79).
Table 2 shows the results of regression analyses for the relationship between GET and HRVT as well as the 95% LoA for the outcome variables. There was a strong relationship between the GET and HRVT methods for each of the variables, with R2values ranging from 0.69 to
0.90, except for the walking (R2=0.32) and running (R2= 0.45) speeds.
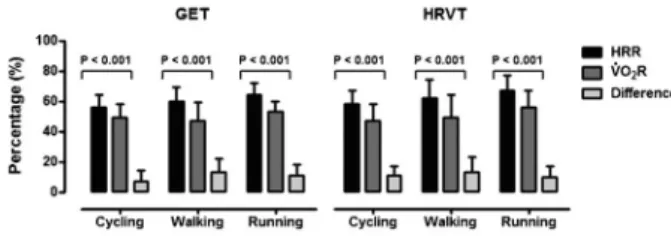
Figure 3 shows the relationship between %HRR and
%VO: 2R at GET and HRVT. A 1:1 relationship between
%HRR and %VO: 2R at GET and HRVT was not observed
for cycling (GET mean difference=7%; HRVT mean difference=11%; both P,0.001), walking (GET mean difference=13%; HRVT mean difference=13%; both P,0.001), or running (GET mean difference=11%; HRVT mean difference=10%; both P,0.001), with higher values observed for %HRR.
Discussion
The present study investigated the level of agreement between GET and HRVT during maximal CPET per-formed with different exercise modalities (cycling, walking, and running). There was a strong positive correlation between GET and HRVT in all three exercise modalities. It seems, therefore, that HRVT could be used to estimate the intensity corresponding to GET during dynamic exercises, and that the level of agreement between GET and HRVT is not affected by exercise modality.
It is well known that GET depends on the mode of exercise and characteristics of testing protocols, in addition to the analytical method used for its determination (35,36). The present data are consistent with previous studies that found a significant, strong correlation between GET and HRVT within maximal CPET (11,14-16). In fact, our data showed that SD1 stabilization occurred at intensities corresponding to ,52, 53, and 56%
:
VO2 peak for cycling,
walking, and running CPETs, which in turn are in agreement with the findings of previous studies that verified a progressive decrease followed by a stabilization of SD1 until,50-66%
:
VO2 peak (11,17,19). Furthermore, Table 2
and Figure 2 show that the differences between the GET and HRVT tended to be greater for %VO: 2R than for
%HRR. For instance, there was a strong relationship between GET and HRVT methods for heart rate and VO2,
with R2 ranging from 0.85 to 0.87 and 0.69 to 0.82, respectively, in the three exercise modalities, as shown previously by other HRVT studies (11-14,17-19). However, the LoA showed that 95% of the errors ranged between ––10 and 14 percentage points for HRR and between ––14 and 18 percentage points for VO: 2R. Regardless of the
physiolo-gical measure that is being used (HRR or VO: 2R), before Figure 3.Mean±SD percentage of heart rate reserve (%HRR), oxygen uptake reserve (%VO: 2R), and difference between
%HRR––%VO: 2R at the gas exchange threshold (GET) and heart
rate variability threshold (HRVT) (n=16). Sidak-adjusted P values indicate significant differences between %HRR and %VO: 2R.
Figure 2.Bland-Altman plots showing within-subject differences between the gas exchange threshold (GET) and heart rate variability threshold (HRVT) plotted against means of GET and HRVT for percentage heart rate reserve (%HRR) and percentage
:
VO2reserve (%
:
VO2R) obtained in the cardiopulmonary exercise
considering using HRVT as an alternative for the GET, practitioners and researchers would need to evaluate whether this amount of error is acceptable with respect to meeting their analytical goals. Regarding the level of agreement for work rate, the R2of 0.77 associated with
power on the cycle ergometer at GET and HRVT was close to the findings observed by Sales et al. (19) during cycle CPET in type 2 diabetes (R2=0.58) and nondiabetic subjects (R2=0.86) using SD1. However, the R2for walking and running speeds was 0.32 and 0.45, respectively, contrasting with the stronger correlations observed by Dourado et al. (14) and Cottin et al. (13) during walking (R2=0.90) and running (R2=0.94) in middle-aged and older adults and professional soccer players, respectively, using SD1 (14) and time-frequency analysis (13). Bearing in mind the different exercise protocols, populations, and HRVT methods, the comparisons between results of the afore-mentioned studies should be viewed with caution. However, this study adds to the current evidence by investigating the level of agreement between GET and HRVT in different exercise modalities performed by the same subjects.
Although there is some controversy about the exact mechanisms underlying the relationship between GET (4) and HRVT (11), the good association between them could be partially explained by physiological adjustments that occur in response to increasing work rate. It is accepted that factors like altered O2 kinetics due to increased
muscle demand, metabolic acidosis, hyperventilation, and higher concentrations of circulating catecholamines may influence central areas involved in control of autonomic nervous system output (37). Briefly, GET is related to an increase in blood lactate and decrease in muscle pH. To counteract ongoing metabolic acidosis, hydrogen ions produced by lactic acid dissociation are buffered by sodium bicarbonate, which increases CO2 production.
The accumulation of hydrogen ions and CO2 in muscle
and blood activate the ventilatory response via metabo-receptors and chemometabo-receptors, resulting in a nonlinear increase in the slopes of the relationships between pulmonary ventilation and work rate, and between VO: 2
and VCO: 2 (3,4). Stimulation of the medullary respiratory
center by CO2 seems to alter the parasympathetic
efferent withdrawal or sympathetic output to the myocar-dium (37). Consequently, higher HR and lower HRV are detected, which coincides with a reduction in vagal cardiac activity and increase in neurohumoral sympathetic activation to the heart (11,38). Although the physiological relationship between GET and HRVT needs to be further clarified, it is possible that both phenomena occur almost at the same time (11). Within the context of aerobic exercise prescription, this is an important finding, since HRVT can be used as a simple, low-cost alternative for GET determined by incremental exercise testing.
The GET has been recommended for prescribing exercise intensity and is usually detected at approximately 50-60% of HRR or VO: 2R (i.e., approximately within the
limits of moderate-to-vigorous intensity effort) (6). It is easy to understand that variations in the relationship
between %HRR and %:
VO2R in aerobic exercise
prescription can jeopardize the precision of determining training intensity, as well as in estimating the energy expenditure associated with an exercise bout (39). Several influential organizations, including the American College of Sports Medicine, suggest that there would be a 1:1 relationship between %HRR and %VO: 2R (1, 6). Our
results disagree with such a premise, since the %:
VO2R
at GET and HRVT was between 7 and 13% lower than the corresponding %HRR for the three exercise modalities investigated (see Table 2 and Figure 3). To illustrate the impact of our findings by assuming a 1:1 relationship between %HRR and %VO: 2R, the energy expenditure
during a single bout of 30 min at GET and HRVT would be overestimated by 56 and 61 kcal, respectively, which in turn would lead to a prediction error of 2011 and 2189 kcal after a hypothetical 3-month training program performed 3 days per week for the three exercise modalities investi-gated. Therefore, using the heart rate at GET or HRVT to control the intensity of the exercise seems to be valid. On the other hand, to prescribe exercise intensity based upon the VO: 2, and then to estimate the relative heart rate
assuming a 1:1 relationship, would probably overestimate the energy expenditure during the exercise.
Although the precise mechanisms of such nonlinear relationships between %HRR and %:
VO2R remain
unclear, this can be due to a difference in heart rate and
:
VO2 kinetics during maximal incremental CPET. It has
been suggested that the increase in VO: 2 would be
concomitant to a decrease (or plateau) in stroke volume (40), with a compensatory increase in heart rate and little variation in cardiac output. This may contribute to a decline in the filling pressure and end-diastolic volume, promoting slightly greater tachycardia and dissociation between %HRR and %:
VO2R. Another factor that may
help explain this phenomenon is an inherent time lag introduced when measuring pulmonary VO: 2, since the
increase in muscle VO: 2 is not reflected by a
correspon-dent increase at the lungs for approximately 20 s due to the circulatory transit time delay (e.g., cardiodynamic phase of VO: 2increase) (5). The result of this circulatory
transit delay is that the pulmonary :
VO2 and heart rate
signals become temporally misaligned. Such inherent errors may have important practical consequences for exercise prescription, especially within the context of energy expenditure estimates associated with training programs aimed at weight control.
to establish whether this high level of reliability is consistent across exercise modalities. Also, although the sample size of 16 participants in the present study is common in this area of research, caution should always be exercised when interpreting the accuracy of parameter estimates derived from such sample sizes.
In conclusion, in comparison with the classically used GET, the HRVT method seems to be an accurate method for evaluating the aerobic-anaerobic transition during maximal CPETs performed with different exercise mod-alities, and, therefore, for prescribing exercise intensity to improve the cardiorespiratory fitness of healthy males. However, it is worth mentioning that the hypothetical 1:1 relationship between %HRR and %VO: 2R could not be
reproduced, which limits its applicability to estimate the energy expenditure associated with an aerobic exercise bout. Future research is warranted to investigate the applicability of the present findings in populations with different demographic (e.g., women, children, elderly) and clinical (e.g., cardiovascular disease, diabetes, obesity, etc.) characteristics.
Acknowledgments
Research partially supported by the Carlos Chagas Filho Foundation for Research Support in the State of Rio de Janeiro and by the Brazilian Council for Technological and Research Development.
References
1. Garber CE, Blissmer B, Deschenes MR, Franklin BA, Lamonte MJ, Lee IM, et al. American College of Sports Medicine position stand. Quantity and quality of exercise for developing and maintaining cardiorespiratory, musculoske-letal, and neuromotor fitness in apparently healthy adults: guidance for prescribing exercise. Med Sci Sports Exerc 2011; 43: 1334-1359, doi: 10.1249/MSS.0b013e318213fefb. 2. ACSM. ACSM’s guidelines for exercise testing and pre-scription. 8th edn. Baltimore: Lippincott Williams & Wilkins; 2009.
3. Davis JA. Anaerobic threshold: review of the concept and directions for future research.Med Sci Sports Exerc1985; 17: 6-21.
4. Wasserman K, Whipp BJ, Koyl SN, Beaver WL. Anaerobic threshold and respiratory gas exchange during exercise. J Appl Physiol1973; 35: 236-243.
5. Whipp BJ, Ward SA, Lamarra N, Davis JA, Wasserman K. Parameters of ventilatory and gas exchange dynamics during exercise.J Appl Physiol Respir Environ Exerc Physiol1982; 52: 1506-1513.
6. Mezzani A, Hamm LF, Jones AM, McBride PE, Moholdt T, Stone JA, et al. Aerobic exercise intensity assessment and prescription in cardiac rehabilitation: a joint position state-ment of the European Association for Cardiovascular Prevention and Rehabilitation, the American Association of Cardiovascular and Pulmonary Rehabilitation, and the Canadian Association of Cardiac Rehabilitation. J Cardiopulm Rehabil Prev 2012; 32: 327-350, doi: 10.1097/HCR.0b013e3182757050.
7. Kumae T. Assessment of training effects on autonomic modulation of the cardiovascular system in mature rats using power spectral analysis of heart rate variability. Environ Health Prev Med2012; 17: 415-422, doi: 10.1007/ s12199-012-0272-z.
8. Christoforidi V, Koutlianos N, Deligiannis P, Kouidi E, Deligiannis A. Heart rate variability in free diving athletes. Clin Physiol Funct Imaging2012; 32: 162-166, doi: 10.1111/ j.1475-097X.2011.01070.x.
9. Gladwell VF, Brown DK, Barton JL, Tarvainen MP, Kuoppa P, Pretty J, et al. The effects of views of nature on autonomic control. Eur J Appl Physiol 2012; 112: 3379-3386, doi: 10.1007/s00421-012-2318-8.
10. Borges J, Soares P, Farinatti P. Autonomic modulation following exercise is impaired in HIV patients.Int J Sports Med2012; 33: 320-324, doi: 10.1055/s-0031-1297954. 11. Tulppo MP, Makikallio TH, Takala TE, Seppanen T, Huikuri
HV. Quantitative beat-to-beat analysis of heart rate dynamics during exercise.Am J Physiol1996; 271: H244-H252.
12. Yamamoto Y, Hughson RL, Nakamura Y. Autonomic nervous system responses to exercise in relation to ventilatory threshold. Chest 1992; 101: 206S-210S, doi: 10.1378/chest.101.5_Supplement.206S.
13. Cottin F, Medigue C, Lopes P, Lepretre PM, Heubert R, Billat V. Ventilatory thresholds assessment from heart rate variability during an incremental exhaustive running test. Int J Sports Med2007; 28: 287-294, doi: 10.1055/s-2006-924355.
14. Dourado VZ, Banov MC, Marino MC, de Souza V, Antunes LC, McBurnie MA. A simple approach to assess VT during a field walk test. Int J Sports Med2010; 31: 698-703, doi: 10.1055/s-0030-1255110.
15. Dourado VZ, Guerra RL. Reliability and validity of heart rate variability threshold assessment during an incremental shuttle-walk test in middle-aged and older adults. Braz J Med Biol Res2013; 46: 194-199, doi: 10.1590/1414-431 X20122376.
16. Karapetian GK, Engels HJ, Gretebeck RJ. Use of heart rate variability to estimate LT and VT.Int J Sports Med2008; 29: 652-657, doi: 10.1055/s-2007-989423.
17. Lima JRP, Kiss MAPD. Heart rate variability threshold.Rev Bras Ativ Fis Saude1999; 4: 29-38.
18. Mourot L, Tordi N, Bouhaddi M, Teffaha D, Monpere C, Regnard J. Heart rate variability to assess ventilatory thresholds: reliable in cardiac disease?Eur J Prev Cardiol 2012; 19: 1272-1280, doi: 10.1177/1741826711423115. 19. Sales MM, Campbell CS, Morais PK, Ernesto C,
Soares-Caldeira LF, Russo P, et al. Noninvasive method to estimate anaerobic threshold in individuals with type 2 diabetes. Diabetol Metab Syndr2011; 3: 1, doi: 10.1186/1758-5996-3-1.
21. Leicht AS, Sinclair WH, Spinks WL. Effect of exercise mode on heart rate variability during steady state exercise.Eur J Appl Physiol2008; 102: 195-204, doi: 10.1007/s00421-007-0574-9.
22. Abrantes C, Sampaio J, Reis V, Sousa N, Duarte J. Physiological responses to treadmill and cycle exercise.Int J Sports Med2012; 33: 26-30, doi: 10.1055/s-0031-1285928. 23. Jamison JP, Megarry J, Riley M. Exponential protocols for
cardiopulmonary exercise testing on treadmill and cycle ergometer. Eur J Appl Physiol 2010; 108: 167-175, doi: 10.1007/s00421-009-1183-6.
24. Cunha FA, Midgley AW, Monteiro WD, Farinatti PT. Influence of cardiopulmonary exercise testing protocol and resting VO(2)assessment on %HR(max), %HRR, %VO(2max) and %VO(2)R relationships.Int J Sports Med2010; 31: 319-326, doi: 10.1055/s-0030-1248283.
25. Cunha FA, Catalao RP, Midgley AW, Gurgel J, Porto F, Farinatti PT. Do the speeds defined by the American College of Sports Medicine metabolic equation for running produce target energy expenditures during isocaloric exercise bouts?Eur J Appl Physiol2012; 112: 3019-3026, doi: 10.1007/s00421-011-2275-7.
26. Cunha FA, Midgley AW, Monteiro WD, Campos FK, Farinatti PT. The relationship between oxygen uptake reserve and heart rate reserve is affected by intensity and duration during aerobic exercise at constant work rate. Appl Physiol Nutr Metab2011; 36: 839-847, doi: 10.1139/h11-100.
27. Compher C, Frankenfield D, Keim N, Roth-Yousey L. Best practice methods to apply to measurement of resting metabolic rate in adults: a systematic review. J Am Diet Assoc2006; 106: 881-903, doi: 10.1016/j.jada.2006.02.009. 28. Cunha FA, Midgley AW, Monteiro W, Freire R, Lima T, Farinatti PT. How long does it take to achieve steady state for an accurate assessment of resting VO(2) in healthy men? Eur J Appl Physiol 2013; 113: 1441-1447, doi: 10.1007/s00421-012-2571-x.
29. Matthews CE, Heil DP, Freedson PS, Pastides H. Classification of cardiorespiratory fitness without exercise testing. Med Sci Sports Exerc 1999; 31: 486-493, doi: 10.1097/00005768-199903000-00019.
30. Howley ET, Bassett DR Jr, Welch HG. Criteria for maximal oxygen uptake: review and commentary. Med Sci Sports Exerc 1995; 27: 1292-1301, doi: 10.1249/00005768-199509000-00009.
31. Gaskill SE, Ruby BC, Walker AJ, Sanchez OA, Serfass RC, Leon AS. Validity and reliability of combining three methods to determine ventilatory threshold. Med Sci Sports Exerc 2001; 33: 1841-1848, doi: 10.1097/00005768-200111000-00007.
32. Rajendra AU, Paul JK, Kannathal N, Lim CM, Suri JS. Heart rate variability: a review.Med Biol Eng Comput2006; 44: 1031-1051, doi: 10.1007/s11517-006-0119-0.
33. Bland JM, Altman DG. Statistical methods for assessing agreement between two methods of clinical measurement. Lancet1986; 1: 307-310, doi: 10.1016/S0140-6736(86)90837-8. 34. Grafen A, Hails R.Modern statistics for the life sciences.
Oxford: Oxford University Press; 2002.
35. Buchfuhrer MJ, Hansen JE, Robinson TE, Sue DY, Wasserman K, Whipp BJ. Optimizing the exercise protocol for cardiopulmonary assessment. J Appl Physiol Respir Environ Exerc Physiol1983; 55: 1558-1564.
36. Millet GP, Vleck VE, Bentley DJ. Physiological differences between cycling and running: lessons from triathletes.Sports Med2009; 39: 179-206, doi: 10.2165/00007256-200939030-00002.
37. Mitchell JH. Cardiovascular control during exercise: central and reflex neural mechanisms.Am J Cardiol1985; 55: 34D-41D, doi: 10.1016/0002-9149(85)91053-7.
38. Perini R, Veicsteinas A. Heart rate variability and autonomic activity at rest and during exercise in various physiological conditions. Eur J Appl Physiol 2003; 90: 317-325, doi: 10.1007/s00421-003-0953-9.