ABSTRACT: The increasing demand for raw material for multiple uses of forest products and by-products has attracted the interest for fast growing species, such as the Australian Cedar (Toona ciliata), which presents high productive and economic potential. This study aimed at estimating genotypic parameters and values for the species through the use of the BLUP procedure, at individual level, with repeated measures, by means of the conventional evaluation procedures and the introduction of innovative digitalization of the measurements by digital camera with the images provided by the Imagej software system. The main objective is to subsidize the begin-ning of a breeding program for the species. The assays were carried out in private properties, in plantations located in the state of Rio de Janeiro, Brazil. The results generated by three evalu-ations revealed that the image digital analysis is adequate to quantify characteristics of Toona ciliata. It is also an effective and accurate alternative to minimize the costs of data collection in evaluations with the species. There was high accuracy for the characters plant height, diam-eter at breast height and cylindrical volume. Out of the 90 genotypes evaluated, 38 expressed genotypic values predicted for the diameter at breast height higher than the general average of this character, 33 for the cylindrical volume and 49 for height, allowing gains of up to 24.9 % in average for cylindrical volume. The method of mixed models (REML/BLUP) applied via the SELE-GEN software system, using the BLUP procedure at individual level and repeated measures in each individual proved to be adequate to estimate the genetic parameters and predict genotypic values in situations of unbalanced data. Therefore, it is very useful and practical for Toona ciliata genetic breeding programs.
Keywords: Australian Cedar, mixed models
Introduction
The increasing demand for raw material for mul-tiple uses of forest products and by-products has at-tracted the interest in fast growing species with high productive potential and relevant economic return, such as the Australian Cedar (Toona ciliata), an exotic species of the family Meliaceae, which, according to Pinheiro et al. (2006), has found absolutely favorable conditions to develop in Brazil.
The adoption of accurate methods in the selection of better individuals in breeding programs with perenni-al plant species, such as forest species, is directly related to the potential success of the methodology. The success of breeding is related to the unmistakable capacity to select the best individuals that will be the parents of the next generations (Cruz and Carneiro, 2004).
The selection process of perennial plants should be based on the additive genetic values of the individuals that will be used in the recombination and the genotypic values of the individuals to be cloned (Resende, 2002). The individual procedure best linear unbiased prediction (BLUP) has been adequate to predict genetic values in the evaluation of perennial plants, by predicting genetic values of random effects of the statistical model, through observations of the phenotypic characteristics, adjusting the data to the fixed effects and the uneven number of information in the plots, by means of the mixed model methodology (Verardi et al., 2009).
Padilha et al. (2003) and Farias Neto (2002) have emphasized the importance of the repeatability mod-els (parameter associated to the phenotypic correlation among repeated measures in the same individual) for the genetic evaluation of some perennial species, such as erva-mate (Ilex paraguariensis St.Hil), and fast grow-ing forest species. The genetic evaluation involvgrow-ing indi-viduals of these species is based on models that consider both the effect of the permanent environment and the mentioned repeatability.
In spite of the potential of the BLUP technique, the quantifications of biometric characteristics in forest species of interest for the market have been currently estimated by conventional procedures, which demand more time and resource. Besides, some characteristics are difficult to be accessed and highly susceptible to er-rors of inference, such as the canopy diameter. An alter-native for this is the use of non-conventional procedures, such as that proposed in this study, which performs the measurement of the desired characteristics in individu-als of populations by means of the analysis of images with the use of digital camera with photographical docu-mentation via the Imagej software system. Therefore, this study aimed at estimating parameters and genotype values by the BLUP procedure at the individual level, in populations of Australian Cedars, using several individu-als and repeated measures, estimated by conventional procedures of measurement and by digitalization of images, aiming at assessing the efficiency of the non-Received November 25, 2010
Accepted January 10, 2012
1UENF/CCTA – Lab. de Melhoramento Genético Vegetal – 28015-610 – Campos dos Goytacazes, RJ – Brasil. 2UENF/CCTA – Lab. de Fitotecnia – 28015-610 – Campos dos Goytacazes, RJ – Brasil.
3UFV – Depto. de Engenharia Florestal – 36570-000 – Viçosa, MG – Brasil.
*Corresponding author <[email protected]> Edited by: Antonio Costa de Oliveira
Toona ciliata
genotype selection
with the use of individual BLUP with repeated measures
Rulfe Tavares Ferreira1, Alexandre Pio Viana1*, Déborah Guerra Barroso2, Marcos Deon Vilela de Resende3, Antônio Teixeira do
conventional estimates in Toona ciliata and subsidize the start of a breeding program with the species.
Materials and Methods
The assays were carried out in commercial planta-tions of Australian Cedar in three locaplanta-tions: i) Triunfo, located in Santa Maria Madalena-RJ (22º51’ S; 41º09’ W, 118 m a.s.l; ii) Alto Imbé, located in Santa Maria Madale-na-RJ (21º59’ S; 41º58’ W; 340 m a.s.l.); and iii) in Tra-jano de Moraes-RJ (22º07’ S; 42º13’ W; 660 m a.s.l).
The plantations were implanted in the second half of 2005, in the spacing of 3 × 2 m, with seedlings pro-duced by seminal via. The seeds used in Triunfo were from the state of Espírito Santo and those of Alto Imbé and Trajano, from plantations of Viçosa-MG. Thirty in-dividuals were randomly preselected in each plantation, and three measurements were performed, with 6-month intervals between them. After completion, the average was used for all analyses.
Phenotyping via digital and conventional analysis In this study, in which a new methodology was used for variable measurement by means of a digital camera, the averages of the digitalized images were compared, and then measurements were performed of the diameter at breast height (DBH) and stem diameter (SD) in an image, and height (H) in another image, with the use of the Imagej software system, in comparison to the manual collection using Suta to measure the di-ameter at breast height (DBH) and stem didi-ameter (SD), and graduated scale to measure height (H), in the same population.
The preselected plants were evaluated as for the fol-lowing characteristics: plant height (H), diameter at breast height (DBH), cylindrical volume (CV), stem diameter (SD), distance between nodes (Internodes) and canopy di-ameter (CD). Those were estimated by two procedures: i) measurement using Suta and graduated scale; and the diameter at breast height (DBH) was measured: in cen-timeters (cm), at 1.3 m of the height of the trunk base. The cylindrical volume (CV): was indirectly estimated, through the use of the equation (π/4) x DBH2. H, using
the measurements of the characteristics mentioned in the equation, which had been previously achieved. The stem diameter (SD):in centimeters (cm), was estimated at the base of the plants. The distance between nodes (Inter-nodes): in centimeters (cm), was achieved through the weighted average of the distances among the nodes im-mediately superior to 1.30m of height of the base of the trunk. The diameter of the canopy (CD): in centimeters (cm), was quantified at the height of the branches, and the image of the base of the plant was achieved focus-ing the canopy and ii) measurfocus-ing the desired characteris-tics, through the analysis of the images of each individual from two different positions by the Imagej software sys-tem. The images were achieved with the use of a digital camera, with resolution of 4.1 mega pixels.
The data achieved by the conventional method-ology of measurement and by image digital analysis were subjected to the test of homogeneity of variances (F test) and t-test for two independent samples, to as-sess the validation of the data achieved by means of digitalized image.
In this aspect, the study aimed at investigating if the digital analysis methodology differed from the manual data collection methodology, which is tradi-tionally used. For such, the Student t-test was applied to contrast the differences among population averages, considering the paired data, that is, for the same popu-lation, testing the digital analysis of the images and the manual data collection.
Genetic parameter estimates
The genetic values were estimated with the use of the Selegen-REML software system through the in-dividual BLUP procedure with repeated measures for the characteristics plant height (H), diameter at breast height (DBH), cylindrical volume (CV), stem diameter (SD), distance between nodes (Internodes) and canopy diameter (CD).
The prediction of the genetic values followed the statistical model, in the context of the mixed linear mod-els, presented as follows: y = Xm + Zg + Wi + e, in which: y is the data vector, m is the vector of the effects of the local combinations and measurements (assumed as fixed) added to the general mean, g is the vector of the genotypic effects added to the vector of the effects of permanent environment (assumed as random), i is the vector of the effects of the genotype × measurement in-teraction and, e is the vector of errors or residues (ran-dom). The capital letters represent the incidence matri-ces for the mentioned effects. The vector m comprises all the measurements in all the locations and adjusts simul-taneously, for the effects of locations, measurement and location × measurement interaction.
The equations of mixed models to estimate the fixed effects and predict the random effects by the BLUP procedure, presented by Resende (2000) are given by:
,
in which:
;
;
To achieve the variance components, the following estimators were used:
Vgm: variance of the genotype × measurement
interac-tion.
Ve: temporary residual variance.
Vf: individual phenotypic variance. Vf = Vg + Vet
r: repeatability of individual plants.
c2gm =c21: coefficient of determination of the effects of the
genotype × measurement interaction.
rgmed: genotypic correlation through measurements.
rm: repeatability of the average of genotypes
(determina-tion).
Acgen: accuracy in the selection of genotypes.
Results and Discussion
The results achieved for the characteristics di-ameter at breast height (DBH), stem didi-ameter (SD) and plant height (H) are shown in Table 1. The averages were statistically equal by the t test in the comparison among averages for both methodologies analyzed. This fact guarantees that the results achieved for the variables
mentioned by image analysis can be safely used and that it is a viable and effective alternative to measure char-acteristics for the populations evaluated, facilitating the formation of a “pool” of information, which would be more difficult to be achieved with the use of the conven-tional procedures.
Estimates of variances, repeatability of the charac-teristics and accuracy of three evaluations
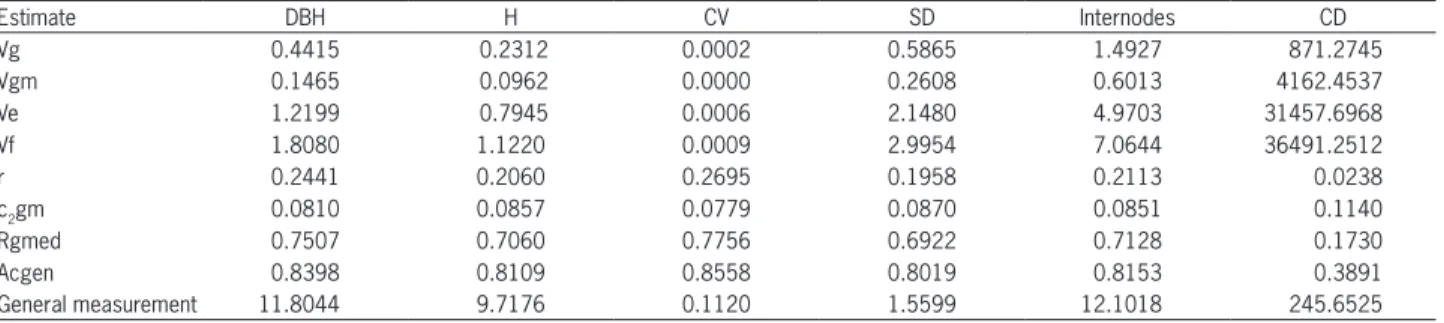
For the characters growth, diameter at breast height (DBH), plant height (H), cylindrical volume (CV), stem diameter (SD), distance between nodes (internodes) and canopy diameter (CD), the repeatability estimates varied between 0.023876 and 0.269556, as presented in Table 1, and the values for DBH (0.244188), H (0.206068) and CV (0.269556) were consistent with the magnitudes reported by Sampaio et al. (2002), in Pinus and by Garcia and Nogueira (2005) in Eucaliptus, for the same charac-teristics evaluated in this study.
The estimates of repeatability for the characteristic CV are located inside the interval of values of heritabil-ity estimates achieved by Resende (2002), between 0.14 and 0.62, for timber volume in Eucalyptus grandis. The same author, using values found in literature, provides magnitudes of heritability averages for timber volume of 0.2l, based on 528 estimates for many forest species. It is necessary to emphasize that the values of repeatability measured for timber volume in T. ciliata, at three years of age, was 0.269556, with value accuracy of 0.855802, according to Table 2, revealing good perspectives of ge-netic gains in future breeding programs.
The most important function of heritability in genetic studies on the metric character, according to Falconer (1987), is its predictive capacity and the ex-pression of the confidence of the phenotypic value as a guide for the genetic value. Repeatability represents the maximum value that heritability may achieve in the broad sense, because repeatability and heritability are different, since the genotypic variance used to estimate the repeatability is not only of genetic origin, but still masked by the variance components of the permanent environment and among individuals (Cruz et al., 2004). Thus, since the variance caused by the permanent envi-Table 1 – Averages of the digital and conventional analyses referring
to the diameter at breast height (DBH), stem diameter (SD) and plant height (H). The same letters in the column do not differ (“t” test, p < 0.05).
DBH SD H
Method Average s2 average s2 average s2 Manual 14.02 a 7.44 a 18.12 a 9.72 a 12.00 a 1.16 a Digital 13.80 a 7.04 a 17.20 a 7.81 a 11.90 a 1.21 a
Table 2 – Estimates of repeatability (r), genotypic variance (Vg), phenotypic variance (Vf), variance of the genotype x measurement interaction (Vgm), temporary residual variance (Ve), coefficient of determination of the effects of the genotype x measurement interaction (c2gm), genotypic correlation through the measurements (rgmed), accuracy in genotype selection (Acgen) for the variables diameter at breast height (DBH), plant height (H), cylindrical volume (CV), stem (SD), distance between nodes (internodes) and canopy diameter (CD).
Estimate DBH H CV SD Internodes CD
Vg 0.4415 0.2312 0.0002 0.5865 1.4927 871.2745
Vgm 0.1465 0.0962 0.0000 0.2608 0.6013 4162.4537
Ve 1.2199 0.7945 0.0006 2.1480 4.9703 31457.6968
Vf 1.8080 1.1220 0.0009 2.9954 7.0644 36491.2512
r 0.2441 0.2060 0.2695 0.1958 0.2113 0.0238
c2gm 0.0810 0.0857 0.0779 0.0870 0.0851 0.1140
Rgmed 0.7507 0.7060 0.7756 0.6922 0.7128 0.1730
Acgen 0.8398 0.8109 0.8558 0.8019 0.8153 0.3891
ronmental effects is minimized, repeatability becomes closer to heritability and they might even be equal, in case the estimate of the genotypic variance is exclusively of genetic nature.
As for the character DBH, works with eucalyptus, such as those developed by Rocha et al. (2007) and Mar-tins et al. (2003), have revealed satisfactory heritability close to 0.3000. Kageyama et al. (1977) evaluated popula-tions of Pinus patula, in two locations and achieved esti-mates of relative heritability for the traits H and DBH, respectively, of 0.2873 and 0.1872 for a location, and 0.1623 and 0.1373 for the second location. The character DBH is considered the most important for the purposes of selection for wood production in E. urophylla and E. grandis (Rocha et al., 2007). For these species, estimates of heritability of 0.2785 and 0.2247 and accuracies of 0.61 and 0.53, respectively for E. urophylla and E. gran-dis, are satisfactory for the genotype selection based on DBH (Rocha et al., 2007). Similarly, repeatability values of 0.2441 and accuracy values of 0.8398 (Table 2) are consistent references for Toona ciliata.
Height, with estimated repeatability of 0.206068 and accuracy of 0.81095, is consistent with the interval presented by Garcia and Nogueira (2005) for the selec-tion of clones of eucalyptus and higher than the estimates achieved by Kageyama et al. (1977), for provenances of
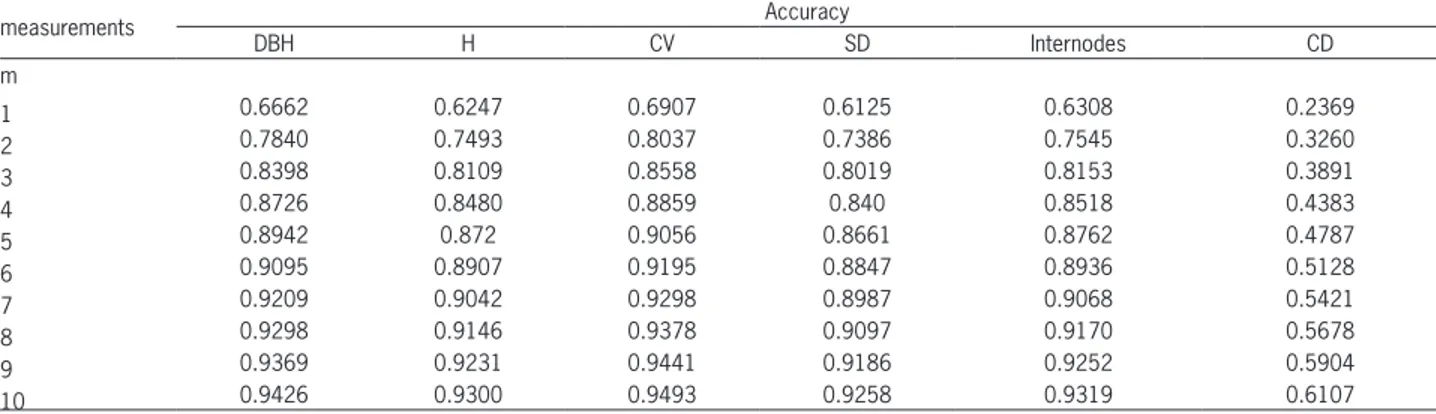
Pinus, indicating that there are real possibilities of ge-netic gains in the populations of Toona ciliata evaluated. The repeatability estimate achieved for canopy di-ameter (D.Canopy) of 0.023876 (Table 2) presented the lowest magnitude, indicating the highest irregularity of the superiority of the individuals among the ments for this character. In this aspect, for ten measure-ments, it would be possible to achieve accuracy estimate of 0.61. This high irregularity demonstrates that geno-type selection based on this trait is not a good strategy. As for the characteristic CV, according to the Table 3, five measurements would be necessary to achieve ac-curacy slightly higher than 0.90.
The estimates of the parameter accuracy for the variables diameter at breast height (DBH), plant height (H), cylindrical volume (CV), stem diameter (SD) and
dis-tance between nodes (Internodes) presented values rang-ing from 0.801902 to 0.855802. For the canopy diameter (CD), the accuracy estimate was 0.389126. It must be emphasized that Resende and Duarte (2007) proposed the classification of the statistical accuracy as very high (Acgen ≤ 0.90), high (0.70 ≤ Acgen ≤ 0.90), moderate (0.50 ≤ Acgen ≤ 0.70) and low (Acgen ≤ 0.50). Excepting for CD, in this study, the accuracy estimates were high, demonstrating high accuracy in the assessment of the true genetic variation based on the phenotypic variation observed in every trait. For CD, the low accuracy was probably caused by the high environmental influence, which disqualifies this characteristic for selection proce-dures in Toona ciliata.
The low interaction with age, observed by the ge-notypic correlations during measurements (Rgmed), for the characteristics evaluated, demonstrates that selec-tion can be performed at any of the development stages used for measurements.
The best precision in relation to the uniformity in the repetition of the character CV demonstrates that it is the best characteristic to be used for selection, because it expresses the best genetic control. However, since this variable is more difficult to be quantified, it can be concluded that the best option is the selection by DBH because it expresses high uniformity in the sequential evaluations, it is easy to quantify and presents high cor-relation with the character CV (Table 4). It corroborates the affirmations of Martins et al. (2003) and Sampaio et
Table 3 – Efficiency of the use of measurements of the same individual over time for the traits diameter at breast height (DBH), height (H), cylindrical volume (CV), stem diameter (SD), distance between nodes (Internodes) and canopy diameter (CD) in Toona ciliata.
measurements Accuracy
DBH H CV SD Internodes CD
m
1 0.6662 0.6247 0.6907 0.6125 0.6308 0.2369
2 0.7840 0.7493 0.8037 0.7386 0.7545 0.3260
3 0.8398 0.8109 0.8558 0.8019 0.8153 0.3891
4 0.8726 0.8480 0.8859 0.840 0.8518 0.4383
5 0.8942 0.872 0.9056 0.8661 0.8762 0.4787
6 0.9095 0.8907 0.9195 0.8847 0.8936 0.5128
7 0.9209 0.9042 0.9298 0.8987 0.9068 0.5421
8 0.9298 0.9146 0.9378 0.9097 0.9170 0.5678
9 0.9369 0.9231 0.9441 0.9186 0.9252 0.5904
10 0.9426 0.9300 0.9493 0.9258 0.9319 0.6107
Table 4 – Pearson correlation coefficients among the characteristics diameter at breast height (DBH), stem diameter (SD), distance between nodes (Internodes), canopy diameter (CD), height (H) and cylindrical volume (CV).
al. (2002), who recommended selection with fulcrum in DBH, also due to easy evaluation and accuracy. Howev-er, the most important reason is the high additive genetic correlation with height and volume.
Selection and estimates of gains
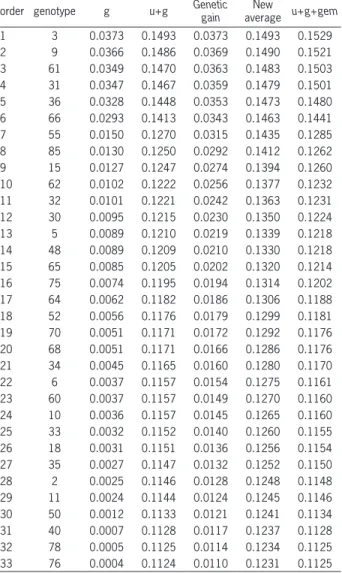
Thirty-three genotypes were selected (Table 5), out of the 90, corresponding to 36.6 % of the populations investigated for the characteristic CV. These materials presented averages higher than the general average, achieving relative performance higher than 96 %. The genotype 3, located in Triunfo, occupied the first posi-tion in the ranking for CV, with genotypic value equal to 0.0373 and new average of 0.1493 m3, caused by the
increase in 24.9 % in the general average for the char-acter. The genotype presenting the best ranking position for Trajano was that of the order 31, which occupied, for CV, the fourth position in the hierarchy. Its genotypic value was 0.0347 and the new average, 0.1479 m3,
re-vealing an increase in 24.2 % in the general average. Re-garding the location of Imbé, the genotype 61 stood out by achieving the best position in the ranking, occupying the third position for CV, genotypic value of 0.0349 and new average of 0.1483 m3, characterizing an increase in
24.4 % in the general average for the character. Finally, the genotype of the order 76 was the last to be selected for the characteristic CV, and it was allocated in the 33rd
position in the ranking, with genotypic value of 0.0004 and new average of 0.1231 m3, corresponding to an
in-crease in 9.0 % in the general average for the character. The progress expected with the selection depends on the heritability of the character, intensity of selection and phenotypic standard deviation of the character (Cruz and Carneiro, 2004). In accordance with that, the values of repeatability achieved in the present research allow the prediction of excellent possibilities of genetic gains, mainly via DBH, by its parametric estimates higher than the height, since it is strongly related to the characteris-tic CV (Table 4). It allows one to infer that the selection process will also provide satisfactory results for timber volume, which is one of the most economically impor-tant characteristics for forest species.
Particularly for the characteristic timber volume, the lower correlation occurred for larger canopy diameter, with diameter at breast height. Through a global analy-sis, the lower correlation between two characteristics oc-curred between the canopy diameter and the distance be-tween nodes (Table 4). The characteristics stem diameter (SD) and distance between nodes (Internodes) present val-ues consistent with the valval-ues for growth characteristics.
The canopy diameter revealed that, for the gen-otype 5, it is possible to achieve an increase in 21.13 % in the average, designing a new average of 311.1045 centimeters. However, there must be caution with such inference, since canopy diameter was the characteristic that expressed the lowest correlation with cylindrical volume, according to Table 4.
Stability of genetic values
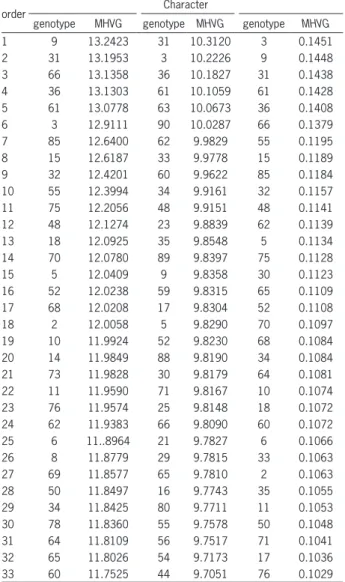
The results of simultaneous genotype ordering by their genetic values (productivity) and stability, related to the genotypic stability by the harmonic mean method of the genotypic values, according to Resende (2004), found in the Tables 6 and 7, clarify the genotypic be-havior through the measurements, since the lower the standard deviation, the higher the harmonic mean of its genotypic values over time.
The prediction based on the harmonic mean al-lows the selection by productivity and stability, simulta-neously, in opposition to the procedure based on arith-metic average, which is suitable for the selection only by productivity. Thus, the selection by the criterion that employs the highest estimates of the harmonic means of the genotypic values (MHVG) is an excellent strategy, allowing safe inferences about the prediction of the ge-netic values, with the advantage of gathering in a single selection criterion both productivity and stability. Table 5 – Genotype ordination for the best genetic value, average
and genetic gain, for the trait cylindrical volume (CV).
order genotype g u+g Genetic gain
New
The selection of the 45 individuals ranked according to the highest genetic values is concordant in 92.10 % for DBH, in 91.11 % for height and in 96.96 % for cylindrical volume, with the ranking according the average compo-nents. Genotype 9 stood out for DBH, while for H, the 31 was the first and for CV, the genotype 3 was the best.
The identification of genotypes with high yield and yield stability and wide adaptability to various en-vironments is one of the main goals of forest species breeding programs; in this case the method MHVG is a breakthrough because it is based on an analysis of pre-dicted genotypic values via a mixed model methodology (Verardi et al., 2009).
The method of mixed models (REML/BLUP) ap-plied via the SELEGEN software system, using the BLUP procedure at individual level and repeated measures in each individual proved to be adequate to estimate the
genetic parameters and predict genotypic values in situa-tions of unbalanced data. Therefore, it is very useful and practical for Toona ciliata genetic breeding programs.
References
Cruz, C.D.; Carneiro, P.C.S. 2004. Biometric templates applied to breeding. UFV, Viçosa, MG, Brazil(in Portuguese).
Cruz, C.D.; Regazzi, A.J.; Carneiro, P.C.S. 2004. Biometric models applied to genetic improvement. 3.ed. UFV, Viçosa, MG, Brazil (in Portuguese).
Falconer, D.S. 1987. Introduction to quantitative genetics. UFV, Viçosa, MG, Brazil (in Portuguese).
Farias Neto, J.T.; Yokomizo, G.; Bianchetti, A. 2002. Genetic repeatability coeficient of caracters in peach palm. Revista Brasileira Fruticultura 24: 731–733 (in Portuguese, with abstract in English).
Table 6 – Stability of genetic values (MHVG), for the characteristics diameter at breast height (DBH), height (H) and cylindrical volume (CV).
order Character
genotype MHVG genotype MHVG genotype MHVG
1 9 13.2423 31 10.3120 3 0.1451
2 31 13.1953 3 10.2226 9 0.1448
3 66 13.1358 36 10.1827 31 0.1438
4 36 13.1303 61 10.1059 61 0.1428
5 61 13.0778 63 10.0673 36 0.1408
6 3 12.9111 90 10.0287 66 0.1379
7 85 12.6400 62 9.9829 55 0.1195
8 15 12.6187 33 9.9778 15 0.1189
9 32 12.4201 60 9.9622 85 0.1184
10 55 12.3994 34 9.9161 32 0.1157
11 75 12.2056 48 9.9151 48 0.1141
12 48 12.1274 23 9.8839 62 0.1139
13 18 12.0925 35 9.8548 5 0.1134
14 70 12.0780 89 9.8397 75 0.1128
15 5 12.0409 9 9.8358 30 0.1123
16 52 12.0238 59 9.8315 65 0.1109
17 68 12.0208 17 9.8304 52 0.1108
18 2 12.0058 5 9.8290 70 0.1097
19 10 11.9924 52 9.8230 68 0.1084
20 14 11.9849 88 9.8190 34 0.1084
21 73 11.9828 30 9.8179 64 0.1081
22 11 11.9590 71 9.8167 10 0.1074
23 76 11.9574 25 9.8148 18 0.1072
24 62 11.9383 66 9.8090 60 0.1072
25 6 11..8964 21 9.7827 6 0.1066
26 8 11.8779 29 9.7815 33 0.1063
27 69 11.8577 65 9.7810 2 0.1063
28 50 11.8497 16 9.7743 35 0.1055
29 34 11.8425 80 9.7711 11 0.1053
30 78 11.8360 55 9.7578 50 0.1048
31 64 11.8109 56 9.7517 71 0.1041
32 65 11.8026 54 9.7173 17 0.1036
33 60 11.7525 44 9.7051 76 0.1029
Table 7 – Stability of genetic values (MHVG), for the characteristics stem diameter (SD), distance between nodes (internodes) and canopy diameter (D.Canopy).
order Character
genotype MHVG genotype MHVG genotype MHVG
1 85 16.1023 89 14.3659 5 350.7697
2 66 15.6169 63 14.1522 61 264.1766
3 14 15.6003 74 13.6092 31 257.3581
4 52 15.4751 59 13.6023 35 256.6419
5 68 15.4074 72 13.5812 76 254.2714
6 36 15.3843 19 13.5797 68 253.5553
7 9 15.3782 46 13.5103 74 253.4823
8 70 15.3648 66 13.4577 34 253.0608
9 55 15.3027 33 13.4116 32 252.4194
10 40 15.1854 32 13.3576 18 250.9397
11 32 15.1524 15 13.3495 69 250.0714
12 15 15.0589 80 13.3417 30 249.3698
13 64 15.0552 44 13.2445 46 248.0189
14 67 15.0157 28 13.2241 67 247.9460
15 48 15.0092 42 13.2184 66 247.8256
16 28 14.9853 26 13.1891 37 247.7625
17 26 14.9176 3 12.9538 78 246.9891
18 50 14.8963 62 12.9121 33 246.8231
19 18 14.8861 57 12.9071 50 246.3116
20 27 14.8760 36 12.8112 14 245.9909
21 59 14.8545 5 12.6722 56 245.5374
22 61 14.8064 1 12.6569 53 245.4124
23 75 14.7842 25 12.6357 62 245.0744
24 29 14.7280 50 12.5980 70 244.7079
25 69 14.7091 20 12.5771 64 244.4918
26 83 14.6988 22 12.5609 58 244.2800
27 37 14.6607 61 12.5428 73 244.2194
28 57 14.6501 76 12.5427 86 243.7336
29 8 14.6406 48 12.4796 43 243.5996
30 82 14.6339 2 12.4762 65 243.4292
31 53 14.5971 41 12.4527 40 243.4207
32 31 14.5517 51 12.4078 60 243.1728
Garcia, C.H.; Nogueira, M.C.S.N. 2005. The application of the reml/blup methodology for eucalypt clones selection. Scientia Forestalis 68: 107–112 (in Portuguese, with abstract in English).
Kageyama, P.Y.; Speltz, P.M.; Silva, A.P.; Ferreira, M. 1977. Genetic variation among provenances of Pinus patula Schiede
and Deppe in the Telêmaco Borba-PR region. IPEF 14: 77–119 (in Portuguese).
Pinheiro, A.L.; Lani, J.L.; Couto, L. 2006. Australiancedar: growth andutilization (Toona ciliata M. Roem. Var. australis (F. Muell) Bahadur). UFV, Viçosa, MG, Brazil (in Portuguese).
Rocha, M.G.B.; Pires, I.E.; Rocha, R.B.; Xavier, A.; Cruz, C.D. 2007. Selection of Eucalyptus grandis and Eucalyptus urophylla
parents for the production of interespecific hybrids using REML/BLUP and genetic diversity data. Revista Árvore 31: 977–987 (in Portuguese, with abstract in English).
Resende, M.D.V. 2002. SELEGEN-REML/BLUP: computerized genetic selection; user handbook. Embrapa Florestas, Colombo, PR, Brazil (in Portuguese).
Resende, R.M.S.; Simões, R.M.; Fernandes, J.S.C. 2000. Blup individual with repeated measures applied to breeding of perennial species. Ciência e Agrotecnologia 24: 986–997 (in Portuguese, with abstract in English).
Resende, M.D.V. 2004. Optimal statistical methods in the analysis of field experiments. Embrapa Florestas, Colombo, PR, Brazil (in Portuguese).
Resende, M.D.V.; Duarte, J.B. 2007. Precision and quality control in variety trials. Pesquisa Agropecuária Tropical37: 182–194 (in Portuguese, with abstract in English).
Sampaio, P.T.B.; Resende, M.D.V.; Araújo, A.J. 2002. Estimates of genetic parameters and selection methods for genetic improvement of Pinus oocarpa Schiede. Pesquisa Agropecuária Brasileira 37: 625–636 (in Portuguese, with abstract in English).
Santos, G.A.; Xavier, A.; Cruz, C.D. 2006. Eucalyptus grandis
progenies silvicultural performance in relation to the matrixes trees. Scientia Forestalis 70:67–76 (in Portuguese, with abstract in English).